READ THESE TERMS AND CONDITIONS CAREFULLY BEFORE USING THIS WEBSITE.
https://nrc-publications.canada.ca/eng/copyright
Vous avez des questions? Nous pouvons vous aider. Pour communiquer directement avec un auteur, consultez la
première page de la revue dans laquelle son article a été publié afin de trouver ses coordonnées. Si vous n’arrivez pas à les repérer, communiquez avec nous à PublicationsArchive-ArchivesPublications@nrc-cnrc.gc.ca.
Questions? Contact the NRC Publications Archive team at
PublicationsArchive-ArchivesPublications@nrc-cnrc.gc.ca. If you wish to email the authors directly, please see the first page of the publication for their contact information.
NRC Publications Archive
Archives des publications du CNRC
This publication could be one of several versions: author’s original, accepted manuscript or the publisher’s version. / La version de cette publication peut être l’une des suivantes : la version prépublication de l’auteur, la version acceptée du manuscrit ou la version de l’éditeur.
Access and use of this website and the material on it are subject to the Terms and Conditions set forth at Floor research at NRC Canada
Warnock, A. C. C.
https://publications-cnrc.canada.ca/fra/droits
L’accès à ce site Web et l’utilisation de son contenu sont assujettis aux conditions présentées dans le site LISEZ CES CONDITIONS ATTENTIVEMENT AVANT D’UTILISER CE SITE WEB.
NRC Publications Record / Notice d'Archives des publications de CNRC: https://nrc-publications.canada.ca/eng/view/object/?id=65781c55-636a-4e28-b585-a1c31522edb0 https://publications-cnrc.canada.ca/fra/voir/objet/?id=65781c55-636a-4e28-b585-a1c31522edb0
Conference in Building Acoustics
“Acoustic Performance of Medium-Rise Timber Buildings” December 3-4, 1998, Dublin, Ireland
FLOOR RESEARCH AT NRC CANADA
A.C.C. Warnock
About 190 floor were constructed in the IRC Acoustics Laboratory during a project lasting about 3 years. Floors with different types of joist, sub-floors, ceiling types, ceiling support systems and type and thickness of sound absorber were constructed. The joist types comprised solid wood, wood trusses, I-joists, and steel joists. Glass, rock and cellulose fiber were used in the cavities. Impact sound transmission was measured using three experimental impactors, a walker and the standard ISO tapping machine. The paper summarizes the results obtained and discusses possibilities for a revised tapping machine test and rating system.
Environ 190 planchers ont été construits dans le Laboratoire d’acoustique de l’IRC dans le cadre d’un projet d’une durée approximative de 3 ans : planchers comportant différents types de solives ou poutrelles, de supports de revêtement de sol, de sous-faces, de systèmes de soutien de la sous-face, ainsi que différents types et épaisseurs d’absorbant acoustique. On a utilisé des solives en bois massif, des fermes de bois, des solives en I et des poutrelles d’acier. Les vides de plancher ont été remplis à l’aide de fibre de verre, de roche ou de cellulose. La transmission des bruits de chocs a été mesurée au moyen de trois dispositifs d’impact expérimentaux, de personnes qui marchaient et de la machine à chocs standard de l’ISO. Ce document fait état des résultats obtenus et traite de la possibilité de modifier la machine à chocs et le système de classement.
1. INTRODUCTION
The IRC Acoustics Laboratory at NRC recently completed the measurement phase of a study of airborne and impact sound transmission through floor constructions typical of those used in Canadian housing. A summary report has been issued [1] that deals only with the single number ratings sound transmission class (STC) and impact insulation class (IIC). For each floor constructed, measurements of impact sound transmission were made using three experimental impactors, a walker and the standard ISO tapping machine.This paper compares average results from each impact device and discusses possibilities for a revised tapping machine test and rating system.
2. FLOOR IMPACT TEST FACILITIES
The floor test facility in NRC building M59 [2] where these tests were carried out comprises two rooms with volumes of about 175 m3. The bottom room is constructed of 30 cm
thick poured concrete and is supported on steel springs and neoprene placed under the floor. Floor specimens measure 3.8 x 4.7 m and are supported in a heavy concrete frame.
An earlier, similar series of measurements [3] on 75 floors was made in the floor test facility in NRC building M27. This facility has a receiving room volume of 65 m3 and a floor that measured 2.4 x 2.4 m. Some of the results from that study are presented here for comparison.
3. FLOOR TYPES
About 190 floors with different types of joist, sub-floors, ceiling types, ceiling support systems and type and thickness of sound absorber were constructed. The joist types comprised solid wood, wood trusses, I-joists, and steel joists. Glass, rock and cellulose fiber were used as sound absorbing materials in the floor cavities.
The majority of the floors tested were lightweight assemblies incorporating some kind of joists with an oriented strandboard or plywood sub-floor. Three concrete slabs were included in the series, 15 of the joist floors had concrete toppings and 21 floors included floating slabs of some kind. Only two floors had carpets. Thus the data are predominantly for lightweight joist floors which are commonly used in North America.
4. IMPACT DEVICES AND MEASUREMENT PROCEDURES
4.1. ISO tapping machine
Transmission of impact sound through floors was measured in accordance with ASTM E492 [4]. A standard tapping machine as specified in ISO 140 [5] was placed on the floor in four specified positions. Sound pressure levels and decay rates were measured in the reverberation room below from 25 to 6300 Hz. These data were used to calculate the normalized impact sound pressure level and the impact insulation class (IIC) according to ASTM E989 [6]. Note that the 8 dB limitation in E989 means that the Ln,w rating [7] is not always 110-IIC but is
nearly so.
4.2. Walkers
There is no standard method for measuring the sound pressure levels generated by a person walking on a floor. Several years ago in ASTM committee E33 a single microphone position was proposed for use when measuring peak sounds from single hammer impacts or footsteps. The microphone is placed 1 m below the mid-point of the ceiling and the room below is made less reverberant by placing sound absorbing material in it until the reverberation time is about 0.5 seconds. Although the technique has not been standardized, it is used in this laboratory for measuring walker, ball and tire levels. The single microphone technique should be adequate for comparison of floors tested within a single laboratory when peak levels are being measured.
Two members of the section have been designated as standard walkers. Both are male, weigh about 90 kg and generate about the same sound pressure levels when they walk on a floor. The walker walks for about 3 minutes while the computer collects maximum sound levels for 100 footsteps using a 35 ms time constant.
4.3. Japanese tire machine
The Japanese measurement standard JIS 1418 [8], specifies a heavy impactor source for evaluating floor constructions. An automobile tire mounted on an arm is lifted by a motor then
dropped freely on to the floor. A cam system prevents the tire from striking the floor any more than once for each free drop. JIS 1418 specifies many drop positions for the tire and several microphone positions, but earlier research at NRC with this machine showed that only a few positions of the tire were necessary when a single microphone position was being used. During these measurements the force generated by the tire machine was within the limits specified in JIS 1418.
4.4. Experimental rubber balls
The balls used in these measurements were developed by H. Tachibana [9] as part of his research and kindly provided for use at NRC. Both balls are 180 mm in diameter and weigh 2.5 kg. The first ball, designated Ball1, is less resilient than the second ball, designated Ball2. Both are dropped from a height of 900 mm at random positions in the middle of the floor. The force generated is sufficiently repeatable that only 15 impulses need be collected and averaged.
5. COMPARISONS AMONG IMPACTORS
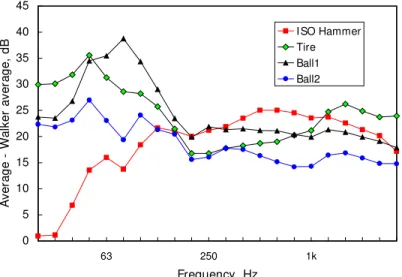
Ideally, a mechanical impactor would generate the same force spectrum as an average walker but at a higher level to facilitate measurement. To do this a mechanical impactor needs to have the same internal impedance as a walker at least over the frequency range of interest in building acoustics. To see how close the devices used in this study come to this ideal, Fig. 1 shows the average difference between the impact sound pressure levels for each device and the levels for the walker for all floor types. This graph shows that Ball2 comes closest to the ideal. Ball1 and the Tire machine generate too much low frequency sound, and the ISO tapping machine too little.
0 5 10 15 20 25 30 35 40 45 63 250 1k Frequency, Hz A v e ra g e W a lk e r a v e ra g e , d B I SO Hammer Tire Ball1 Ball2
Fig. 1: Mean difference between impact spectrum for each device and the walker spectrum.
If the shape of the difference spectrum is not ideal, it is sufficient that there be good correlation between the sound pressure levels from the mechanical impactor and those from the walker. If the correlation is good, then the levels for the mechanical impactor can be adjusted to give a spectrum more like a walker.
The squares of the coefficients for correlation of the impact sound pressure levels from the mechanical impactors and the walker are shown in Fig. 2. Except at low frequencies, the tire machine levels do not correlate well with the walker levels. Ball1 does not correlate quite as well as Ball2 and the ISO hammer at frequencies below about 315 Hz. From 25 Hz to 1 kHz,
Ball2 gives the highest correlation overall, but at and above 63 Hz, the ISO machine is almost as good. This graph indicates that from about 50 to 500 Hz, Ball2 and the ISO tapping machine should be roughly equally effective as mechanical simulators of walkers. (At least for the walker in this study.) 0.0 0.1 0.2 0.3 0.4 0.5 0.6 0.7 0.8 0.9 1.0 32 63 125 250 500 1k 2k Frequency, Hz S q u a re o f c o rr e la ti o n c o e ff ic ie n t I SO Tire Ball1 Ball2
Fig. 2: Correlations between spectra from the impactors and from the walker.
5.1. Influence of different floor types
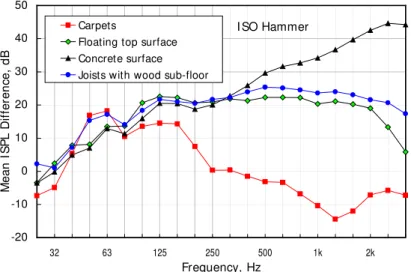
The complete set of data was separated into floors with different types of surface to examine the influence of the floor surface on the Hammer-Walker differences. The data are plotted in Fig. 3. Because of the hardness of exposed concrete, the difference curve for floors with such surfaces is much greater at frequencies above about 500 Hz than the curves for floors where the exposed surface is wood. The two carpeted floors give a quite different curve. Although only two test results were used to calculate this difference curve, the shape is similar to curves seen in the earlier study [3].
I SO Hammer -20 -10 0 10 20 30 40 50 32 63 125 250 500 1k 2k Frequency, Hz M e a n I S P L D if fe re n c e , d B Carpets
Floating top surface Concrete surface Joists with wood sub-floor
The graph shows that for frequencies up to about 500 Hz, the type of floor surface does not change the difference curve by much, except for carpeted floors. Thus, the ISO tapping machine can be used effectively as a testing device up to at least 500 Hz for all types of surface except carpet. Even with carpeted floors, the difference curve is fairly close to the others below 200 Hz. Thus if an impact spectrum for a carpeted floor is dominated by low frequency sound, any single number rating calculated for the hammer machine is likely to correlate well with the corresponding walker rating.
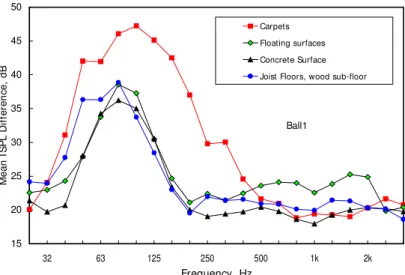
The Ball1-Walker difference curve for carpeted floors in Fig. 4 also shows marked differences from the others. All other groups give very similar difference curves because of the resilience of the impact device itself. Similar results were obtained for Ball2 and the Tire machine. These devices, because of their resilience, are largely indifferent to the type of floor surface.
Differences with carpeted floors may arise because of the influence of the carpet on the operation of the mechanical tapping devices. The carpet can also influence walkers. When the foot contacts the surface of a carpet, there is enough time for the brain to recognize this and to modify the way the foot is placed on the floor. This process takes place subconsciously, of course. In any case, floors with carpets are never the cause for complaint about high frequency noise. Complaints usually are about low frequency noise generated on carpeted joist floors, so it may be acceptable to apply a rating system that considers low frequencies to such floors. A well-crafted rating system ought not to be so lenient as IIC toward carpeted joist floors with excellent insulation at high frequencies but poor at low.
Ball1 15 20 25 30 35 40 45 50 32 63 125 250 500 1k 2k Frequency, Hz M e a n I S P L D if fe re n c e , d B Carpets Floating surfaces Concrete Surface Joist Floors, wood sub-floor
Fig. 4: Mean difference between Ball1 spectrum and walker spectrum for different groups of floors.
6. COMPARISONS BETWEEN NRC TEST FACILITIES
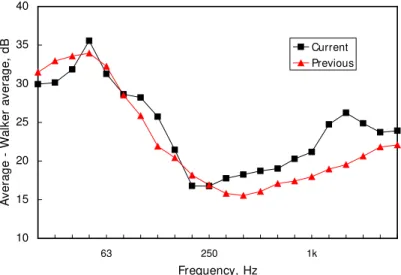
The earlier project [3] carried out in the M27 floor test facility gave similar results but in that case only the Tire machine and the walker were used as well as the ISO tapping machine. The average difference in level between the ISO machine and the walker for each project is shown in Fig. 5. The data used to calculate the average spectrum shown from the earlier project did not include carpeted floors. Also shown in this figure is the reference contour proposed by Bodlund [10] displaced to ease comparison. It is interesting to see how well it fits the two difference curves.
Some of the differences between the two projects might be due to differences in the two test facilities; receiving room volumes and floor sizes are quite different. Some differences might be attributed to the walker. While the same walkers wearing the same shoes were used, the greater floor size in the M59 facility made walking much easier there. The pattern on the floor was more often a “figure-of-eight” whereas on the smaller M27 floor the walking pattern was more often circular. Whatever the reason, the differences are greatest below 80 Hz and above about 630 Hz. 0 5 10 15 20 25 30 32 63 125 250 500 1k 2k Frequency, Hz A v e ra g e W a lk e r a v e ra g e , d B Current Previous BI C
Fig. 5: Difference between ISO hammer and walker spectra in two test facilities. Floors4 is the current project, Floors3 is the earlier similar project in the NRC M27 facility.
The Tire-Walker differences shown in Fig. 6 are quite small. This is surprising because the amplitude of the Tire force during the M59 project was that specified in JIS 1418. During the M27 project the peak force was reduced to 2.9 kN, about 1 kN less than specified in the standard. While this is puzzling, it is hardly worth pursuing since the Tire machine does not seem to offer a useful alternative to the ISO tapping machine.
10 15 20 25 30 35 40 63 250 1k Frequency, Hz A v e ra g e W a lk e r a v e ra g e , d B Current Previous
7. POTENTIAL FOR NEW TEST PROCEDURE
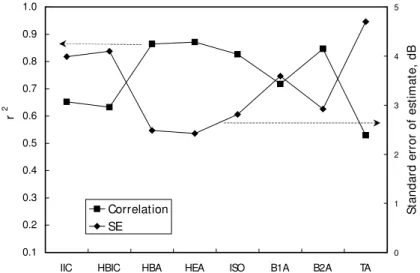
Fig. 7 shows the square of the correlation coefficients for a number of single number ratings versus the walker A-weighted level. The ratings used in the figure are now defined. IIC: Impact Insulation Class, as defined in ASTM E989.
ISO: This is the energy sum of the levels from the ISO hammer machine from 50 to 2500 Hz minus 15 dB. Over the years, different rating systems have been proposed for the ISO tapping machine. The latest is embodied in Annex A of ISO 717 itself [7] where an adaptation term CI is introduced. This term is defined as
CI = Ln,sum – 15 – Ln,w dB (1)
where Ln,sum is the energy sum of the impact sound pressure levels. Annex A suggests
that building code regulations might use the sum of CI and Ln,w as a single number rating.
If this is done, then the rating is simply Ln,sum - 15. The frequency range for calculation
of CI is specified as 100 to 2500 Hz for 1/3 octave bands. In a note, the use of an
extended frequency range, down to 50 Hz, is suggested and that is what was used here. HBIC: Hammer Bodlund Isolation Class. Measured data for the ISO hammer in the range 50 to
500 Hz are fitted to the contour proposed by Bodlund [10] using a similar procedure to that in ISO 717 and a single number rating obtained.
HBA: Hammer Bodlund A-weighted. Measured data at each frequency are adjusted upward according to Bodlund’s contour values. HBA is the A-weighted level of the resulting adjusted data curve in the frequency range 50 to 500 Hz. This weighting procedure is roughly equivalent to adjusting the measured ISO hammer levels so the Hammer-Walker difference curve becomes more closely horizontal (See Fig. 5).
HEA: Hammer Experimental A-weighted. The two average curves in Fig. 5 were combined to create a contour similar in shape to the Bodlund contour. This contour was used to adjust measured spectra for the ISO Hammer upward and the A-weighted level of the weighted curves calculated for the frequency range 50 to 500 Hz.
B1A, B2A, TA:
These three ratings are simply the measured A-weighted levels for Ball1, Ball2, and the Tire respectively.
Other ratings were investigated but correlated poorly with the Walker A-weighted level and are not shown here. The data in Fig. 7 show several things. IIC and thus Ln,w do not correlate
very well with Walker A-weighted levels. Neither does the HBIC rating. The ISO rating correlates well and is almost as good as the weighted ratings HBA and HEA. Ball1 A-weighted levels do not correlate as well as A-A-weighted levels from Ball2 and the Tire machine seems particularly poor in this project. The standard error of the estimate of walker level from the other ratings gives an indication of the uncertainty of prediction and supports the conclusions based on the square of the correlation coefficients. Part of the uncertainty arises because the repeatability for the walking test is not that small. The standard deviation of the A-weighted levels for six walker measurements repeated over a number of days on the same floor was 1.3 dB.
0.1 0.2 0.3 0.4 0.5 0.6 0.7 0.8 0.9 1.0
IIC HBIC HBA HEA ISO B1A B2A TA
0 1 2 3 4 5 S ta n d a rd e rr o r o f e st im a te , d B Correlation SE r 2
Fig. 7: Correlation coefficients and standard error of estimate of walker level predicted from other ratings.
Fig. 8 shows a scatterplot of the ISO rating versus the Walker A-weighted level. The floors tested included some very poor constructions that gave high levels when struck with the ISO hammer or walked on. Most of the data and the scatter occurs for walker levels less than about 55 dBA. This corresponds to an IIC of around 45 and an Ln,w of about 65. Most floors
submitted for testing and used in buildings are likely to have IIC values greater than 45 so it seemed that it would be useful to focus on those floors where the walker A-weighted level was less than 55 dBA.
50 55 60 65 70 75 80 85 90 95 30 40 50 60 70
Walker A-weighted level, dB
F la t le v e l 5 0 -2 5 0 0 ( IS O )-1 5 , d B
Fig. 8: Scatterplot showing energy sum for ISO hammer from 50 to 2500 Hz versus walker A-weighted level.
When the range of data is restricted in this way, although the correlation coefficients are somewhat reduced, the same result is seen — IIC and HBIC do not correlate as well as the two A-weighted levels, HBA and HEA, and the ISO rating.
0.3 0.4 0.5 0.6 0.7
IIC HBIC HBA HEA ISO
R -squar ed 2.0 2.2 2.4 2.6 2.8 3.0 St andar d Er ro r of Est im a te , dB Correlation SE
Fig. 9: Correlation coefficients and standard error of estimate of walker level predicted from other ratings for floors with walker levels less than 55 dBA.
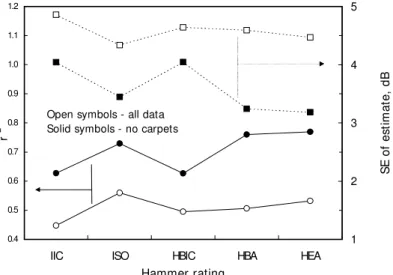
0.4 0.5 0.6 0.7 0.8 0.9 1.0 1.1 1.2
IIC ISO HBIC HBA HEA
Hammer rating 1 2 3 4 5 S E o f e st im a te , d B
Open symbols - all data Solid symbols - no carpets
r
2
Fig. 10: Correlation coefficients and standard error of estimate of walker level predicted from other ratings. Data from project in reference [3]
The same ratings were calculated and the same comparisons made using the data from the earlier project in reference [3]. It should be remembered that the floor size and receiving room volume were quite different in that project. The results can be seen in Fig. 10. In this figure the data are separated into two groups: all the floors tested (75) and the 51 that did not have carpets as the walking surface. Including carpets reduces the correlation between the hammer ratings and the walker A-weighted level but the same conclusions are reached. The ISO rating gives good correlation with A-weighted levels for the walker as do the HEA and HBA ratings.
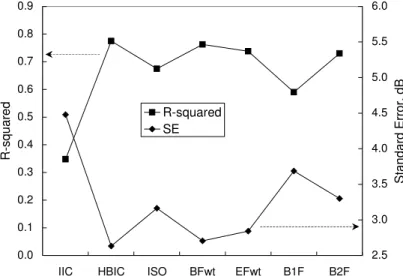
The same general conclusions are reached if one works with unweighted overall levels, in this case the total energy from 50 to 500 Hz. Fig. 11 shows the correlations and standard error of the estimate for a few single number ratings. Some new ratings have been added.
BFwt: Each measured spectrum was adjusted upward using the Bodlund contour and the overall level calculated for the frequency range 50 to 500 Hz.
EFwt: The contour calculated from the two average curves in Fig. 5 was applied to the measured spectra for the ISO Hammer and the unweighted overall level calculated for the frequency range 50 to 500 Hz.
B1F, B2F:
These ratings are the unweighted overall levels for Ball1 and Ball2 calculated for the frequency range 50 to 500 Hz. 0.0 0.1 0.2 0.3 0.4 0.5 0.6 0.7 0.8 0.9
IIC HBIC ISO BFwt EFwt B1F B2F
R -squar ed 2.5 3.0 3.5 4.0 4.5 5.0 5.5 6.0 St andar d Er ro r, dB R-squared SE
Fig. 11: Correlations and standard error of estimate for different flat ratings versus the flat level for the walker data.
The conclusions drawn for the ISO hammer using A-weighted levels remain the same. The IIC rating does not correlate well as the other ratings with the Walker Flat level. Ball2 is better than Ball1 as might be expected from an examination of the average difference curves in Fig. 1.
8. CONCLUSIONS
The major conclusion drawn from this work is largely the same as that found in the earlier project [3], namely, there seems to be no need to abandon the use of the ISO tapping machine. The two experimental balls give good agreement with walker levels (with Ball2 being clearly superior). They do offer simplicity of operation, zero maintenance and portability and ought to be significantly cheaper than a tapping machine. Ball2 would appear to be a good choice as an impact device if we did not have to deal with the existence and long history of the ISO tapping machine. It is possible that much existing tapping machine data can be re-processed to give a different single number rating that will be more useful than either IIC or Ln,w. Thus the
convenient choice is to stay with the ISO tapping machine but to modify the test procedure, or introduce a new version, so levels are measured to 50 Hz and one of the better single number ratings discussed here could be used.
The ISO rating offers the advantage of simplicity although, for this set of data, the correlation with walker levels is slightly less than the A-weighted ratings HBA and HEA. With an appropriate filter, field measurements would become quick and simple. These reasons are probably enough to make the ISO rating the choice for a new standard rating system.
A remaining problem is the subjective reaction to intruding footstep noise. Work needs to be done to establish whether people simply react to the loudness of intruding sound or whether the process is a more complicated one involving the detectability of signals in noise.
9. REFERENCES.
[1] Warnock, A.C.C. and Birta, J.A. “Summary Report For Consortium On Fire Resistance And Sound Insulation Of Floors: Sound Transmission Class And Impact Insulation Class Results”, Internal Report IRC-IR-766, Institute for Research in Construction, National Research Council Canada, Ottawa, K1A 0R6.
[2] R.E. Halliwell, J.D. Quirt, and A.C.C. Warnock, “Design and Commissioning of a New Floor Sound Transmission Facility”, Proc INCE 93, p995.
[3] Warnock, A.C.C., “Low frequency impact sound transmission through floor systems”., Inter-Noise 92, Toronto, p743, 1992
[4] ASTM E492 Standard Test Method for Laboratory Measurement of Impact Sound Transmission through Floor-ceiling Assemblies using the Tapping Machine.
[5] ISO 140-6, Acoustics, Measurement of sound insulation in buildings and of building elements, Laboratory measurements of impact sound insulation of floors
[6] ASTM E989 Standard Classification for Determination of Impact Insulation Class.
[7] ISO 717 Acoustics — Rating of sound insulation in buildings and of building elements Part 2: Impact sound insulation.
[8] JIS 1418 Japanese National Standard describing impact testing of floors.
[9] Tachibana, Tanaka, Koyasu. “Heavy impact source for the measurement of impact sound insulation of floors”, Proc. INCE 92, p 643.
[10] Rating of Impact Sound Insulation between dwellings", Kaj Bodlund, Statens Provningsanstalt, Technical Report 1985:01, also J. Sound and Vibration, 102(3), p381, 1985. Bodlund, K., Alternative reference curves for evaluation of the impact sound insulation between dwellings, J. Sound and Vibration (1985), p381-402.