Cellular heterogeneity mediates inherent sensitivity–
specificity tradeoff in cancer targeting by synthetic circuits
The MIT Faculty has made this article openly available.
Please share
how this access benefits you. Your story matters.
Citation
Morel, Mathieu et al. “Cellular Heterogeneity Mediates Inherent
Sensitivity–specificity Tradeoff in Cancer Targeting by Synthetic
Circuits.” Proceedings of the National Academy of Sciences 113, 29
(July 2016): 8133–8138 © 2016 National Academy of Sciences
As Published
http://dx.doi.org/10.1073/pnas.1604391113
Publisher
National Academy of Sciences (U.S.)
Version
Final published version
Citable link
http://hdl.handle.net/1721.1/115130
Terms of Use
Article is made available in accordance with the publisher's
policy and may be subject to US copyright law. Please refer to the
publisher's site for terms of use.
Cellular heterogeneity mediates inherent sensitivity
–
specificity tradeoff in cancer targeting by
synthetic circuits
Mathieu Morela,b,c,1, Roman Shtrahmana,1, Varda Rotterd, Lior Nissime,2, and Roy H. Bar-Ziva,2
aDepartment of Materials and Interfaces, Weizmann Institute of Science, Rehovot, Israel, 76100;bEcole Normale Supérieure, Paris Sciences et Lettres (PSL)
Research University, Université Pierre et Marie Curie, CNRS, Département de Chimie, UMR 8640 PASTEUR, 75005 Paris, France;cUniversité Pierre et Marie
Curie Paris 06, École Normale Supérieure, CNRS, UMR 8640 PASTEUR, 75005 Paris, France;dDepartment of Molecular Cell Biology, Weizmann Institute of
Science, Rehovot, Israel, 76100; andeSynthetic Biology Center, Massachusetts Institute of Technology, Cambridge, MA 02139
Edited by José N. Onuchic, Rice University, Houston, TX, and approved June 3, 2016 (received for review March 16, 2016) Synthetic gene circuits are emerging as a versatile means to target
cancer with enhanced specificity by combinatorial integration of multiple expression markers. Such circuits must also be tuned to be highly sensitive because escape of even a few cells might be detrimental. However, the error rates of decision-making circuits in light of cellular variability in gene expression have so far remained unexplored. Here, we measure the single-cell response function of a tunable logic AND gate acting on two promoters in heterogeneous cell populations. Our analysis reveals an inherent tradeoff between spec-ificity and sensitivity that is controlled by the AND gate amplification gain and activation threshold. We implement a tumor-mimicking cell-culture model of cancer cells emerging in a background of normal ones, and show that molecular parameters of the synthetic circuits control specificity and sensitivity in a killing assay. This suggests that, beyond the inherent tradeoff, synthetic circuits operating in a hetero-geneous environment could be optimized to efficiently target malig-nant state with minimal loss of specificity.
synthetic gene circuits
|
cellular heterogeneity|
cancer gene therapy|
cell-state targeting
|
mammalian synthetic biologyT
he design of gene circuits capable of precisely targeting cancer cells is a major challenge in synthetic biology (1–3), in light of the prospects of using engineered viruses for cancer gene therapy (4), or designing T cells expressing chimeric antigen receptors (CAR-T) (5). Ideally, targeting circuits must be highly sensitive to eradicate all cancer cells, and sufficiently specific to protect surrounding tissues. Gene expression markers that are hyperactive in cancer but not in healthy cells are natural candi-dates for cancer gene therapy (6). However, a single marker does not suffice because it might be moderately active in normal cells, which would result in incorrect identification. Combining mul-tiple markers improves specificity because a weakly active one will buffer the others by thresholding (7, 8), as in Boolean logic circuits converting graded inputs into digital-like output (9–14). The response function of such circuits––input/output activation threshold, amplitude, and sharpness––can be tuned by DNA specificity, promoter design, or protein–protein affinity (15, 16). We previously reported a dual-promoter integrator (DPI) as a logic AND gate to combine the activity of two cancer-specific promoters, and express a reporter or killer gene only when both promoters are decidedly active (17). Subsequently, others used a multiinput logic circuit based on microRNAs to target cancer (18). This Boolean approach provides reliable results on average, but ignores the heterogeneity of cell states. Input values may span a continuum due to expression noise (19, 20) and cancer heterogeneity (21). Furthermore, so-called synthetic circuits are not truly digital all-or-none, but rather analog systems that pro-duce continuous signals using transcription factors, expression regulators, and machinery whose concentrations fluctuate (22); errors in decision-making are hence expected. Consequently, en-hancing specificity by combining multiple inputs will inevitablyresult in cancer cells escaping targeting, whereas increasing sen-sitivity might lead to targeting of normal cells.
In this paper we consider the inherent tradeoff in specificity and sensitivity of a targeting circuit. We measured the response function of a DPI at the single-cell level in transfected colorectal cancer cells, and observed how decision-making errors emerge due to cellular heterogeneity in expression. We then measured how the median and variance of the output distribution depend on the DPI amplification and activation threshold, which demon-strates that circuit noise affects the precision of decision-making. Then, we measured the sensitivity and specificity of various DPI designs using a model system of stably infected premalignant and cancer lung fibroblasts. Finally, we performed a killing assay on a tumor-like model comprising a coculture of the cancer cells sur-rounded by the nonmalignant ones, which validated that high sensitivity comes at the expense of reduced specificity.
Results and Discussion
The Sensitivity–Specificity Tradeoff in Targeting Circuits.The main
idea of this paper is demonstrated by considering the task of targeting a tumor growing in a background of normal cells using a synthetic AND gate circuit. As inputs we choose two promoters that are up-regulated in cancer cells, and assume their expression patterns in the two populations are overlapping due to variability
Significance
The recent advance in the use of viral vectors for gene delivery, combined with the design of synthetic gene circuits to diagnose and target cells, brings opportunities for effective treatment of cancer. So far, gene circuits have been considered logical devices capable of discriminating normal from malignant cells as discrete states, ignoring cellular heterogeneity in cancer expression markers. We addressed the inherent limitations heterogeneity imposes on the precision of targeting circuits. Using molecular parameters to control circuit gain amplification and threshold, we show an inherent tradeoff emerges between specificity and sensitivity. In light of this tradeoff, the molecular optimization of targeting circuits will be an important step for effective imple-mentation of personalized gene therapy.
Author contributions: M.M., R.S., V.R., L.N., and R.H.B.-Z. designed research; M.M. and R.S. performed research; V.R. contributed new reagents/analytic tools; M.M., R.S., L.N., and R.H.B.-Z. analyzed data; and M.M., R.S., V.R., L.N., and R.H.B.-Z. wrote the paper. The authors declare no conflict of interest.
This article is a PNAS Direct Submission.
Freely available online through the PNAS open access option.
1M.M. and R.S. contributed equally to this work.
2To whom correspondence may be addressed. Email: liorni@mit.edu or roy.bar-ziv@
weizmann.ac.il.
This article contains supporting information online atwww.pnas.org/lookup/suppl/doi:10. 1073/pnas.1604391113/-/DCSupplemental. PHY SICS BIOPHYSICS AND COMPUTATIONAL BIOLOGY
(Fig. 1A). The AND gate generates a simple bimodal response with high output only if both promoter activities are above an activation threshold (Fig. 1B). However, the overlap in input space implies that perfect classification of cancer and normal cells as respective high (true positive) and low (true negative) output states is not possible. Cancer with inputs below threshold will be identified as false negative, and hence not targeted. Similarly, noncancer cells with high inputs will be targeted as false positive identification.
In addition, the AND gate response function is not ideal, with a distribution of values around the high/low states, and a tran-sition that is continuous rather than digital (Fig. 1C). The circuit will mainly generate a bimodal response, except in cells whose inputs are close to the activation threshold, which will generate output ranging from low to high. For this nonideal binary clas-sifier we need to define a killing threshold, above which output level is considered sufficient to kill the cell, and that optimally separates low and high states. Output distribution width and cells with intermediate output level (gate sharpness) could thus appear as new sources of detection errors. At this killer gene threshold, we can reduce the false negative error rate by amplifying the circuit output (Fig. 1D). Shifting the output distribution to higher values will increase the fraction of cells detected in the high state. Consequently, more cancer cells will be killed and the sensitivity improved. But, this comes at the expense of increased noise at the low state, resulting in enhanced rate of false positive detection, which implies reduced specificity. Alternatively, we can shift the
activation threshold to higher values and reduce false positive error rate (Fig. 1E). The proportion of cells considered as low inputs will increase and more normal and cancer cells will be protected, thereby improving specificity at the expense of sensitivity. Con-versely, reducing the circuit output will increase specificity at the expense of sensitivity, whereas shifting the activation threshold to lower values will increase sensitivity at the expense of specificity.
Single-Cell Analysis of the AND Gate.The two inputs of the DPI are
duplicates of endogenous promoters and we chose two highly active cancer markers (17): the synovial sarcoma X-breakpoint protein-1 (SSX1), and the chromatin structural protein histone (H2A1), as well as the Cyclin D1 (CycD1) promoter whose du-plicate had low activity (Fig. 2A). One input drives expression of bacterial dockerin DocS fused to the viral VP16 transcription activation domain (DocS-VP16AD, or AD) and carries a nuclear localization signal (NLS). The second input drives expression of bacterial cohesin Coh2 fused to the Yeast Gal4 binding domain (Coh2-Gal4BD, or BD). The two fusion proteins combine through the high affinity binding of DocS and Coh2 proteins (23). Together, they form a synthetic transcriptional complex ʃ Prom 1 Prom 2 Prom 1 Activity Prom 2 Activity Response Function Input Prom 1 Input Prom 2 Cell-States Space Insert Genetic AND-Gate
A
C
Killing Assay on model-tumorsB
Normal Cells Cancer Cells % Cells Output % CellsInputs OOFF OON Output
ITh OTh False -True + False + True -Higher Specificity
E
% Cells Inputs Output Output % Cells OOFF OON ITh Higher SensitivityD
% Cells Output % Cells Inputs Output ITh OOFF OON OThFig. 1. Targeting cancer cells by an autonomous gene circuit. (A) We
con-sider targeting of cancer cells (red) in a background of normal ones (blue). Cells are distributed in a dual promoter-based activity map, with overlap due to cellular heterogeneity. (B) The AND gate operates on duplicates of pro-moter inputs and generates a nonlinear response function in this cancer activity space. (C) The convolution of response function (green) with inputs
distributions generates output distributed around OOFFand OONfor cells
below or above the activation gate ITh. Treatment defines a threshold OTh
above which a cell is killed, separating normal and cancer cells into protected and targeted subpopulations. (D) Linearly amplifying the output shifts
dis-tributions toward higher values at fixed ITh, which increases sensitivity
(kill-ing cancer cells) at the expense of specificity (kill(kill-ing normal cells). (E) Shift(kill-ing
IThto higher inputs expand low-output populations, improving specificity
(protected normal cells) with a loss of sensitivity (protected cancer cells).
High BD
A
Prom 2 Prom 1 DocS-VP16AD2A CFP CFPmCherry YFP 0 3 2 1C
% Cells % Cells 15 10 5 0Fluorescence Intensity [RFU]
BD-mCher Fluo [RFU]
High AD x103
B
+ 15 10 5 0 -1000100 103 104 105 BS repeats YFPMedian Fluo [RFU]
CycD1 / H2A1 H2A1 / CycD1 H2A1 / H2A1 NLS NLS CycD1 / CycD1 Coh2-Gal4BD 2AmCher CycD1 CycD1 CycD1 H2A1 H2A1 CycD1 H2A1 H2A1 AD BD
Fluorescence Intensity [RFU] -1000100 103 104 105 100 105 104 103 0 -100
E
Probability 0.04 0.06 0.08 0.1 0.02D
AD-CFP Fluo [RFU]
BD-mCher Fluo [RFU] 101 102 103 104 105
AD-CFP Fluo [RFU] 101 102 103 104 105 log2(YFP) [RFU] 4 8 12 102 103104 ʃ
5-WT YFP Fluo [RFU]
102 103104
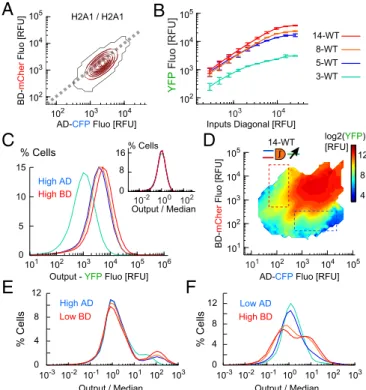
Fig. 2. Single-cell analysis of a genetic AND gate. (A) Scheme of the DPI.
Duplicates of two endogenous promoter (prom1, prom2) drive expression of two synthetic proteins and associated reporters (Coh2-Gal4BD and mCherry; DocS-VP16AD and CFP), which form a synthetic transcriptional complex ac-tivating YFP output. (B) Single-cell (SC) expression levels of reporters for HCT116 cells transfected with the 5-WT DPI design, for low (CycD1) and/or
high (H2A1) input promoters (median± SD, n = 3 experiments). (C)
Distri-butions of SC fluorescence levels (color code as in B, solid line: mean values).
(Insets) Representative fluorescence images of cells. (Scale bar: 200 μm.)
(D) Response function map of 5-WT design (pooled from a 3× 3 promoter
pair: CycD1, SSX1, and H2A1, 2.7× 10⁶cells, 3 experiments). Heat map color
coded in log2 of mean YFP. (E) Probability distributions of output for inputs along the horizontal and vertical dashed boxes in D. Gray curves represent
the median over SC data (mean± SD, n = 3 experiments).
(sTC) that binds Gal4 binding site (BS) repeats, and triggers the expression of output––a reporter, or killer gene for targeting cancer cells. By design, output is generated only if both endog-enous promoters are active above a specific threshold. To con-trol the DPI output we varied the number of binding repeats 3, 5, 8, and 14 on the output promoter and reduced the AD-BD af-finity from the wild-type (WT) two-hybrid to reduced afaf-finity variants M102 and M15 (24). Different DPI designs are hence-forth termed according to repeat number and AD-BD affinity: 3-WT, 5-M15, 5-M102, etc. Monitoring the input/output (I/O) at single-cell resolution was done using three fluorescent proteins. Inputs fused through a 2A self-cleavable peptide (25): CFP to DocS-VP16AD, mCherry to Coh2-Gal4BD. Output was reported by YFP. A fourth reporter, Sirius, driven by the constitutive PGK promoter, was used to screen for transfected cells in the flow cytometry analysis (SI Appendix, Fig. S1 and Tables S1 and S2).
We measured the distribution of the single-cell I/O of 5-WT DPI in HCT116 colorectal cancer cells. The median values showed a characteristic AND gate behavior (Fig. 2B), with background-level output when at least one of the inputs was low, (6.6± 0.8, 17.7 ± 3.0, and 11.7± 1.8 relative fluorescence unit (RFU) with promoter pairs CycD1/CycD1, CycD1/H2A1, and H2A1/CycD1, respectively) and up to 300-fold output for two high inputs (2,212± 366 RFU, with H2A1/H2A1). However, the distribution was very broad due to cell-to-cell input variability, circuit response, and plasmid copy number (Fig. 2C). Interestingly, despite low average output when one or two inputs were low, the output distribution exhibited a long tail of cells expressing high output. Conversely, when both inputs were highly active on average, the output distribution exhibited a small peak of low-output expressing cells. These error-making cells deviate from the all-or-none averaged logic AND gate and appear negligible in the population. However, they represent false negative and false positive cell-state identification.
We corrected for extrinsic noise due to variability in plasmid copy number and cell size and concatenated single-cell data of all promoter pairs to obtain a single I/O map of the AND gate, irrespective of promoter identity (Fig. 2D andSI Appendix, Figs.
S2–S4). The AND-gate function is square-shaped with two
or-thogonal activation thresholds along the AD and BD axes. A higher tip along the diagonal suggests that two identical promoters enhance the output, possibly due to their synchronous expression. The distributions along one of the axes when the other is high are sharply bimodal with a sigmoidal curve with similar minima and maxima, threshold values, and a Hill coefficient of about 5 (Fig. 2E andSI Appendix, Table S3). However, the output distribution below the activation gate at fixed high BD shows enhanced vari-ability compared with at high AD, as for single promoter pair distributions (Fig. 2C). At high inputs the output saturates but then decreases in both axes as a new population of low-output cells emerges, suggesting that forcing very high expression could be detrimental to the proper function of the AND gate.
Integrator Promoter Binding Repeats Amplify Output and Noise.To
study the effect of binding repeat number we transfected HCT 116 cells by 3-WT, 5-WT, 8-WT, and 14-WT constructs with H2A1/H2A1 promoter pair inputs, and measured the single-cell I/O response. The output increased along the diagonal in input space reaching saturating values, which amplified with the number of binding repeats (Fig. 3A and B). The output distribution me-dian and width increased to higher values with repeat number (Fig. 3C), yet the distribution normalized by the median was in-variant (Fig. 3C, Inset). This indicates that both signal and noise were uniformly amplified across all output values, which implies improved targeting of cancer cells, but at the risk of false targeting of normal ones.
We next obtained the single-cell I/O map with 3× 3 promoters for all repeats (Fig. 3D andSI Appendix, Fig. S5). We observed roughly sixfold amplification with increase of repeats from 3 to 14
without major change in input space, activation thresholds, and overall I/O structure, thus confirming the uniform amplification as for H2A1/H2A1. The output distributions for high-AD/low-BD maintained the scaling of width with median for all repeats (Fig. 3E). Interestingly, for low-AD/high-BD the width broadened with repeat number more than the median (Fig. 3F), which implies enhanced noise that reinforces the risk of false positive targeting. To conclude, increasing the number of binding repeats is an im-portant amplification mechanism that confers sensitivity and ro-bustness to the AND gate as it separates the low and high response states, but it may introduce unavoidable noise and thus decrease the targeting specificity.
Integrator Strength Determines AND Gate Threshold and Error Rates.
The AD-BD affinity, kD-C, determines the concentration of
func-tional sTC, but also the proportion of BD transported into the nucleus along with AD carrying the NLS (Fig. 4A). We studied the effect of the affinity on the output signal and noise by transfecting HCT116 cells with 5-WT, 5-M15, 5-M102 DPI designs using H2A1/H2A1 promoter pair and measured the single-cell I/O. As expected, the median output along the inputs diagonal was reduced by an order of magnitude in 5-M102 compared with 5-WT, with a milder reduction for 5-M15 (Fig. 4B).
The I/O for all 3× 3 promoter pairs showed that weaker af-finity shifted the activation threshold toward higher input values along the AD axis by a decade compared with 5-WT (Fig. 4 C andD andSI Appendix, Fig. S6). This shift is expected because at low binding affinity a higher concentration of AD is required to transport the complex into the nucleus. Interestingly, the shift along the BD axis was smaller, likely because transport is no more a
AD-CFP Fluo [RFU]
102 104 105 103 103 102 H2A1 / H2A1
B
104 103 YFP Fluo [RFU]Inputs Diagonal [RFU]
A
12 8 4 0 % Cells 10-3 10-2 10-1 100 101 102 103 Output / Median 10-3 10-2 10-1 100 101 102 103 Output / Median 8 4 0 12 High AD Low BD High BD Low AD 102 104 103 105 16 8 0 100 10-2 102 % Cells Output / Median 104 103 101 102 105 106Output - YFP Fluo [RFU]
BD-mCher Fluo [RFU] 101 102 103 104 105
AD-CFP Fluo [RFU]
101 102 103 104 105 ʃ 14-WT log2(YFP) [RFU] 4 8 12 BD-mCher Fluo [RFU] % Cells 0 High BD High AD 15 10 5 % Cells
D
C
F
E
14-WT 3-WT 5-WT 8-WT 104Fig. 3. Amplification of response function by output promoter binding
re-peats. (A) Input space for the H2A1/H2A1 promoter pair. Most of the cells (90%) are within the red contours. (B) Output expression along the inputs
diagonal (dashed line in A, median± SD, n = 3 experiments). (C) Output
dis-tributions for the H2A1/H2A1 promoter pair (3–14 BS repeats as in B, 3 × 10⁵
cells per design). (Inset) Output distributions normalized by median values.
(D) Response function map of 14-WT design (9× 10⁵cells, single experiment).
(E and F) Output distributions normalized by median for cells below activation
gates (105cells per design), with high level of AD (E, blue dashed box in D), or
high level of BD (F, red dashed box in D).
PHY SICS BIOPHYSICS AND COMPUTATIONAL BIOLOGY
limiting factor in excess of AD-NLS. We conclude that reduced integrator affinity works differently than binding repeats on pro-moter, acting to shift the activation threshold on top of a general output reduction. On the one hand, the shift in gating threshold expands the range of low inputs for which output is low. Along with the overall output reduction this protects against false positive er-rors. On the other hand, the noise at high inputs is increased and a clear threshold separation between the low and high output states is compromised (Fig. 4D), which strongly increases the false negative error rate. With weak affinity designs, the gain in specificity is counterbalanced by a loss in sensitivity.
Specificity and Sensitivity Analysis in Mixed Malignant and Premalignant
Cells. To illustrate the specificity–sensitivity tradeoff we used T3
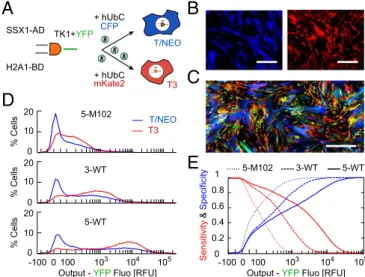
and T/NEO lineages derived from WI38 human lung fibroblasts: (i) WI38/T3 is hTERT immortalized, p53 knockdown, and H-RasV12over-expressing; (ii) WI38/hTERTfast/NEO is hTERT im-mortalized and fast proliferating, but otherwise does not show other cancer phenotype and has been classified as premalignant (26–28). We first transfected the two cell lines, choosing SSX1 (AD input) and H2A1 (BD input) as two independent cancer-related markers with a wide dynamic range of activity, and measured single-cell I/O response (SI Appendix, Fig. S7). T3 and T/NEO input spaces were strongly overlapping but T3 cells showed a higher output level at all input. Results were noisy due to low transfection efficiency; there-fore, we stably infected WI38 cells using third-generation lentiviruses (29) (Fig. 5A andSI Appendix, Fig. S8). Inputs fluorescent reporters were removed and we fused the YFP output reporter via P2A to the conditional killer gene Thymidine Kinase 1 from Herpes Simplex Virus (HSV-TK1), which triggers cell death upon addition of Ganciclovir (GCV). For cell-type identification, we labeled each cell type by a second reporter under the constitutive Ubiquitin C pro-moter (hUbCp) CFP and mKate2 for T/NEO and T3 cells, re-spectively (Fig. 5B).
We cultured mixtures of T3 and T/NEO cells infected by 5-M102, 3-WT, and 5-WT DPIs for 4 d and measured the single-cell output (Fig. 5C and D). We observed a bimodal response with one population below 100 RFU and a high one with level
about 300, 1,000, and 8,000 RFU for 5-M102, 3-WT, and 5-WT, respectively. As in HCT116 cells, for both cell types the output for 5-M102 was low compared with WT constructs and in-creasing binding repeats led to amplification. Expectedly, the output distribution of the two cell types was overlapping, which implies compromising between targeting cancer cells (i.e., sen-sitivity) and protecting premalignant ones (i.e., specificity).
To quantify this tradeoff we considered a hypothetical killing threshold of output (in YFP RFU), and computed the sensitivity as the ratio of T3 cells above this threshold to total T3 cells, and specificity as the ratio of T/NEO cells below threshold to total T/NEO cells. We then scanned the threshold values for all con-structs, obtaining predictive true positive and true negative rates of each cell classifier (Fig. 5E). When increasing the killing threshold, namely higher output required to kill a cell, we observed a de-crease in sensitivity and a reciprocal inde-crease in specificity for all constructs. Moreover, for strong DPI constructs as 5-WT, the sensitivity was close to 1 up to higher threshold values but speci-ficity remained low. Conversely for weak ones as 5-M102, sensi-tivity rapidly dropped with threshold values. We calculated a single score for the DPI as a binary classifier using standard analysis of receiver operating characteristic curve (30), which takes into account the tradeoff in sensitivity/specificity for all threshold values (SI Appendix, Fig. S9). We obtained values of 0.70, 0.66, and 0.65 for 5-WT, 3-WT, and 5-M102, respectively. This implies that 5-WT design is predictably the best cell classifier regardless of the killing threshold used. However, in practice the optimal circuit design will depend on the GCV treatment condition and effective killing threshold. In a more general context, it will also depend on the input promoters and cell types considered; hence, promoter activities, expression capability, and drug response should be assessed for every cell line.
Targeted Killing in a 2D “Tumor Model” Coculture.We next
vali-dated the sensitivity/specificity tradeoff in TK1 killing assays (Fig. 6A). By depositing a drop of a few hundred T3 cells before
100 105 104 103 0 -100
D
YFP Fluo [RFU] Probability 0.04 0.06 0.08 0.1 0.02 ʃ 5-M102C
A
105 104 103 102 101 YFP Fluo [RFU] H2A1/ H2A1 104 103Inputs Diagonal [RFU] 5-WT 5-M102 5-M15
B
Cytosol Nuclear Transport BD AD sTC Inactive Transcription Activation NLS NLS NLS NLS NLS Nucleus output BS Repeats K D-C K D-CAD-CFP Fluo [RFU]
BD-mCher Fluo [RFU] 101 102 103 104 105
AD-CFP Fluo [RFU] 101 102 103 104 105 log2(YFP) [RFU] 4 8 12 101 102 103 104
Fig. 4. Gating threshold is shifted by synthetic transcription complex affinity.
(A) Scheme of nuclear transport of AD domain and functional sTC, and tran-scriptional activity in the nucleus. (B) Output expression along the inputs
di-agonal for the H2A1/H2A1 promoter pair (dashed line in Fig. 3A, median± SD,
n= 3 experiments). (C) Response function map of 5-M102 design (9 × 10⁵cells,
single experiment). (D) Probability distributions of the output for cells at high BD (dashed box in C). The gray curve is the profile of 5-WT, given as a reference.
0 10 20 0 10 20 0 10 20 % Cells % Cells % Cells 5-M102 5-WT 3-WT
A
+ hUbC + hUbC TK1+YFP CFP mKate2C
D
H2A1-BD SSX1-AD T3 T/NEOE
B
T/NEO T3 5-M102 3-WT 5-WT 0 0.6 1 0.8 0.4 0.2 Sensitivity & Specificity 104 105 Output - YFP Fluo [RFU]103 0 100 -100 Output - YFP Fluo [RFU]
104 105 103
0 100 -100
Fig. 5. An in vitro targeting model using cancer and premalignant cells.
(A) Lentiviral delivery of DPI design and cell-identification reporter in malignant WI38/T3 and premalignant WI38/T/NEO cell lines. (B) Microscopy images of the constitutive fluorescence for T/NEO (CFP, blue) and T3 (mKate2, red). (Scale bar,
100μm.) (C) Fluorescence microscopy image of cocultured T/NEO (blue) and T3
(red) cells infected with the 5-WT design (YFP output in green). (Scale bar,
200μm.) (D) Output distributions of 5-M102, 3-WT, and 5-WT DPI designs
measured by flow cytometry (3× 10⁴cells for each cell line, pooled from three
experiments). (E) Predicted sensitivity and specificity curves as a function of the killing threshold (in unit of YFP output level) for the different designs. Values were calculated based on SC distributions in D.
plating T/NEO cells, we obtained an∼1-mm-diameter “tumor” surrounded by a“healthy tissue.” The growth of the coculture was monitored daily by fluorescence microscopy and the output expression level was measured for each population according to pixels identified by the constitutive reporters (Fig. 6B and SI
Appendix, Fig. S10). The output expression increased with time
in both T3 tumors and in surrounding T/NEO tissues, with T3 displaying higher median output at all times. We also observed that T/NEO cells at the periphery of the tumor showed an increase in output expression, probably due to short distance communication between the tumor and its direct surroundings (Fig. 6B, Bottom).
Without treatment, T3 outgrew all of the T/NEO cocultures in time, which is consistent with the loss of contact inhibition, fast growth rates, and multilayer formation of cancer cells. In con-trast, after 24 h of a 10-μM GCV treatment, tumors kept expanding for 2 d before regressing in area, and with higher killing rates for the 5-WT and 3-WT than 5-M102 (Fig. 6C and D). Tumors with a DPI lacking the output gene kept growing, consistent with specific kill due to TK1 expression. T/NEO tissues displayed slow growth before reaching a plateau between day 5 and 10, similar to growth reduction due to tumor expansion observed in negative control samples (Fig. 6E). A single treatment did not completely eradicate the tumor and we gave an additional treatment at day 11. The model tumors continued to decrease in all of the DPI samples, but for 3-WT and 5-WT, T/NEO tissue also decreased in area after this second treatment (Fig. 6E).
An end-point measurement of the treatment was done after 35 d for one experiment, clearly showing the differential sensi-tivity and specificity in targeting by DPIs (Fig. 6C). The 5-M102 demonstrated the highest specificity, protecting T/NEO cells from treatment, but proved to be insufficient to completely remove the tumor, and a small islet of T3 cells restarted growing (Fig. 6C). On the contrary, 3-WT and 5-WT resulted in a com-plete eradication of T3 cells after 1 mo but with a significant
decline in T/NEO population, demonstrating the increased false-positive identification rate of designs with high sensitivity. Discussion
Varying the DPI activation threshold and amplification and measuring the single-cell I/O in HCT116 cells revealed just how cellular variability and circuit noise limits precise targeting. Thus, single-cell analysis is a predictive tool to understand the origin of errors made by cell-state classifiers. For example, the noise ob-served with 5-M15 and 5-M102 at high inputs (Fig. 4C andSI
Appendix, Fig. S5), or with increased binding repeats at high BD
(Fig. 3E andSI Appendix, Fig. S4) reveals limitations of the mo-lecular modules used to modify the response function. Neverthe-less, the analysis showed an inherent tradeoff between sensitivity and specificity due to expression heterogeneity, and input space overlap between targeted and protected cells. Generally, a“weak” DPI leads to highly specific targeting but insufficient killing of cancer cells, whereas a“strong” one is highly sensitive, but lacks specificity, hence will kill most of the normal cells. This tradeoff implies a limitation on expression-based cell-classifier designs. Higher specificity can be achieved by shifting the activation threshold or by using multiinput gates. However, multiple inputs will reduce the overlap between the input space of cancer cells and the circuit high-output region (Fig. 1B), which implies loss of sensitivity. Therefore, for cancer therapy, in which escape of even a few cells is detrimental, excessive increase of the targeting specificity will come at the expense of the required sensitivity.
The targeting experiments with T3 and T/NEO were chal-lenging because these are closely related cell lineages despite their different morphology and malignancy state. We confirmed the differential targeting efficiency of our DPI designs for a specific killer gene (HSV-TK1) and one treatment condition. The specificity was increased when using 3-WT instead of 5-WT and even more with the mutant 5-M102, clearly showing a
Tumor-like Culture Day 4 (+/- GCV) Day 35
C
No Output ʃ ʃ ʃ ʃ ʃ Low Threshold High Amplification Day 18T/NEO-CFP / T3-mK2 TK1-2A-YFP
+ GCV - GCV + GCV + GCV + GCV 5-WT 3-WT 5-M102 5-M102
D
A
0 100 200 300 400 500 YFP Fluo [RFU]Day 1 Day 4 Day 7
T/NEO T3
B
ʃ ʃ 0.1 5 Fold T/NEO Area 1 10 Fold Tumor Area 1 0.1 Day 11 (+/- GCV) Time [Days] 6 2 10 14 18 High Threshold Low Amplification Time [Days] 6 2 10 14 18E
Specific Sensitive + Pro-drug (GCV) 5-M102 No Output 3-WT 5-WTFig. 6. The 2D tumor-like platform for cancer targeting evaluation. (A) Islets of T3 in T/NEO background infected by DPI with HSV-TK1 output were exposed
to GCV to assess designs sensitivity and specificity. (B) Output levels (YFP) of 5-M102 design during tumor growth. Pixels from T/NEO or T3 cells were obtained based on constitutive CFP and mKate2 expression. (C) Fluorescence microscopy images of the tumor-like cocultures at different time points for DPI designs as denoted in left column (T/NEO in blue, T3 in red). In green, output level at day of first treatment. (D and E) Pixel count of area, in fold relative to day of first treatment, occupied by T3 (D) and T/NEO (E) as identified by their respective constitutive color. Black arrows indicate a 24-h GCV treatment. Circles and squares represent two experiments. (Scale bar, 1 mm.)
PHY SICS BIOPHYSICS AND COMPUTATIONAL BIOLOGY
different level of protection of T/NEO cells surrounding the T3 tumor. But, under these experimental conditions, the effect of amplification on targeting sensitivity was hardly observed from 3-WT to 5-WT. Although the 5-WT was predicted to be optimal for targeting in reporter gene analysis (Fig. 5), we observed better re-sults with 3-WT. Treatment parameters should therefore be further optimized for improved targeting methodology. For example, GCV concentration and treatment duration and frequency can be tuned to shift the tradeoff to higher sensitivity or higher specificity.
Moreover, we obtained higher sensitivity in the actual killing results than expected from analysis of reporter output (Fig. 5D), in which a subpopulation of T3 cells displayed very low output level. This stronger killing efficiency may be the result of the bystander effect of TK1 activity, mediated by cell–cell transfer of phosphorylated GCV via cellular gap junctions (31). The cell-specific growth rate may also explain this imbalance as GCV kills cells upon division and may not have the same dose–response effect in each cell line. The faster division rate of T3 cells may increase the cell-death probability during treatment duration.
Another source of difference between single-cell analysis and tumor-model results is the role of cell–cell communication and spatial organization in such assays. Interestingly, additional mi-croscopy experiments showed that output expression in T/NEO cells increased when mixed with T3, compared with those grown alone (SI Appendix, Fig. S10). This observation suggests commu-nication between cocultured cells (32) and may have important implication for the dynamics of malignant states in populations. However, further elucidation is required to account for cell–cell communication, bystander effect, or gene/drug penetration when addressing the targeting of spatially constrained cells. For example,
3D-tumor models closer to real-life tumors are important to study the actual capability of synthetic circuits in cancer therapy (33–35). Toward a predictive sensitivity/specificity model, the intrinsic response function of the circuit should be combined with spatial organization and cell-type-specific features such as kinetics of growth, overall metabolism, and dose–response (36). This optimization approach can also be implemented for non-viral gene delivery systems (37) or in other targeting scenarios such as CAR-T cells. CAR-based (38, 39) and synNotch/CAR AND gates (40) were designed to increase the safety of adoptive T-cells therapy by targeting only cells that display two cancer-specific surface markers. Nevertheless, it may also come at the risk of tumor cells escaping the treatment due to antigens heterogeneity and immunoediting. Finally, synthetic circuit optimization may become part of a personalized cancer therapy toolbox (41). Materials and Methods
Materials and methods are fully described in theSI Appendix. In short,
hu-man colorectal tumor cell lines HCT 116 were transfected with various DPI designs. Inputs, output, and constitutive fluorescence were measured by flow cytometry after 48 h. Human lung cancer WI-38/T3 and WI-38/T/NEO cell lines were infected by third-generation lentiviruses to stably express DPI designs and a cell-identification reporter; fluorescence was measured either by flow cytometry or by epifluorescence microscopy. For the tumor model, a
1-mm islet of T3 cells was cocultured in a T/NEO background, 10μM GCV was
added for 24 h at day 4 and 11, and proliferation monitored daily. ACKNOWLEDGMENTS. We thank Prof. Takeharu Nagai (Osaka University) who kindly provided the Sirius gene. M.M. acknowledges the Dean of Faculty Fellowship (Weizmann Institute).
1. Weber W, Fussenegger M (2011) Emerging biomedical applications of synthetic bi-ology. Nat Rev Genet 13(1):21–35.
2. Bacchus W, Aubel D, Fussenegger M (2013) Biomedically relevant circuit-design strategies in mammalian synthetic biology. Mol Syst Biol 9(691):691.
3. Lienert F, Lohmueller JJ, Garg A, Silver PA (2014) Synthetic biology in mammalian cells: Next generation research tools and therapeutics. Nat Rev Mol Cell Biol 15(2):95–107. 4. Russell SJ, Peng K-W, Bell JC (2012) Oncolytic virotherapy. Nat Biotechnol 30(7):
658–670.
5. Srivastava S, Riddell SR (2015) Engineering CAR-T cells: Design concepts. Trends Immunol 36(8):494–502.
6. Robson T, Hirst DG (2003) Transcriptional targeting in cancer gene therapy. J Biomed Biotechnol 2003(2):110–137.
7. Anderson JC, Voigt CA, Arkin AP (2007) Environmental signal integration by a mod-ular AND gate. Mol Syst Biol 3(133):133.
8. Nissim L, Beatus T, Bar-Ziv R (2007) An autonomous system for identifying and gov-erning a cell’s state in yeast. Phys Biol 4(3):154–163.
9. Tamsir A, Tabor JJ, Voigt CA (2011) Robust multicellular computing using genetically encoded NOR gates and chemical‘wires’. Nature 469(7329):212–215.
10. Ausländer S, Ausländer D, Müller M, Wieland M, Fussenegger M (2012) Pro-grammable single-cell mammalian biocomputers. Nature 487(7405):123–127. 11. Lohmueller JJ, Armel TZ, Silver PA (2012) A tunable zinc finger-based framework for
Boolean logic computation in mammalian cells. Nucleic Acids Res 40(11):5180–5187. 12. Moon TS, Lou C, Tamsir A, Stanton BC, Voigt CA (2012) Genetic programs constructed
from layered logic gates in single cells. Nature 491(7423):249–253.
13. Bonnet J, Yin P, Ortiz ME, Subsoontorn P, Endy D (2013) Amplifying genetic logic gates. Science 340(6132):599–603.
14. Gaber R, et al. (2014) Designable DNA-binding domains enable construction of logic circuits in mammalian cells. Nat Chem Biol 10(3):203–208.
15. Khalil AS, et al. (2012) A synthetic biology framework for programming eukaryotic transcription functions. Cell 150(3):647–658.
16. Ang J, Harris E, Hussey BJ, Kil R, McMillen DR (2013) Tuning response curves for synthetic biology. ACS Synth Biol 2(10):547–567.
17. Nissim L, Bar-Ziv RH (2010) A tunable dual-promoter integrator for targeting of cancer cells. Mol Syst Biol 6(444):444.
18. Xie Z, Wroblewska L, Prochazka L, Weiss R, Benenson Y (2011) Multi-input RNAi-based logic circuit for identification of specific cancer cells. Science 333(6047):1307–1311. 19. Levens D, Gupta A (2010) Reliable noise. Science 327(5969):1088–1089.
20. Eldar A, Elowitz MB (2010) Functional roles for noise in genetic circuits. Nature 467(7312):167–173.
21. Meacham CE, Morrison SJ (2013) Tumour heterogeneity and cancer cell plasticity. Nature 501(7467):328–337.
22. Daniel R, Rubens JR, Sarpeshkar R, Lu TK (2013) Synthetic analog computation in living cells. Nature 497(7451):619–623.
23. Barak Y, et al. (2005) Matching fusion protein systems for affinity analysis of two inter-acting families of proteins: The cohesin-dockerin interaction. J Mol Recognit 18(6):491–501.
24. Karpol A, Barak Y, Lamed R, Shoham Y, Bayer EA (2008) Functional asymmetry in cohesin binding belies inherent symmetry of the dockerin module: Insight into cel-lulosome assembly revealed by systematic mutagenesis. Biochem J 410(2):331–338. 25. Kim JH, et al. (2011) High cleavage efficiency of a 2A peptide derived from porcine
teschovirus-1 in human cell lines, zebrafish and mice. PLoS One 6(4):e18556. 26. Milyavsky M, et al. (2003) Prolonged culture of telomerase-immortalized human
fi-broblasts leads to a premalignant phenotype. Cancer Res 63(21):7147–7157. 27. Milyavsky M, et al. (2005) Transcriptional programs following genetic alterations in
p53, INK4A, and H-Ras genes along defined stages of malignant transformation. Cancer Res 65(11):4530–4543.
28. Buganim Y, et al. (2010) p53 Regulates the Ras circuit to inhibit the expression of a cancer-related gene signature by various molecular pathways. Cancer Res 70(6): 2274–2284.
29. Dull T, et al. (1998) A third-generation lentivirus vector with a conditional packaging system. J Virol 72(11):8463–8471.
30. Hanley JA, McNeil BJ (1982) The meaning and use of the area under a receiver op-erating characteristic (ROC) curve. Radiology 143(1):29–36.
31. Rubsam LZ, Boucher PD, Murphy PJ, KuKuruga M, Shewach DS (1999) Cytotoxicity and accumulation of ganciclovir triphosphate in bystander cells cocultured with herpes simplex virus type 1 thymidine kinase-expressing human glioblastoma cells. Cancer Res 59(3):669–675.
32. Zomer A, et al. (2015) In vivo imaging reveals extracellular vesicle-mediated pheno-copying of metastatic behavior. Cell 161(5):1046–1057.
33. Kelm JM, Timmins NE, Brown CJ, Fussenegger M, Nielsen LK (2003) Method for generation of homogeneous multicellular tumor spheroids applicable to a wide va-riety of cell types. Biotechnol Bioeng 83(2):173–180.
34. Nyga A, Cheema U, Loizidou M (2011) 3D tumour models: Novel in vitro approaches to cancer studies. J Cell Commun Signal 5(3):239–248.
35. Tanner K, Gottesman MM (2015) Beyond 3D culture models of cancer. Sci Transl Med 7(283):283ps9.
36. Costello JC, et al.; NCI DREAM Community (2014) A community effort to assess and improve drug sensitivity prediction algorithms. Nat Biotechnol 32(12):1202–1212. 37. Conde J, Oliva N, Atilano M, Song HS, Artzi N (2016) Self-assembled RNA-triple-helix
hydrogel scaffold for microRNA modulation in the tumour microenvironment. Nat Mater 15(3):353–363.
38. Wilkie S, et al. (2012) Dual targeting of ErbB2 and MUC1 in breast cancer using chi-meric antigen receptors engineered to provide complementary signaling. J Clin Immunol 32(5):1059–1070.
39. Kloss CC, Condomines M, Cartellieri M, Bachmann M, Sadelain M (2013) Combina-torial antigen recognition with balanced signaling promotes selective tumor eradi-cation by engineered T cells. Nat Biotechnol 31(1):71–75.
40. Roybal KT, et al. (2016) Precision tumor recognition by T cells with combinatorial antigen-sensing circuits. Cell 164(4):770–779.
41. van’t Veer LJ, Bernards R (2008) Enabling personalized cancer medicine through analysis of gene-expression patterns. Nature 452(7187):564–570.