Business Collaboration for Improved Value Net Performance
byJohn S. Wass B.S.E.
Princeton University, 1983
SUBMITTED TO THE DEPARTMENT OF CIVIL AND ENVIRONMENTAL ENGINEERING IN PARTIAL FULFILLMENT OF THE REQUIREMENTS FOR THE DEGREE OF
MASTER OF ENGINEERING IN LOGISTICS AT THE
MASSACHUSETSS INSTITUTE OF TECHNOLOGY JUNE 1999
@ 1999 John S. Wass. All rights reserved
The author hereby grants to MIT permission to reproduce and to distribute publicly paper and electronic copies of this thesis document in hole or in part.
Signature of Author:
Departmnit of Civil and Environmental Engineering May 7/ 1999 f ,14
C e rtifie d b y : i r Ti
Yoqi heifi -1
Direc or f Le iir for Transportation Studies Accepted by:
AndrewV".h le ITW"
Chairman, Departmental Comn Graduate Studies
MASSACHUSETTS INSTITUTE
BUSINESS COLLABORATION FOR IMPROVED VALUE NET PERFORMANCE
By
John S. Wass
Submitted to the Department of Civil and Environmental Engineering On May 7, 1999 in partial fulfillment of the requirements
For the Degree of Master of Engineering in Logistics
ABSTRACT
This thesis defines business collaboration and places it in a context of four stages of value net integration: I) Traditional Company Structure, II) Functional Integration, III) Internal Integration, IV) External Integration. The causes of value net inefficiencies are examined and then categorized into three classes: 1) Design changes to eliminate points of amplification, 2) Changes in management policies to minimize oscillation, 3) Improved execution to reduce time. This thesis then relates the three classes of value net inefficiencies to the four stages of integration. Using this combined framework, collaboration is shown to have the most impact on reducing value net inefficiency as a
strategy to achieve STAGE IV external integration by redesigning the value net to eliminate points of amplification. With this framework, two initiatives, CPFR and
DAMA, are evaluated to asses their use of business collaboration.
Thesis Advisor: Yossi Sheffi
Title: Professor, Civil and Environmental Engineering Director, Center for Transportation Studies
TABLE OF CONTENTS
1 INTRODUCTION 7
1.1 Value Chain 8
1.2 Value Net 10
1.3 Thesis Objectives and Organization 11
2 FOUNDATIONS OF COLLABORATION 13
2.1 Value Net Initiatives 13
2.2 Quick Response (QR) 13
2.3 Stages of Value Chain Integration 17
2.4 Types of relationships 22
2.5 VNC in Current Literature 27
2.6 Conclusion 31
3 THE PROBLEM DEFINED 33
3.1 Traditional Inventory Management 33
3.2 Systems Dynamics -Forrester 37
3.3 System Dynamics -Sterman 40
3.4 System Dynamics - Towill 42
3.5 Value Net Inefficiencies Framework 44
3.6 Conclusion 46
4.2 Demand Activated Manufacturing Architecture (DAMA) 53
4.3 Conclusion 55
5 SUMMARY & CONCLUSION 56
5.1 Areas of Future Inquiry 57
LIST OF TABLES
Table 1: Contributing Factors to the "Bullwhip Effect" 36
Table 2: Forrester's Results 38
Table 3: Changed Variables 38
Table 4: Sterman's Results 41
Table 5: Towill's Results 43
Table 6: Stages of Integration and Classes of Inefficiencies 47 Table 7: QR Results by Stage (KSA, 1996) 48 Table 8: Steps in the CPFR Business Process 51
LIST OF FIGURES
FIGURE 1: Lost Sales Due to Stockouts 7
FIGURE 2: Consumer Goods Value Chain 9
FIGURE 3 Consumer Goods Value Net 11
FIGURE 4: Stage of Value Chain Integration 18
FIGURE 5: Relationship Continuum 22
FIGURE 6: AMR Collaborative Building Blocks 28
FIGURE 7: Benchmarking Partner's Process View of Collaboration 29
FIGURE 8: Collaboration as a Leap of Faith 31
FIGURE 9: Bullwhip Effect 34
FIGURE 10: Three Classes of Value Net Inefficiencies 46
1 Introduction
Two of the major challenges facing the consumer goods industry are to increase sales and, at the same time, decrease the amount of inventory and its associated costs. At the store level, these two goals seem to be contradictory because increased sales requires a reduction in stockouts, items unavailable for consumers to purchase, which requires more inventory on the shelves. Both of these issues, increased sales and lower inventories, represent billions of dollars in opportunity.
The estimated value of lost sales due to stockouts is approximately $80 billion/year, based on the 1997 consumer retail sales projections of $2.6 trillion/year (Benchmarking, 1998). Figure 1 shows that a shopper in an average supermarket will find 8.2% of items out of stock on a typical day. These out of stock items represent 6.5% of dollar sales. Of this 6.5% of sales, roughly half (3.4%) represent sales that were switched to an alternative purchase and the remainder (3.1%) represent sales that were lost due to not having the item available to sell.
% Items Out of % of Sales Alternative Lost Sales
Stock Purchase
The opportunity to improve the efficiency of the consumer goods industry by reducing inventory is estimated to be $175- $235 Billion/Year, 7%-10% of the total market sales. (Benchmarking, 1996) There have been at least two industry studies, Quick Response (QR), and Efficient Consumer Response (ECR), that have highlighted this opportunity (Garry, 1993). The magnitude of the potential savings has propelled the participants in the consumer goods industry (e.g. raw material processors, manufactures, transportation providers, distributors/wholesalers, and retailers) to look for ways to capture these savings.
Competition is a major factor forcing companies to aggressively look for these savings. In the apparel industry, for example, overseas manufacturers had doubled their market share in just 10 years so that by 1985 they had captured 44% of the U.S. market (Hammond, 1985). In the grocery industry, alternative formats (e.g. Warehouse Clubs and mass market chains) to the traditional retailer have been taking market share (KSA, 1993). These are just two examples of market forces driving companies to look for efficiencies. With competition compelling companies forward and initiatives like QR and ECR showing that an opportunity exists to improve, companies have been pursuing many different initiatives to reduce inefficiencies. So far, there does not seem to be a clear path to success.
One approach being tried in the market place is value net collaboration (VNC), which is the cooperative, long-term relationship between two or more companies in the same value net aimed at increasing their mutual profit and/or improving service to the consumer. The terms value net and value chain are defined in the next two sections.
1.1 Value Chain
Throughout this thesis the term value chain is used to describe the bi-directional flow of goods, information, and cash between raw materials and the consumer. The word supplier means the entity immediately preceding a company in the value chain in the direction of raw materials. The word customer is used to mean the next entity down the
R
A Transportation Providers
W C
M N
A Poesr Man uf acturer Ditibtr Retailer S
T Wholesaler
U
E
R 4 M
I Flow of goods, information, and cash E
A
L S
Figure 2 Consumer Goods Value Chain
value chain in the direction of the consumer. The word consumer is used to describe the entity (corporation/individual) that uses/consumes the final product.
Consider, for example, the value chain of disposable diapers. For the product flow, trees would move via truck to be converted to cellulose at the processor stage, cellulose would move by rail to be used as a component of disposable diapers at the manufacturing stage, diapers would move by full truck to be held in a warehouse at the distributor stage, diapers would move by less than truckload (LTL) to be sold from a store at the retail stage and finally diapers would be taken to a home by car to be used by a baby at the consumer stage. The product could flow back toward the manufacturer if it were defective or otherwise not wanted by the consumer.
Examples of the type of information, which moves from the consumer toward raw materials are, data about consumer purchases, data about desired product attributes, orders, promotions, forecasts, and inventory levels. The types of information that flow from raw materials toward the consumer are data about product attributes, available
inventory, price, advanced shipment notifications, lead-time, and promotions.
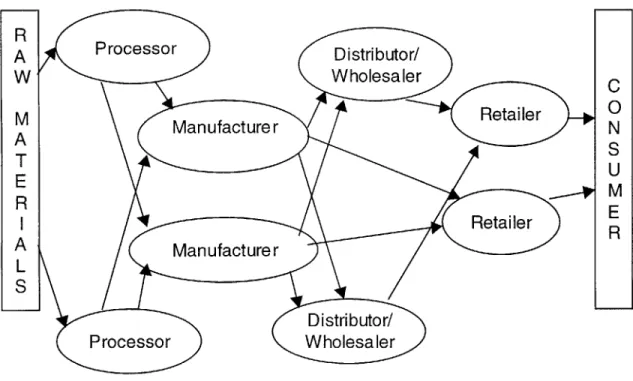
Like any model, the value chain is a simplification. One of the most important aspects of this simplification is the linear, or single string (e.g. a length of chain), assumption that is made when using the value chain model. Most analytic work has been carried out using this model since the tools being applied work well on a series of two entity relationships in a sequence. In reality, the flows that are represented in the value chain are not single two-party relationships in a series. Rather, these flows are more accurately multi-party relationships that happen simultaneously. The relationships with one party are often dependent on the relationships with another party. This level of interaction can be represented by a network with multiple branches at each node (see figure 3). Entities (e.g. manufacturer, retailer, etc) are referred to as nodes in the value net model and as levels or stages in the value chain model.
Other terms that are commonly used to describe the value chain are supply chain and demand chain. In this thesis, the term value chain will be used consistently to avoid confusion even though many of the references use the other terms.
1.2 Value Net
The value net model includes multiple inputs and outputs at each node, thus including competing suppliers or competing customers. Additionally, the model incorporates transactions that skip stages. Primarily because of these complexities, most analytic techniques do not work well with the value net model. The importance of the value net model is that it provides a better mental model to help understand empirical results.
Figure 3 Consumer Goods Value Net
1.3 Thesis Objectives and Organization
The objectives of this thesis are:
" Define VNC in the context of other improvements used to reduce inefficiencies in the value net.
" Define a common framework for the source of inefficiencies in the value net, " Evaluate VNC against this combined framework
Chapter 2 reviews the foundations of collaboration and examines how it fits into the four stages of value net integration (Baseline, Functional Integration, Internal Integration, and External Integration) suggested by Towill (1992). VNC is most applicable when a company migrates from internal integration to external integration. VNC is one of a range of relationships that companies can use to achieve (Towill, 1994) stage IV, external
Chapter 3 develops a framework to synthesize two major approaches to defining the causes of value net inefficiency. The most recent approach (Lee, 1997a) is based on a microeconomic model and the other (Forrester 1961, Sterman 1985, Towill 1992) is based on a system dynamics model. Combining these two approaches, the sources of value net inefficiencies can be categorized into a framework of value net design, management policies, and speed of execution. Chapter 4 evaluates two initiatives using this combined framework and chapter 5 summarizes the thesis and points out areas for future study.
2 Foundations of Collaboration
This chapter reviews the foundations of the current interest in VNC. The benefits of collaboration that have been quantified in connection with two initiatives, QR and ECR are briefly reviewed.
The four stages of value net integration are introduced and VNC is placed into this context. The range of relationships between companies in the value net is reviewed and VNC is positioned in this range. Finally, recent collaboration literature is reviewed to understand how it fits within this context.
2.1 Value Net Initiatives
There have been two studies that have quantified the benefits of improvements in different parts of the consumer goods value net. The QR study was first published in 1985 for companies in the apparel industry (Tripplet, 1994). It claimed that 10% savings in the efficiency of the value net were possible versus the current practice at that time. In 1993, Kurt Salmon Associates, a consulting company based in Atlanta, led the development of ECR for the grocery industry. The ECR study also showed 7% -10% savings in potential improvements to the value net (KSA 1993). In both of these initiatives, collaboration was a major ingredient in the recipe for success. QR and ECR have been a critical foundation for VNC because they have quantified the benefits of collaborating and they have shown some success, thus demonstrating that it can be done in the "real" world. This thesis will concentrate on QR because it has been around long enough for the actual results to be quantified. The actual savings for ECR have not yet been quantified
2.2 Quick Response (QR)
QR is an industry wide initiative developed as a way to reduce time, inventory and cost in the value net and improve service levels to the end consumer through technology and
1985 as a response to the fierce competition from overseas manufactures. This initiative was an industry wide program coordinated by Kurt Salmon Associates (KSA 1995). After trying for years to have the US government create import barriers, the industry took a more proactive approach (Hammond 1991). QR was designed to use value net integration as a competitive weapon against the lower factor costs of the overseas manufacturers. The key performance indicators of QR as a value net integration initiative are listed below:
" Reduce overall inventory levels throughout the whole value net " Increase inventory turns by increased sales as well as lower inventory
e Reduce forced markdowns and post season liquidations due to overstocked items e Lower stockouts at all nodes in the value net
" Improve customer service via higher in stock position and more focus
* Shorten manufacturing cycle times to respond more quickly to consumer demands 2.2.1 Apparel Industry Background
The apparel value net consists of fiber producers, textile mills, apparel manufacturers and retailers of apparel and other soft goods. This industry had historically competed largely on a cost basis; therefore, the low cost imported apparel products were devastating to domestic manufacturers. Foreign competitors from the Pacific Rim and Caribbean Basin Countries used their advantage in inexpensive labor to gain substantial market share.
Although the apparel industry competed on low cost, it wasted over $25 billion per year (in 1985) through inefficient practices (KSA 1995). Unable to compete with the low labor costs of the firms in the Pacific Rim and the Caribbean Basin, domestic firms had to look at other areas to hold their market share. The focus of QR was to find ways to offset the low cost labor advantage of overseas manufacturers by finding greater efficiencies in the value net.
To achieve these value net efficiencies, QR focused on shortening the lead-time, the time between when a retailers placed an order and the final delivery to the store. Most orders
were for new products because each season (e.g. spring, winter, etc) the fashions would change and new products were introduced to keep up with the changing fashions. Historically, it had taken almost a year to get new products from concept to market (Hammond, 1992).
Because of these long lead times and uncertainty of demand for the fashions in each season, excess inventories accumulated at every node in the value net from raw fiber to the point of the consumer purchase. The costs created by these inefficiencies were passed on to the consumer. In addition the these costs, consumers were often unable to purchase the product they wanted because the forecast created almost a year previously was not accurate and the lead-time in the value net made it almost impossible to adjust within the same season. This slow response also created the opposite effect, overstocks, or too much product at the end of a season. In this case, members of the value net were forced to mark down, or lower the price. Often this was still not sufficient and the product was liquidated, usually at or below cost.
2.2.2 QR Results
At a QR conference in early 1997, the results of a Kurt Salmon Associates (KSA) survey were shared. The survey included CEO's and Presidents of 54 companies with a total of over $270B in sales (Musselman, 1997). The survey showed substantial increases in service and large decreases in cost. Retailers that adopted QR reported a 60% decrease in stockouts and cut their product lead times by half (Rubenstein, 1997). Based on the survey of the 54 companies, the total estimated annual savings in the apparel industry resulting from changes initiated by the QR movement begun in 1985 have been 42B U.S.
dollars. This level of savings has been achieved without any significant collaboration.
There is another $60B of annual savings that is projected to still be available (McInerney, 1998). This savings requires VNC. To arrive at this breakdown, the study showed that there are three categories of companies that have adopted QR (Musselman, 1997):
e STAGE I - Basic Communication Technology - These companies reacted to the changes driven by QR with minimum response. They have done the basics of implementing core data capture and communications technologies. They have not utilized the technology to make any changes in their business. Companies that have done these basics have saved $15B annually versus their 1985 base levels.
" STAGE II - New Technology and Process Orientation - These companies took an
active role in making changes to move toward QR. They have adopted the communication technologies and made organizational and process changes to smooth the flow of information and product in the value net. They have leveraged the new technologies to redesign internal processes and have added new practices like: short cycle manufacturing, floor ready merchandise, and automatic replenishment. All of their improvements have been inside the company. Companies in this stage have achieved savings of $27B annually versus their 1985 base levels. The majority of companies are at this stage. Even after companies have utilized the communication technologies and have made internal process changes to make themselves more effective and efficient, inventory in the value net remains at its historically high
levels.
" STAGE III -VNC Companies - These companies have excelled at implementing the
technology with internal organizational and process changes and are now working on VNC. There are very few companies in this stage. When companies get to this stage there is an estimated $60B of additional annual savings versus their 1985 base levels.
Based on this survey, the majority of the benefits (-60%) are still unrealized. Most of the remaining savings that have been identified require that companies collaborate with their partners in the value net to change long established business practices in order to eliminate the inefficiencies and achieve the savings.
2.3 Stages of Value Chain Integration
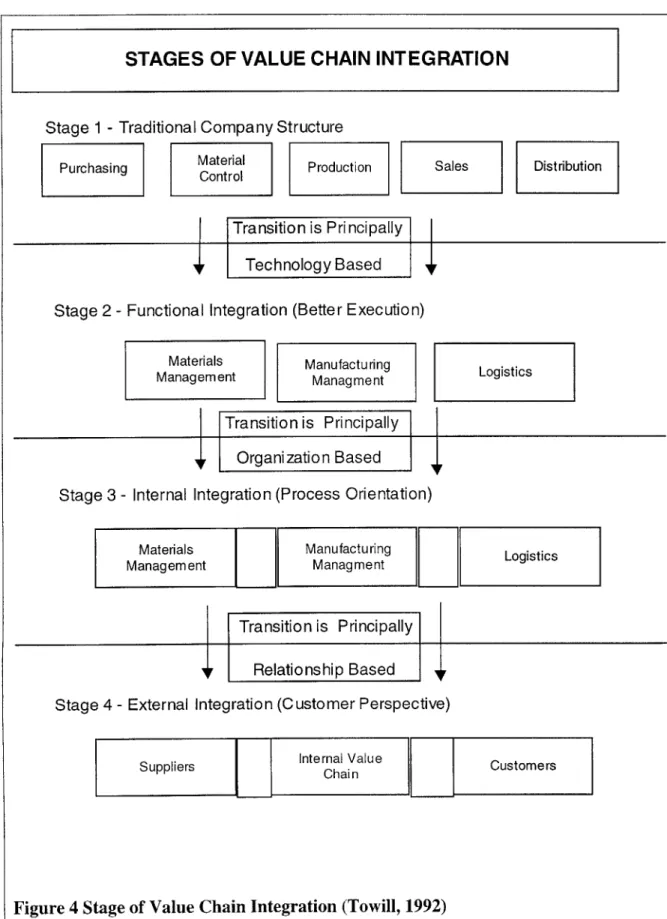
The QR approach to segmenting progress in value chain integration is not unique to the apparel industry. Towill (1992) and Hewitt (1994) have developed a similar stage-based integration structure for all companies. The traditional company structure of individual, locally optimized tasks is the first stage of value chain integration and a single integrated process that encompasses the whole value chain from raw materials to the end consumer defines the final stage. Although the stages of integration are pictured as sequential, there is overlap across the stages. Companies that are still working in stage II may be starting pilot initiatives in stage III. However, the basics of one stage normally need to be in place before companies can successfully execute the next stage. Figure 4 shows the stages and each stage is described below.
2.3.1 Stage I -Traditional Task Orientation (Baseline)
The traditional company structure reaches back to Adam Smith's division of labor principle for its heritage. The Industrial Revolution was based in part on major productivity increases when different parts of production were broken out into separate tasks. Although there have been many improvements on this basic theme, like Henry Ford's production line, where the movement of the product from one task to another was automated, the fundamental concept of dividing work into tasks and optimizing each task remains the foundation for most business organizations. This approach to business has molded organizational structures to look like a series of "stovepipes". Each task area becomes highly specialized and focuses exclusively on their task. Trust and cooperation
are not attributes necessary for success in these organizations.
For example, most companies have departments such as: finance, human resources, manufacturing/operations, distribution, transportation, marketing, etc. Each one of these
STAGES OF VALUE CHAIN INTEGRATION
Stage 1 - Traditional Company Structure
Purchasing Material Production Sales Distribution Control
Transitio n is Pri ncipally ITechnology Based,,
Stage 2 - Functional Integration (Better Execution)
Materials Manufacturing .
Management Managment Logistics
Transitio n is Principally ,Organi zatio n Based
V
Stage 3 - Internal Integration (Process Orientation)
Materials Manufacturing Logistics Management Managment
FTransitio n is Principally V Relationship Base
Stage 4 - External Integration (Customer Perspective)
Suppliers Internal Value Customers Chai n
areas is organized to handle particular tasks and works to optimize its area to perform its task with quality and efficiency. This organizational structure implicitly assumes that the result of each task performed optimally will produce an overall optimal output. Over time, this task orientation has led to the optimization of each task without a complete understanding of the implications on the other parts of the company. In many cases, what appears to be the best action for a task area may end up costing the company more money as a whole than it saves, or it may lower service to the customer.
One result of this company structure is that each area has its own way to optimize its tasks. For example, manufacturing will tend toward long production runs because changeovers are costly. Distribution will tend to batch orders to maximize its workforce productivity. Transportation will tend to wait for full truckloads because it is the lowest cost mode of transport.
These different task optimizations cause gaps in the flow of products through the different areas of the company. These gaps are buffered with inventory to allow the company to operate effectively. Long manufacturing runs cause products to be held in inventory to support customer needs while it is not being manufactured. Batching of orders in distribution causes inventory to sit in the warehouse waiting until it is picked. Aggregating full trucks causes inventory to accumulate until the threshold is reached and the product is shipped.
It is inventory, both inside the company and between companies in the value net, that is used to buffer the value net from the consequences of its own structure. It is inventory that gives different functions within the company and different companies the time they need to react to unanticipated changes around them. Inventory fluctuates constantly because too much inventory increases costs and not enough inventory causes lost sales.
2.3.2 Stage II - Functional Integration (Better Execution)
The movement of a company from STAGE I to STAGE II usually happens because of improvements in technology (Towill 1992). Companies begin to integrate functions more closely using information systems. Companies improve their efficiency and achieve some level of integration between functional areas by "paving the cow path", using computers and electronic communication to do more accurately and quickly what people have done in the past.
These improvements in communication technologies allow companies to execute better within the same task oriented processes. The effects can be seen both inside and outside the company. QR is a good example. One of the first barriers to the implementation of QR was the lack of communication technology. Sharing information in a common form to eliminate the translation between tasks inside the company and across companies is one of the most important aspects of QR. Therefore, QR required standardization of two fundamental technologies to enable this communication: Universal Product Codes
(UPC's) and Electronic Data Interchange (EDI).
UPC's ensure that all products and their components can be identified easily by all companies in the value net. It is the equivalent of a single dictionary with one meaning per word. Everyone in the value net can reference the dictionary and always get the same meaning as everyone else. Before QR, many products did not have UPC's and there was confusion about what each product was. The green shirt to one company was a turquoise blouse to another. Without the UPC, identifying items across companies and even within companies was difficult. UPC's allow computer to computer communication with the precision necessary to ensure that what one company orders is the same item that the
other company plans to ship.
If UPC's are the words precisely defined by a common dictionary, EDI is the book of common grammar that allows sentences to make sense. Although EDI has been around since the early 1970's, the North American standard of ANSI X.12 did not become
established until the early 1980's (Jilovec, 1997). EDI is one of the building blocks for the QR and it did not really take hold until mid 1980's. Still today at the end of the 1990's, EDI is not universal. Many small business cannot afford the startup or transaction costs of EDI. Although most large companies use it and a large portion of transactions go through it, the majority of companies do not use EDI (Jilovec, 1997).
Information sharing between companies became possible and practical when both UPC and EDI standards were implemented. With these standards in place, companies are able to share information, with minimal human intervention, and thereby eliminate value net inefficiencies. The most common example of this improved efficiency is the electronic purchase order generated by a retailer's computer system that travels via EDI to the manufacturer's computer system. Because the clerk does not have to re-key the purchase order, human typing errors are eliminated as well as the cost of the clerk.
2.3.3 Stage Ill - Internal Integration (Process Orientation)
The transition to STAGE III usually comes from organizational changes within the company. Companies leverage the technology from STAGE II and begin to make organizational changes to support a process-orientation rather than the traditional task orientation. Processes are redesigned to reflect the new structure and allow information to flow more efficiently. Many of the inventory buffers that had existed between functions are eliminated because of the tight coordination across processes. With its own house in order, companies begin to look at other members of the value net to begin searching for ways to improve. Improvements at this stage are often called "Reengineering" as described by Hammer (1993).
2.3.4 Stage IV - External Integration (Relationships)
STAGE IV is achieved by extending the scope of integration outside of the bounds of the company to include both suppliers and customers. There are various relationship strategies that can be used in this stage. The following section examines the range of possible relationship strategies for companies to use as they extend beyond their
2.4 Types of relationships
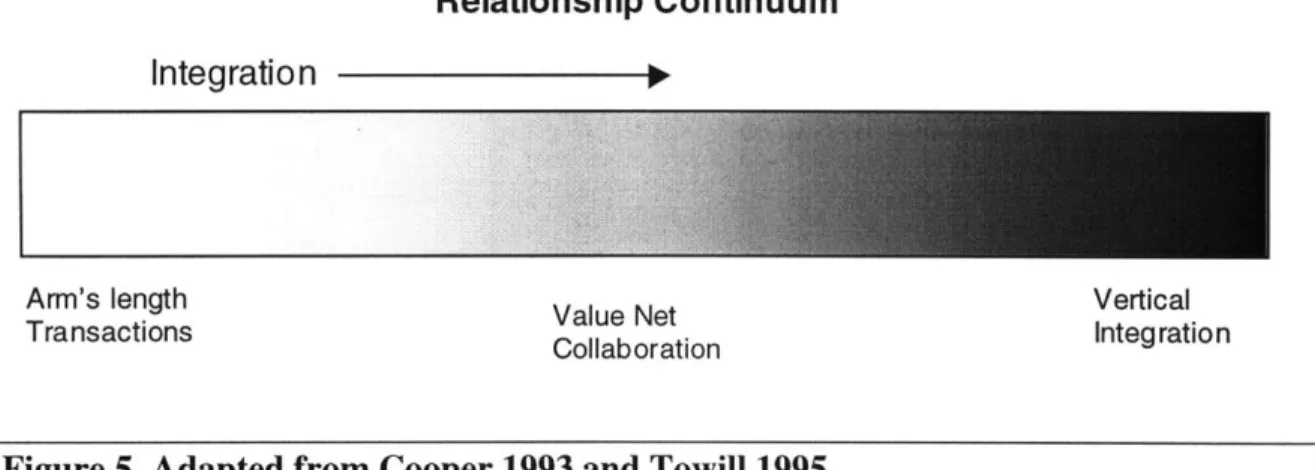
The way a company migrates to STAGE IV in the value net integration model depends on the type of relationship between the companies. Figure 5 shows the range of relationship types: from the traditional "arms-length" transaction all the way to vertical integration.
The two ends of this spectrum on relationships are taken from Coase (1937). He investigated the nature of the firm to identify when organizations would perform functions inside the firm (vertical integration) and when they would go to the marketplace (arm's length transactions) to source those functions.
Relationship Continuum
Integration
s
Arm's length Value Net Vertical
Transactions Collaboration Integration
Figure 5 Adapted from Cooper 1993 and Towill 1995
2.4.1 Traditional Arm's Length Transaction
In the U.S., the value net exists in a capitalistic, free market environment that is based on the principles of competition and market equilibrium. The economic engine of capitalism runs on transactions, the buying and selling of products and services. In principle, each company buys a product from the other based on the economics of that transaction. The emergent impact of all of these independent transactions is the market equilibrium that sets the price and balances supply of and demand for a given product.
For every transaction between nodes in the value net, each company tries to get the best deal -- a customer tries to buy from a supplier at the lowest price and the supplier tries to sell at the highest price. A set amount of profit is available in each transaction and the two players split that profit based on their ability to negotiate the price, terms and conditions of the sale. This competitive transaction to split a fixed pie of profits is a win-lose transaction (for one company to win the other must win-lose since the total profit remains the same). Given this environment, where buying and selling are competitive events, most companies look at all other companies as competitors of some nature, even companies in the same value net serving the same end consumer.
One of the results of this environment is that companies in the value net do not trust each other. Therefore, they do not share much information with each other unless it is to improve their bargaining position for the next transaction. This lack of information causes companies to carry inventory to protect themselves against unforeseen changes in supply or demand. This inventory provides a buffer to give them the ability to react to changes in the value net for which they have little to no visibility. Each node of the value net maintains this protection. The amount of inventory in the value net is an indicator of the level of trust and visibility between the companies involved.
Inventory is therefore, a structural element in the traditional value net. Brilliant execution may minimize inventory within the confines of this design, but the design itself limits the range on these improvements. Trying to push the edge of these design limits can have unpleasant side effects, specifically, stockouts. Many companies oscillate
around this limit, cycling back and forth between too much inventory and stockouts.
2.4.2 Value Net Collaboration
VNC is a strategy that can be used to achieve value net integration. It is most likely to be used in the middle of the continuum to achieve strategic alliances, joint ventures, and other similar types of relationships. Before going further, it is necessary to clearly define
Collaboration is defined (Webster 1977) as 1) working jointly with others especially in an intellectual endeavor and 2) cooperation with or willing assistance of an enemy of one's country especially an occupying force. From this definition, it is clear that the connotation of collaboration can be either positive or negative.
Academic collaboration is an example of the first denotation. This type of positive collaboration works because there are established patterns and norms on how to work together. There is trust that the other members of the collaboration will respect these rules and norms. Within this framework, the participants share their ideas with the expectation that the results will be better than what each of them could produce by themselves. Successful collaboration requires a trusting, information sharing environment. Collaboration is based on the concept that "1+1>2": working together creates more than the sum of working separately.
Someone who aids the enemy is engaged in an example of the second denotation, this type of negative collaboration means betrayal. One of the players engaged in this activity is considered a traitor and the other is the enemy. In this example, both parties still work together to achieve a result that could not be achieve individually just the same as the first denotation. However, trust is missing in this denotation and the risk of failure in this case is high and the penalty is usually extreme.
Collaboration in the value net carries with it both of these meanings. From industry studies like QR and ECR, Stage IV integration does produce benefits that cannot be achieved by companies working on their own. On the other hand, Stage IV requires companies to move beyond the transaction-based relationships and further on the continuum to achieve the benefits of integration. (For companies to achieve stage IV integration via acquisition would result in vertical integration, at the far end of the continuum.) The risk of failure is high. Companies who share sensitive information in a failed attempt to collaborate may well see the information they shared used against them in the next competitive transaction, or used to acquire or bypass them.
Value net collaboration (VNC) is therefore defined as a strategy to achieve the cooperative, long-term relationship between two or more companies in the same value net to increase their mutual profit and/or improve service to the consumer. VNC is a relationship strategy used to achieve STAGE IV integration and its accompanying benefits.
Because VNC affects the relationship between two companies, it is a difficult to accomplish. In fact, there are very few businesses that have been able to make this change. This can be seen in the results of QR. Ten years after the concept was introduced to the apparel industry and the benefits were acknowledged, very few companies are engaged in any form of collaboration (KSA, 1995). Most interactions between companies are still transaction-based and conform to the norm of competitive
capitalism.
2.4.3 Vertical Integration and Disintermediation
Vertical integration and disintermediation both eliminate nodes in the value net. Vertical integration is the elimination of a node in the value net where the boundaries of the firm are extended along the value net to include another function and disintermediation is when there is no longer a need for that particular function. Coase (1937) suggested that a firm could expand in either of two ways: by combination, when it absorbed another firm executing the same transactions (horizontal integration), or by integration, when it absorbed a firm executing a different transaction (vertical integration). In addition, a firm could expand by eliminating the need for a function (disintermediation). Coase (1937) points out likely conditions for the firm to expand its boundaries:
" The lower the costs of organizing and the slower these costs rise with an increase in the transactions organized.
* The greater the lowering (or the less the rise) in the supply price of factors of production to firms of large size
With the exception of the last point (production economies of scale), the other two conditions under which firms expand appear to be the management ability of the entrepreneur.
Technology that increases the management ability of the entrepreneur faster than it reduces the transaction costs in the market will tend to increase the size of the firm (Coase 1937). It is not yet clear whether the new telecommunication technology, like the Internet, will improve management ability of the entrepreneur and increase the size of the firm, or will reduce transaction costs and shrink the size of the firm.
Because vertical integration, or disintermediation, once it is completed, looks just like the traditional arm's length transaction relationship, it is often not recognized for what it is. Two examples will help make the point.
STAPLES, an office supply company, has been extremely successful by eliminating one whole layer of nodes in the value net of office supplies. In this example, technology, like scanning the product sold at point of sale, has allowed the entrepreneur to increase the size of the firm. STAPLES has effectively replaced 1,000-3,000 small local office supply retailers and manages the flows of information and product directly from manufacturers eliminating the wholesaler node that was required by the small local office supply stores.
DELL, a computer manufacturing company, has achieved success in large part due to the elimination of the retail nodes in the computer value net. DELL has used technology, like customer databases and the Internet, to develop a direct relationship with its customers. Dell manages the flows of information and product directly from its customers, bypassing the need for the retailer and wholesaler nodes in the value net.
The elimination of nodes in the value net either by strategies of disintermediation or vertical integration allow companies to achieve STAGE IV. With these strategies, the relationships between the company and its adjacent companies are the same competitive relationships that are present in the traditional economic environment, namely market equilibrium via arm's length transactions.
VNC is a strategy to achieve STAGE IV integration that uses a cooperative type of relationship. This cooperative relationship is not part of the traditional economic environment; therefore, fewer companies have experience successfully engaging in this new type of relationship. Additionally, companies have to maintain this collaborative relationship along with all of their other competitive relationships. This forces companies to maintain two different strategies simultaneously.
2.5 VNC in Current Literature
Lapide (1998) and Benchmarking (1998) have looked at VNC from two different perspectives: Lapide from a technology view and Benchmarking from a process view.
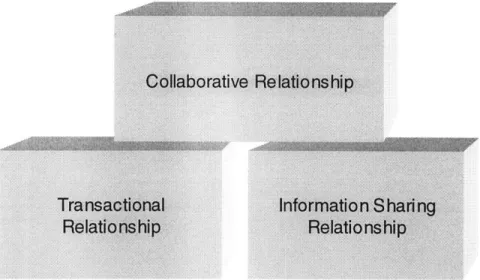
Lapide (1998) approaches collaboration from a technological point of view and describes VNC as a form of electronic commerce. The three types of electronic commerce are: " Transactional -electronic execution of transactions
* Information sharing -electronic sharing or exchange of information
* Collaborative - electronic collaboration on strategic, tactical, and operational planning
Figure 6 AMR Collaboration Building Blocks
The transactional relationship in e-commerce automates the communications around the buy/sell transaction. This level has typically focused on using EDI to send purchase orders, invoices, and transfer funds. The information sharing relationship has expanded the amount of information that is exchanged electronically beyond the simple buy/sell transaction to include things like order status, product prices, descriptions, and availability. Finally, there are collaborative relationships where more information is exchanged and used to jointly develop plans. According to Lapide, transactional and information sharing relationships are expected to be the building blocks upon which collaborative relationships are built (see figure 6).
While this view of electronic collaboration may be accurate from a technology stand point, it does not address the process (STAGE III) changes and it does not address the strategic issues that are necessary for a transition to STAGE IV. Collaboration is only one possible strategy that can be employed to achieve STAGE IV. Communication technology may be necessary for electronic collaboration, but it is not sufficient.
Another way to view this technology perspective is that the communication technology has to improve before it can support the real time needs of a collaborative relationship. EDI is a batch-based communication technology that is expensive to use for large amounts of data. Collaborative relationships need real-time exchange of data so that decision can be made jointly with the same information. Internet-based communications that will allow the real time exchanges of large volumes of information are necessary for collaboration on a large scale to be feasible.
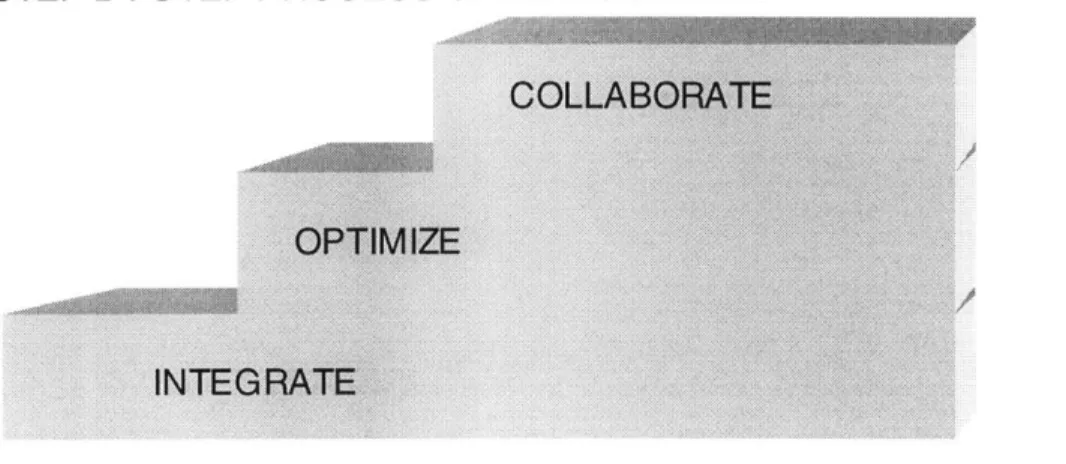
Benchmarking (1998) advocates a process view of collaboration that is "integrate, optimize and collaborate". Each step builds on the one before. Integrate the business functions within the company, optimize the process as broadly as possible within the company and collaborate with other companies.
STEP BYSTEP PROCESS OF IMPROVEMENT
Figure 7 Benchmarking Partners' Process View of Collaboration
This view of collaboration implies that if a company can create a new organization and a process orientation within the company (STAGE III), it can take the same tools and keep
to complete STAGE III, the relationship strategy that a company uses to achieve value net integration across company boundaries may or may not be VNC. Vertical integration or disintermediation may be equally valid strategies; therefore, this step by step process view is a misleading concept.
VNC is not a continuous next step from the transaction-based environment that dominates most value nets. It cannot be added on top of the existing base of competitive, "win-lose" principles that govern most existing relationships. VNC only works if the companies (at least two) in the value net change their strategic perspective from a transaction based win-lose perspective to a longer-term collaborative win-win relationship.
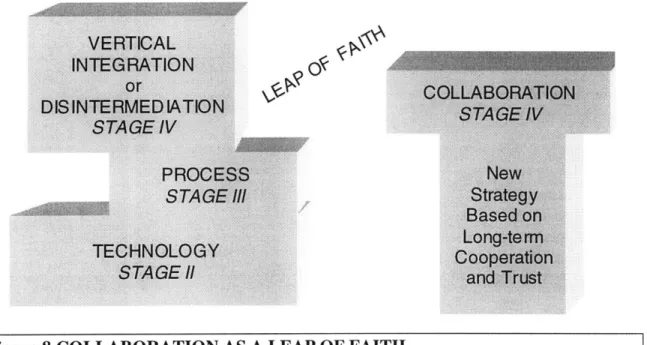
A more accurate picture of collaboration relative to process integration/optimization (STAGE III) and technology improvements in transactions/information sharing (STAGE II)) can be seen in figure 8. Making progress on these other initiatives gives a company a better foundation, but a strategy to integrate the value net and achieve STAGE IV could either be vertical integration, disintermediation or VNC.
If VNC is the strategy chosen, a jump is required to reach the new structure/design of the collaborative relationship. Without a full commitment to the new strategy by all the companies involved, a company may fall short of collaboration and end up worse off than it was before. The company could be worse off in the traditional arm's length transaction relationship if the information they shared was used against them in the next transaction or they might find themselves absorbed or eliminated by vertical integration because of the knowledge transferred during the failed collaboration attempt. Another risk of VNC is that one of the companies in the relationship could be purchased and leave the relationship. For example, the purchase of Ingram Books, a book distributor, by Barnes & Noble, a book retailer, has left Amazon.com, a competitor of Barnes & Noble, in a difficult position now that they can no longer trust that Ingram will continue in a collaborative relationship.
VERTICAL INTEGRATION or 69COLLABORATION DISINTERMEDIATION STAGE
I
STAGE IV PROCESS NewSTAGE /MI Strategy
Based on TECHNOLOGY STECNOO CooperationLong-term
ST AGE II and Trust
Figure 8 COLLABORATION AS A LEAP OF FAITH
2.6 Conclusion
VNC is one strategy that companies can use to transition from a STAGE III company to a STAGE IV company in their ongoing process of achieving further integration in the
value net. VNC requires a longer-term, cooperative, trusting relationship between companies, not the type of relationship that is typically found in the economy today. Vertical integration and disintermediation are other effective strategies to achieve STAGE IV efficiency using the existing arms-length transaction based on the competitive relationships that are typical in the economy.
All of these relationship strategies require the enabling technologies and processes of STAGE II and STAGE III to be effective. Therefore, when assessing VNC in the marketplace, one should examine the supporting technology, process and most
not be effective. For example, the technology for collaboration may be in place and the processes changed, but if the relationship strategy is not agreed upon between the two companies, VNC will fail. Failed collaboration relationships carry with them the risk of a company being worse off than they were before the attempted collaboration.
There are, however, factors in the marketplace today that make risk/benefit trade off of VNC, if not appealing, at least acceptable. Ironically, competition is a primary driver of collaboration. When companies run out of conventional improvements and they are still unable to compete, they are beginning to consider collaboration.
What is missing, however, is exactly why VNC, vertical integration, or disintermediation improves value net performance. Chapter 3 looks at this issue.
3 The Problem Defined
The problem of value net inefficiency was described by Forrester (1961) and further by Sterman (1989), and Towill (1992, 1995). They all bring a system dynamics view with an empirical modeling approach to the problem. Lee (1997a, 1997b) brings a traditional microeconomic view with an analytic approach. This chapter incorporates both the microeconomic and the system dynamics views into a framework equivalent to the four stages of value chain integration developed in the last chapter. The distinction between the design of a value net and the management within this design is introduced into this framework.
3.1 Traditional Inventory Management
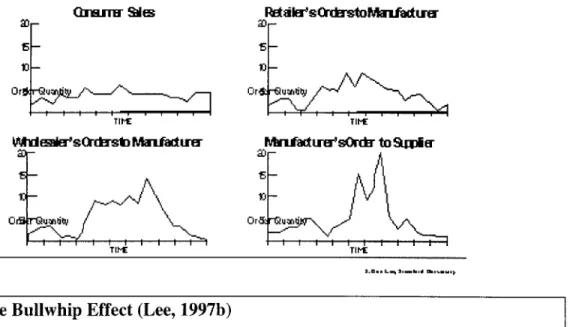
Lee approaches the issues of value net inefficiencies from a traditional inventory optimization framework. He creates simple models that capture the structure of the value chain and the optimizing, rational behavior of the management policies. Lee uses these models to examine the problem he calls the "Bullwhip Effect", when "orders to the supplier tend to have larger variance than sales to the buyer (i.e. demand distortion) and the distortion propagates upstream in an amplified form (i.e. variance amplification)." This information distortion in the value chain produces the behavior seen in figure 9.
Increasing Variability of Orders Drives
Inventory in the Supply Chain
oImr sWes MIdQikrrtD MnfadUW
Or Or*-r- UziItb)
TIE TIE
kMMrfadum sOrdr toD iJE
0 Or ULM 2L)
Figure 9 The Bullwhip Effect (Lee, 1997b)
Lee (1997b) contends that there are four basic causes of the bullwhip effect
1. Demand Forecast Updating - When a company's forecast is based upon the
down stream company's order history.
2. Order Batching - When companies aggregate demand to create an order to meet economic or system requirements.
3. Price Fluctuations - When prices change due to either promotional or market driven activity
4. Rationing and Shortage Gaming - When demand exceeds supply, the way in which companies order and allocate limited resources.
3.1.1 Demand Forecast Updating
Each place in the value net that uses forecasts to plan their business, by its very nature, increases the variations in future forecasts. Lee proves that a rational player trying to optimize his situation will always increase the variation of the forecast based on the input demand. Therefore, the fluctuation in the demand patterns will increase as a function of the number of separate forecast points in the value net. This does not mean just one
forecast per company. In many instances each company will have multiple forecasts that cascade up the value net. Using the optimizing behavior of a rational player, Lee shows that the volatility of the demand will always increase as a function of the number of independent forecasts in the value net.
Also in this proof, Lee shows that lead-time is also positively correlated with variance in demand. He proves that the longer the lead time the higher the variance. The result of both of these effects is that demand variance will become amplified as the demand is communicated back up the value net away from the final consumer.
3.1.2 Order Batching
The use of order batching, aggregating continuous demand into periodic orders, also adds to the bullwhip effect. Lee shows that through the full range of possible batching (e.g. balanced ordering, random ordering and positively correlated ordering) all batching causes an increase in order variance. Order batching is a product of optimizing the cost of ordering. It traditionally trades off the transportation, ordering, and holding costs to arrive at an optimal order/batch quantity. Most commercial procurement systems have some form of this optimization built into their systems.
3.1.3 Price Fluctuations
When presented with price fluctuations (e.g. price changes, temporary discounts, etc.) a rational player will try to optimize his buying behavior and buy more than his immediate needs when the price is low and buy only enough to meet his minimum demand when the price is high. Lee proves that this behavior will always cause higher order variation than the optimal ordering patterns when prices are constant. Since temporary price discounting or commodity price fluctuations are common in most all value nets, this effect is seen in most industries.
3.1.4 Rationing and Shortage Gaming
player will always order more then they would have in a non-constrained supply situation and that the amount they order is proportional to the demand.
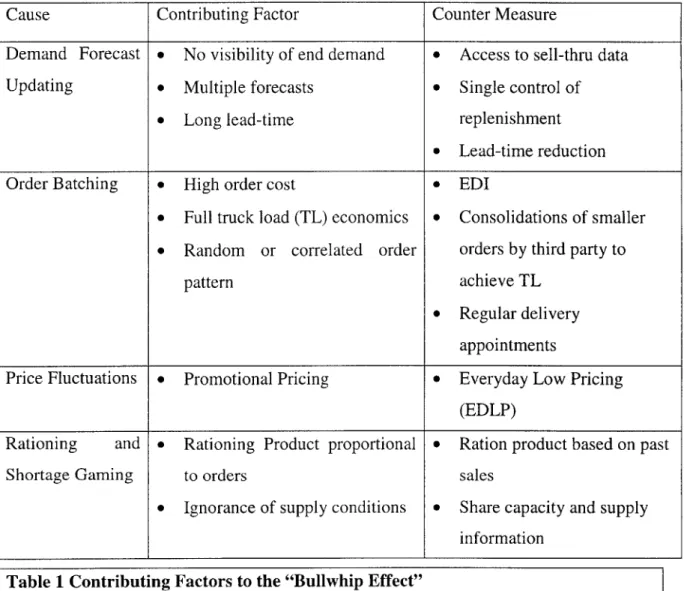
3.1.5 Contributing Factors and Counter measures
Lee points out some contributing factors and counter measures to mitigate the four causes of the Bullwhip effect. These are summarized in the table 1.
Cause Contributing Factor Counter Measure
Demand Forecast 9 No visibility of end demand e Access to sell-thru data Updating 0 Multiple forecasts * Single control of
0 Long lead-time replenishment
0 Lead-time reduction Order Batching 9 High order cost * EDI
e Full truck load (TL) economics e Consolidations of smaller 0 Random or correlated order orders by third party to
pattern achieve TL
* Regular delivery appointments
Price Fluctuations 9 Promotional Pricing e Everyday Low Pricing (EDLP)
Rationing and * Rationing Product proportional e Ration product based on past Shortage Gaming to orders sales
e Ignorance of supply conditions e Share capacity and supply information
Table 1 Contributing Factors to the "Bullwhip Effect"
3.1.6 Limitation of this Approach
Because Lee addresses each of the four drivers of the Bull whip effect in isolation, the relative value of these issues is not evaluated in Lee's work. This is important because
just knowing that a variable is positively correlated with an effect does not indicate the strength of that variable relative to the other variables. This in turn makes is difficult to know where to apply limited resources (e.g. Should a company focus on reducing lead-times, eliminating independent forecasting points, reducing order batching, eliminating price fluctuations, or developing better methods for constrained supply situations.)
3.2 Systems Dynamics - Forrester
Forrester (1961) examines value net inefficiencies and uses a technique called "system dynamics" to understand its causes. Forrester's approach is fundamentally different from the microeconomic optimization approach of Lee. Rather than build a series of simple models that can then be solved analytically for an optimal solution, Forrester uses a computer model to simulate the whole system and runs a series of experiments to observe its behavior. The conclusions are based on the empirical results of the model over a large number of experiments.
Forrester (1961) defines industrial dynamics, a specific application of system dynamics, as "the study of information feedback characteristics of industrial activity to show how organizational structure, amplification (in policies), and time delays (in decisions and actions) interact to influence the success of the enterprise." "It treats the interaction between flows of information, money, orders, materials, personnel, and capital equipment in a company, an industry, or a national economy."
To build a model, Forrester defines a typical value chain organizational structure: manufacturer, distributor, and retailer. He defines a policy for ordering and builds in the time delays for decisions and actions. With this information, he creates a system of seventy-three equations that represent flows of information, money, and product.
Using this model, Forrester (1961) shows that a 10% change in consumer demand has an amplified effect on inventory going back up the value chain toward the manufacturer as seen in table 2. Lee (1997a) shows a similar amplification in the variance of purchase
Location Maximum (%) Minimum (%) Consumer Demand +10 -0
Retail Inventory +12 -12 Distributor Inventory +32 -33 Manufacturer Inventory +62 -45
Table 2 Forrester's Results
Forrester (1961) explains that the reason for this amplification is that each level of the value chain responds to its new inputs by creating orders that reflect both their new forecast of future sales and their new levels of inventory needed to support the new sales. This one time change in inventory at each level, in addition to the increased forecast, is what causes the amplification of orders and causes a corresponding amplification in the variation of inventory levels.
To mitigate this fluctuation in inventory levels, Forrester experiments with three possible solutions: 1) Reduce the lead-time, 2) Change the ordering/inventory policy, 3) Change the structure of the value chain by eliminating the distributor level. Because this is an integrated model of the whole system, the relative value of these changes can be evaluated as they are in table 3.
Changed Variable Resulting Reduction in Peak of Manufacturer Oscillation Time: Reduce lead-time by 67% -12%
Policy: Change forecast history from 4 to 8 weeks -24% Structure: Remove the distributor from value chain -42%
3.2.1 Reduce Lead-Time
When the lead-time in the model is reduced from three weeks to one week, the resulting effect on the manufacturer is 12% reduction in the amplitude of the oscillation of orders to the factory. In this experiment, only time was changed, policies and structure were not. This corresponds to STAGE II in the value chain integration model where technology is used to speed up the existing policies and structure.
3.2.2 Change in Inventory Policy
Changing the policies for ordering and maintaining inventory also has a substantial impact on the bullwhip effect. In his model, Forrester (1961) varied the exponential smoothing rate used to build the forecast and create orders from 4 weeks of trailing sales to 8 weeks of trailing sales. This change in the ordering policy had the effect of dampening the oscillations and reducing the variation of manufacturing orders by 24% versus the base line model. This corresponds to STAGE III in the value chain integration model because this change in management policies reflects a broader process orientation rather than the traditional task optimizing response to the change in demand.
3.2.3 Remove One layer from the Value Chain
The benefits of removing one layer from the value chain, a 42% reduction in the variation of manufacturing orders versus the baseline, are greater than the benefits of reducing time and changing order policy. By removing a layer in the value chain, both the inventory at that layer and the distortion of information (e.g. orders based on an independent forecast) are eliminated. With one less point of amplification, the overall volatility of the value chain is reduced. The other benefits of eliminating a layer are fewer opportunities for miscommunications/mistakes and shorter time between consumption and fulfillment in the total value chain. This experiment, where the design of the value chain is modified, corresponds to STAGE IV in the value chain integration model.
3.2.4 Variable Inputs to the Model
Forrester (1961) uses three different types of inputs to demonstrate industrial dynamics: a single 10% step increase, a sinusoidal 10% increase and decrease with a period of 1 year, and random noise of +/-10% with a constant demand pattern. The single step increase shows the basic nature of the system dynamics response. This change is amplified up the value net and results in a (+45%, -3%) change in the factory output. When the input shows more variation as with the sinusoidal change in input, the oscillations become even larger and grow to (+72%, -61%). With flat demand and random noise added, the oscillations become (+25%, -22%).
From these experiments with different inputs, it can be seen that the value chain is extremely sensitive to changes in demand. Even with no change to underlying demand, the system amplifies the noise of normal fluctuations and players further up the value chain could easily perceive this flat demand as seasonal or periodic demand.
3.3 System Dynamics - Sterman
Sterman (1985) uses a physical simulation game called "The Beer Game". This simulation allows people to play different roles in the value net and respond to consumer demand. The various positions are retailer, distributor, wholesaler, and manufacturer. Based on his research with this simulation game, Sterman concludes that managers' perceptions of the "bullwhip effect" are as follows,
"When asked how they could improve their performance, many call for better forecast of customer demand. The erroneous open-looped attribution of dynamics to exogenous events thus draws subjects' efforts to learn away from the high leverage points in the system (the stock management policy) and towards efforts to anticipate and react to external shocks. While better forecasts are likely to help, the key to improved performance lies within the policy that individuals use to manage the system and not in the
external environment. Even a perfect forecast will not prevent a manager who ignores the supply chain from over ordering" (Sterman, 1989).
This conclusion by Sterman is consistent with what is seen in industry. There has been a concerted effort made to minimize the variance in forecasts and to understand the external shocks to the system. While on the other hand the management policies, batch sizes, forecasting algorithms, inventory policy and the structure of the value net itself have been left alone.
In 1994, McKinsey & Company developed a system dynamics model for the Compaq Corporation value net. The results of this work showed that the highest leverage points in the value net were reductions in lead-time (Sterman, 1998). Improving forecast accuracy had only an average impact. Removing a layer from the value net was not considered as part of this work.
Opportunities to Improve Improvement (% of Base) Performance
Materials Lead Time 45%
Order to Receipt Time 30% Rapid Planning Cycle Time 30% Demand Forecast Accuracy 25%
Launch Date Forecast Accuracy 25%
Eliminate Month-End Shipping Spike 15%
Table 4 Sterman's Results
Although improving the forecast is important and will provide benefits, it is not a leverage point in the system and will not provide the return for the effort placed on it.
3.4 System Dynamics - Towill
Using a simplified version of the basic Forrester model as a baseline, Towill (1992) isolated two fundamental causes of value net inefficiency. These are oscillations due to business policies and their time delayed feedback (the time between the policy decisions and when management observes the results), and amplification generated at each layer in the value chain.
In his simplification of the original Forrester model, Towill eliminated many of the feedback loops within the model. This simplification allowed Towill to isolate the amplification effects at each layer. Towill showed that the value net model amplified variance at each layer where an independent forecast of demand was used to generate orders. He estimated that for "n" value chain layers, the demand amplification upstream is approximately RC"1 where R is the ratio of output orders versus input demand at each layer. Towill (1992) references empirical studies that generate an average value of R=2 over a broad sample of actual value chains.
Using this average value, a five echelon value net (e.g. retailer, wholesaler, distributor, manufacturer, supplier) would exhibit a variance ratio of 24:1 or 16:1 suppliers factory orders to initial consumer demand. Burbridge (1987) also identified this amplification between layers when he observed "if demand for products is transmitted along a series of inventories using stock control ordering, then the demand variation will increase with each transfer." This amplification is the same relationship that Lee (1997a) proved from a microeconomic point of view.
Oscillations due to business policies and delayed feedback are the other major area Towill (1992) isolates as a significant cause of value net inefficiencies. Towill varies both the time and the ordering algorithms to assess the relative impact of the changes. Finally, Towill experiments with simultaneously reduced time and fully integrated policies, the equivalent of VNC, across all three layers.