HAL Id: hal-00338118
https://hal.archives-ouvertes.fr/hal-00338118
Preprint submitted on 11 Nov 2008
HAL is a multi-disciplinary open access
archive for the deposit and dissemination of
sci-entific research documents, whether they are
pub-lished or not. The documents may come from
teaching and research institutions in France or
abroad, or from public or private research centers.
L’archive ouverte pluridisciplinaire HAL, est
destinée au dépôt et à la diffusion de documents
scientifiques de niveau recherche, publiés ou non,
émanant des établissements d’enseignement et de
recherche français ou étrangers, des laboratoires
publics ou privés.
The nearby eclipsing stellar system delta Velorum - I.
Origin of the infrared excess from VISIR and NACO
imaging
Pierre Kervella, Frédéric Thévenin, Monika Petr-Gotzens
To cite this version:
Pierre Kervella, Frédéric Thévenin, Monika Petr-Gotzens. The nearby eclipsing stellar system delta
Velorum - I. Origin of the infrared excess from VISIR and NACO imaging. 2008. �hal-00338118�
November 11, 2008
The nearby eclipsing stellar system
δ
Velorum
I. Origin of the infrared excess from VISIR and NACO imaging
⋆P. Kervella
1, F. Th´evenin
2, and M. G. Petr-Gotzens
31 LESIA, Observatoire de Paris, CNRS UMR 8109, UPMC, Universit´e Paris Diderot, 5 Place Jules Janssen, 92195 Meudon, France
2 Universit´e de Nice-Sophia Antipolis, Lab. Cassiop´ee, UMR 6202, Observatoire de la Cˆote d’Azur, BP 4229, 06304 Nice, France
3 European Southern Observatory, Karl-Schwarzschild-Str. 2, D-85748 Garching, Germany
Received ; Accepted
ABSTRACT
Context.The triple stellar system δ Vel system presents a significant infrared excess, whose origin is still being debated. A large infrared bow shock has been discovered using Spitzer/MIPS observations. Although it appears as a significant contributor to the measured IR excess, the possibility exists that a circumstellar IR excess is present around the stars of the system.
Aims.The objective of the present VISIR and NACO observations is to identify whether one of the stars of the δ Vel system presents a circumstellar photometric excess in the thermal IR domain and to quantify it.
Methods.We observed δ Vel using the imaging modes of the ESO/VLT instruments VISIR (in BURST mode) and NACO to resolve
the A–B system (0.6′′
separation) and obtain the photometry of each star. We also obtained one NACO photometry epoch precisely at the primary (annular) eclipse of δ Vel Aa by Ab.
Results.Our photometric measurements with NACO (2.17 µm), complemented by the existing visible photometry allowed us to reconstruct the spectral energy distribution of the three stars. We then compared the VISIR photometry (8.6–12.8 µm) to the expected photospheric emission from the three stars at the corresponding wavelengths.
Conclusions.We can exclude the presence of a circumstellar thermal infrared excess around δ Vel A or B down to a few percent level. This supports the conclusions of G´asp´ar et al. (2008) that the IR excess of δ Vel has an interstellar origin, although a cold circumstellar disk could still be present. In addition, we derive the spectral types of the three stars Aa, Ab, and B (respectively A2IV, A4V and F8V), and we estimate the age of the system around 400–500 Myr.
Key words.Stars: individual: (HD 74956, δ Vel); Stars: binaries: eclipsing; Methods: observational; Techniques: high angular reso-lution
1. Introduction
The southern star δ Vel (HD 74956, HIP 41913, GJ 321.3, GJ 9278) is the 43rdbrightest star in the visible sky, with m
V = 1.96, and is located at a distance of 24.4 pc (π = 40.90 ± 0.38 mas; ESA 1997). Amazingly, δ Vel was discovered only very recently by Otero et al. (2000) to host the brightest eclipsing binary sys-tem in the southern sky, one of the very few observable with the unaided eye. Its orbital period of 45 days is exceptionally long in terms of probability of occurrence, especially for such a nearby star. A historical note on the discovery and recent de-velopments in the study of δ Vel can be found in Argyle, Alzner & Horch (2002), together with the orbital parameters of the A– B system (orbital period of ≈ 142 years). In the following, we refer to the eclipsing pair as δ Vel A, and to the fainter, visual component as δ Vel B. The two eclipsing components of A are referred to as Aa and Ab, by order of decreasing brightness. Kellerer et al. (2007) excluded the physical association of the angularly nearby pair of stars sometimes labeled δ Vel C and D with the δ Vel A–B system.
Send offprint requests to: P. Kervella
⋆ Based on observations made with ESO telescopes at the La Silla
Paranal Observatory, under ESO programs 0109(B) and 081.D-0109(C).
Correspondence to: Pierre.Kervella@obspm.fr
An infrared (IR) excess associated with the δ Vel A–B sys-tem had been detected by IRAS (1986). This indicated that δ Vel could belong to the ”Vega-like” class of objects, i.e. a main se-quence star surrounded by a optically thin debris disk. However, G´asp´ar et al. (2008) recently discovered a spectacular infrared (IR) bow shock around δ Vel at 24 and 70 µm using Spitzer/MIPS images. This very large structure (≈ 1′) is explained by these
authors as the result of the heating and compression of the in-terstellar medium by the photons from δ Vel, as the trio moves through the interstellar medium (ISM). From a detailed model-ing of the star–ISM interaction, G´asp´ar et al. conclude that the bow shock contribution is sufficient to explain the observed IR excess of δ Vel without resorting to a circumstellar debris disk. They also note that accretion of interstellar material (λ Bootis phenomenon) could nevertheless take place on δ Vel, although at a slow rate.
In this article, we present the results of our search for circum-stellar IR excess in the inner δ Vel A-B system. Sect. 2 is ded-icated to the description of our high angular resolution VISIR and NACO observations, whose analysis is presented in Sect. 3. In Sect. 4, we compute the magnitudes of each of the three stars of the system, that are used to derive their physical parameters. We present in Sect. 5 our estimates of the thermal IR excesses of δVel Aab and B and a short analysis of the evolutionary state of the system.
2 P. Kervella et al.: The eclipsing stellar system δ Velorum - I. VISIR and NACO imaging
2. Observations and data reduction
2.1. VISIR
For the thermal-IR part of our program, we used the VISIR in-strument (Lagage et al. 2004), installed at the Cassegrain focus of the Melipal telescope (UT3) of the ESO/Very Large Telescope (Paranal, Chile). VISIR is a mid-IR imager, that also provides a slit spectrometer. VISIR can in principle reach a very high spa-tial resolving power, thanks to the 8 m diameter of the telescope. However, under standard conditions at Paranal (median seeing of 0.8′′ at 0.5 µm), the 8 m telescope is not diffraction limited
in the MIR (seeing ≈ 0.4′′ vs. 0.3′′ diffraction). A few mov-ing speckles and tip-tilt usually degrade the quality of the image (see e.g. Tokovinin, Sarazin & Smette 2007). To overcome this limitation, a specific mode of the instrument, the BURST mode (Doucet et al. 2007a, 2007b), give the possibility to record sep-arately a large number (several tens of thousand) very short ex-posures (∆t . 50 ms), in order to freeze the turbulence. The data processing procedure we developed to reduce the resulting data cubes is described in Kervella & Domiciano de Souza (2007). During the processing, the frames were precisely co-aligned on the position of δ Vel A.
We observed δ Vel and its three calibrators, HD 82668, HD 67582 and HD 80007 in visitor mode at Paranal during the night of 23-24 April 2008. At that time δ Vel was out of ecplipse. The sequence of the observations is presented in Table 1. We adopted standard chopping and nodding offsets of 8′′, with respective
periods of 4 and 90 s. The calibrators were selected from the Cohen et al. (1999) catalog of spectrophotometric standards for IR wavelengths, except HD 80007 (for the NeII filter). For each observation of δ Vel and its calibrators, we selected during the data processing ≈ 40% of the total number of frames, reject-ing those with the lowest Strehl ratio (estimated from the peak intensity in the frame). For instance, the first two observations #A and B of δ Vel (20 000 selected frames) correspond to a total of 50 000 frames before selection. The number of frames listed in Table 1 corresponds to the result of this selection. The cubes were then averaged to obtain diffraction-limited images in our three filters: PAH1, PAH2, and NeII. that have respective cen-tral wavelengths of λ = 8.59, 11.25 and 12.81 µm. The resulting images of δ Vel and the calibrators are presented in Fig. 1. The observation #C of HD 82668 was affected by saturation of the array, and was not used for our anaysis.
2.2. NACO
We observed δ Vel at ten epochs in April-May 2008 using the Nasmyth Adaptive Optics System (NAOS, Rousset et al. 2003) of the Very Large Telescope (VLT), coupled to the CONICA in-frared camera (Lenzen et al. 1998), abbreviated as NACO. These observations were obtained to provide high-precision differential astrometry of the eclipsing system δ Vel A relative to B, and we will analyze them along this line in a forthcoming article.
We selected the smallest available pixel scale of 13.26 ± 0.03 mas/pix (Masciadri et al. 2003), giving a field of view of 13.6′′×13.6′′. Due to the brightness of δ Vel, we employed a narrow-band filter at a wavelength of 2.166 ± 0.023 µm (here-after abbreviated as 2.17) together with a neutral density filter (labeled “ND2 short”), with a transmission of about 1.5%.
Table 2 gives the list of the observations. Each of our ten epochs consisted in approximately 50 short exposures grouped over less than 10 minutes, with a detector integration time (DIT) of 0.8 s each to avoid saturation. Four such short exposures were
Table 1. Log of the observations of δ Vel and its calibrators, HD
82668, HD 67582 and HD 80007 with VISIR. MJD is the mod-ified Julian date of the middle of the exposures on the target, minus 54 580. The Detector Integration Time (DIT) is given in milliseconds for one BURST image. θ is the seeing in the visi-ble (λ = 0.5 µm) as measured by the observatory DIMM sensor, in arcseconds. N exp. is the number of selected and averaged exposures. The airmass (AM) is the average airmass of the ob-servation.
# MJD∗
Star Filter DIT N exp. θ(′′
) AM A 0.0134 δVel PAH1 20 10 000 0.86 1.18 B 0.0231 δVel PAH1 20 10 000 1.00 1.20 C 0.0374 HD 82668 PAH1 20 5 000 1.10 1.20 D 0.0603 HD 67582 PAH1 16 10 000 0.84 1.30 E 0.0774 δVel PAH1 16 8 000 0.70 1.33 F 0.0874 δVel PAH1 16 8 000 0.67 1.37 G 0.0977 δVel PAH2 8 10 000 0.60 1.42 H 0.1093 δVel PAH2 8 12 000 0.53 1.48 I 0.1206 δVel PAH2 8 10 000 0.80 1.54 J 0.1363 HD 67582 PAH2 8 10 000 1.15 1.92 K 0.1480 HD 67582 PAH2 8 10 000 1.50 2.09 L 0.1632 δVel NeII 16 10 000 1.29 1.91 M 0.1860 HD 80007 NeII 16 10 000 1.12 1.46 N 0.1979 HD 80007 NeII 16 10 000 1.00 1.52
Fig. 1. Top row: VISIR average images of δ Vel in the PAH1 (#A,
B, E and F in Table 1), PAH2 (#G, H, I) and NeII (#L) bands.
Bottom row: Calibrator images in the PAH1 (HD 67582), PAH2
(HD 67582) and NeII (HD 80007) bands.
co-averaged providing 3.2 s integrated exposure time per image. A few images (9 over 510 in total) were affected by the opening of the adaptive optics loop, and were removed from the process-ing. We obtained nine epochs outside of the eclipses, and one precisely at the phase of the primary eclipse (on 18 May 2008), only 23 minutes before the center of the eclipse. As a remark, the
primary eclipse (the deeper in photometry) is when the smaller,
cooler star (Ab) passes in front of the bigger, hotter star (Aa), causing an annular eclipse. The secondary eclipse (shallower in photometry) is when the cooler star is totally eclipsed by the hotter one. The epochs of the primary and secondary eclipses of δVel A are given by the ephemeris of Otero1:
Min I = HJD 2452798.557 + 45.1501 E (1) Min II = HJD 2452818.200 + 45.1501 E (2)
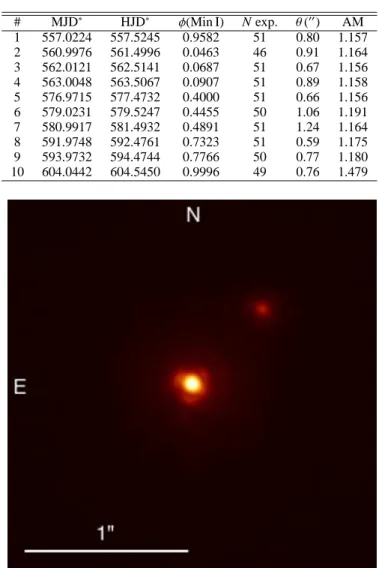
Table 2. Log of the observations of δ Vel with NACO in the
NB2.17 filter. MJD∗ is the average modified Julian date minus 54 000, HJD∗ the heliocentric Julian date minus 2 454 000 and
φis the phase of the eclipsing binary (see text). N is the num-ber of frames. As in Table 1, θ is the seeing in the visible and AM is the airmass. The listed figures are median values over the observations. # MJD∗ HJD∗ φ(Min I) N exp. θ(′′) AM 1 557.0224 557.5245 0.9582 51 0.80 1.157 2 560.9976 561.4996 0.0463 46 0.91 1.164 3 562.0121 562.5141 0.0687 51 0.67 1.156 4 563.0048 563.5067 0.0907 51 0.89 1.158 5 576.9715 577.4732 0.4000 51 0.66 1.156 6 579.0231 579.5247 0.4455 50 1.06 1.191 7 580.9917 581.4932 0.4891 51 1.24 1.164 8 591.9748 592.4761 0.7323 51 0.59 1.175 9 593.9732 594.4744 0.7766 50 0.77 1.180 10 604.0442 604.5450 0.9996 49 0.76 1.479
Fig. 2. Median NACO image of the 51 frames of δ Vel obtained
on 2008-04-01.
With E the number of elapsed orbits. To retrieve the phases listed in Table 2, we converted the modified Julian dates of our ob-servations into heliocentric Julian dates using the tools by Dan Bruton2. The raw images were processed using the Yorick3and IRAF4software packages in a standard way. A sample image of δVel is presented in Fig. 2.
3. Image analysis
3.1. VISIR
We obtained photometry of δ Vel A in the PAH1 and PAH2 bands using a circular aperture of 0.3′′ in radius, centered on
2 http://www.physics.sfasu.edu/astro/javascript/hjd.html
3 http://yorick.sourceforge.net/
4 IRAF is distributed by the NOAO, which are operated by the
Association of Universities for Research in Astronomy, Inc., under co-operative agreement with the National Science Foundation.
Fig. 3. Apertures (circles) used for the VISIR photometry of
δVel A (left) and B (right) shown respectively on the PAH1 im-age #B and the subtracted imim-age #B - #D (see text for details).
the star position (Fig. 3, left). This small radius is intended to avoid the contamination of the photometry of A by component B. For δ Vel B, we first subtracted a scaled version of the cali-brator star at the position of A from the image before measuring the flux through aperture photometry (Fig. 3, right). We thus re-moved the contribution from the diffraction pattern (Airy rings) of δ Vel A at the location of B. This process left almost no resid-ual thanks to the stability of the PSF.
We checked that the VISIR images of δ Vel and its calibra-tors present no detectable diffuse background. This verification was achieved by measuring the average flux at distances larger than 1′′from the central stars, to avoid the inclusion of the
high-order Airy rings. Based on this result, we did not apply a sky subtraction to our observations, and as we used the same aper-tures for the photometry of δ Vel and the flux calibrators, no aperture correction was required either. This non-detection of the diffuse background was expected for two reasons: firstly due to the chopping-nodding observing procedure that removes most of the large scale galactic IR background, and secondly because the sensitivity of our images is insufficient to detect the spatially extended flux from the bow shock in the VISIR bands. The total flux from the model proposed by G´asp´ar et al. (2008) is at most 3-4 mJy in this wavelength range (Sect. 5), spread over a surface of several arcmin2, far beyond our sensitivity limit.
The integrated fluxes are affected by different atmospheric absorption due to the different airmasses compared to the cali-brators. To take this into account, we used the empirical formula by Sch ¨utz & Sterzik (2005), that gives the multiplicative correc-tion C(λ, AM) to apply to the raw flux to remove the atmospheric absorption: C(λ, AM) = 1 + " 0.220 −0.104 3 (λ − 8.6 µm) # (AM − 1) (3) We corrected separately the different observations of δ Vel and its calibrators.
In order to absolutely calibrate the measurements, the PAH1 and PAH2 fluxes from the calibrator HD 67582 were retrieved from the spectral template of Cohen et al. (1999) at the central wavelength of our filters. For HD 80007 (HIP 45238), we ad-justed a model spectrum from Castelli & Kurucz (2003) to all the photometry available in the literature to retrieve its irradiance in the NeII filter. We obtained 5.62 Jy (1.02 10−13W/m2/µm) that is within 7% of the value published on the VISIR instrument web page5(5.26 Jy). The statistical and calibration uncertainties
4 P. Kervella et al.: The eclipsing stellar system δ Velorum - I. VISIR and NACO imaging Table 3. Measured thermal IR irradiances of δ Vel A and B in
S.I. units and in Jy. The relative uncertainty σ on the irradiance values is listed in the last column.
Star Filter λ(µm) 10−14W/m2/µm Jy σ A PAH1 8.59 36.93 ± 2.68 9.10 ± 0.66 7.3% A PAH2 11.25 12.38 ± 1.22 5.24 ± 0.52 9.9% A NeII 12.81 6.70 ± 0.74 3.68 ± 0.41 11.1% B PAH1 8.59 3.82 ± 0.28 0.94 ± 0.07 7.4% B PAH2 11.25 1.38 ± 0.14 0.58 ± 0.06 10.4% B NeII 12.81 0.56 ± 0.19 0.31 ± 0.11 34%
of the measurements were estimated from the dispersion of the different available exposures (e.g. #ABEF for the PAH1 filter). The uncertainty on the NeII measurement, for which only one image is available, was taken as the dispersion of the calibrated flux for apertures of 150, 300, 600 and 1200 mas. The resulting irradiances are presented in Table 3.
The ratios ρ = f (B)/ f (A) of the fluxes of δ Vel B and δ Vel A in each band can be estimated more accurately than the absolute flux of each star due to the removal of the calibration uncertainty. We obtain the following values in the three filters:
ρ8.6 µm= 10.3 ± 0.2 %, (4)
ρ11.25 µm= 11.1 ± 0.4 %, (5)
ρ12.81 µm= 8.4 ± 2.3 %. (6)
3.2. NACO
We first obtained classical aperture photometry of δ Vel A us-ing circular apertures of 1 to 40 pixels in radius (sus-ingle pixel to 0.53′′radius), for each of our ten epochs. Although the two
components of δ Vel are well separated in the NACO images, the diffuse halo from the residuals of the adaptive optics correc-tion of δ Vel A are not negligible at the posicorrec-tion of B. For this reason, the photometry of B cannot be measured directly on the images. To remove the diffuse wings of the point spread function (PSF) of A, we subtracted from each point of the image its ring median at the corresponding radius from δ Vel A. With this pro-cedure, we cleanly subtracted the diffuse background from A, mostly without introducing additional noise. Very little residuals from star A are present on the subtracted image, thanks to the good circularity of the PSF (Fig. 4). We then measured aperture photometry using the same 1-40 pixels apertures as for A, cen-tered on B, and computed the flux ratio ρ = f (B)/ f (A) of the pair. We do not need to correct for the airmass, as both A and B are affected by the same atmospheric absorption. We checked in the images that the sky background is negligible due to the short exposures and narrow-band filter.
The choice of the aperture radius is an important factor for the accuracy of the flux ratio measurement. In order to obtain the best match between the two stars, it is essential to have the same integration radius for both stars. Over the 0.6′′distance between
the two stars, the variation of the PSF shape and Strehl ratio is negligible, especially for the good seeing conditions of our observations. Fig. 5 shows the variation of the derived flux ratio as a function of the aperture radius. There is a clear inflexion point around 15 pixels in radius (0.2′′). This corresponds to the
radius at which the wings of the PSF of B reach the noise level. The increase of ρ observed for larger apertures corresponds to the inclusion of the residuals from A in the photometry.
Fig. 4. Aperture (15 pixels = 0.2′′in radius) used for the
integra-tion of the flux of δ Vel A (left) and B (right), the latter on the ring-median subtracted NACO image (see text for details).
9,0% 9,5% 10,0% 10,5% 11,0% 0 3 6 9 12 15 18 21 24 27 30 33 36 39 42 Aperture radius (pixels)
f(B)/
f(A)
Fig. 5. Ratio ρ(2.17) = f (B)/ f (A) at 2.17 µm as a function of the
aperture radius (in pixels) used for the integration of the flux of A and B. An aperture of 15 pixels was selected for the analysis (square).
To estimate the error bar of the flux ratio, we added quadrati-cally the uncertainties due to the choice of aperture radius over a 10-15 pixel range (considered as systematic, thus not averaging out), and the dispersion of the measurements over the first nine epochs (statistical). The flux ratio is assumed to be constant out-side of the eclipses, in order to average the nine measurements (but see also Sect. 4.4). For the epoch of the eclipse, we consid-ered as uncertainty the standard deviation of the ratios obtained at the other epochs.
From this procedure, we obtain outside of the eclipse:
ρ2.17 µm= 9.66 ± 0.05% (7)
corresponding to a magnitude difference of ∆m = 2.537 ± 0.005. During the primary eclipse of δ Vel A, the flux ratio becomes:
ρ2.17 µm(Eclipse) = 14.50 ± 0.12% (8)
giving ∆m(Eclipse) = 2.097 ± 0.009. The eclipse depth at 2.17 µm is therefore d(∆m) = 0.440 ± 0.011 mag. As a remark, we did not deconvolve our NACO images, as we did not obtain a PSF calibrator for this purpose, and we leave the astrometric analysis of these images for a future article.
4. Photometric analysis
4.1. Visible magnitudes
If not specified otherwise, we assume here that the photomet-ric measurements of the δ Vel system available in the litera-ture always include the A and B components, as their angular separation has been smaller than 2′′ for at least five decades.
Bessell (1990) gives:
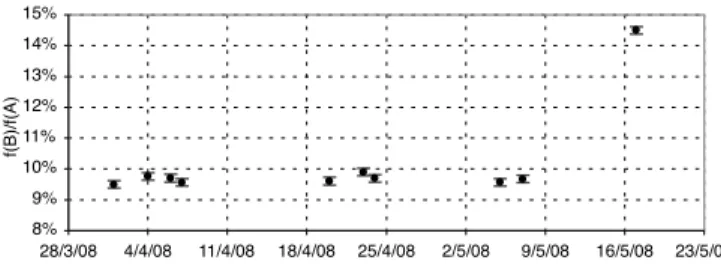
8% 9% 10% 11% 12% 13% 14% 15% 28/3/08 4/4/08 11/4/08 18/4/08 25/4/08 2/5/08 9/5/08 16/5/08 23/5/08 f(B)/ f(A)
Fig. 6. Measured value of f (B)/ f (A) at 2.17 µm for our 10
mea-surement epochs. Note the primary eclipse occuring at the last epoch.
with an associated uncertainty of ±0.02 mag.
The photometric observations from Hipparcos (ESA 1997) give the differential magnitude of Aab (combined) and B in the
Hp band, that are sufficiently close to V to consider the values identical within their error bars:
∆mH p(Aab/B) ≈ ∆mV(Aab/B) = 3.58 ± 0.07 (10) Considering Bessel’s data, this translates immediately into the following magnitude for Aab and B:
mV(Aab) = 2.00 ± 0.02 (11)
mV(B) = 5.54 ± 0.08 (12)
In addition, the combined visible photometry available in the literature (see the compilation by Otero et al. 2000) gives us the combined Aab+B magnitudes, the depth of the primary (I) and secondary (II) eclipses:
∆mV(I, Aab + B) = 0.51 ± 0.01 (13)
∆mV(II, Aab + B) = 0.32 ± 0.01 (14)
By removing the flux contribution of B computed precedently, we obtain the following eclipse depths for Aab only:
∆mV(I, Aab) = 0.53 ± 0.01 (15)
∆mV(II, Aab) = 0.33 ± 0.01 (16)
As shown by the curve presented by Otero et al. (2000), the sec-ondary eclipse of δ Vel Aab is total, and we can thus derive im-mediately the visible magnitudes of Aa and Ab:
mV(Aa) = 2.33 ± 0.03 (17)
mV(Ab) = 3.44 ± 0.03 (18)
4.2. Infrared magnitudes
In addition, our NACO observations (Sect. 3.2) give us the rela-tive fluxes of Aab and B in the narrow band filter band at 2.17 µm with a FWHM of 0.023 µm: ρ2.17 µm = 9.66 ± 0.05%. As this wavelength corresponds to an absorption line of hydrogen that is present in the spectra of hot stars, the conversion of the mea-sured narrow-band ratios to standard K band ratios requires tak-ing the position of the quasi-monochromatic wavelengths within the bands and the shape of the observed spectra into account.
We thus proceeded in two steps to obtain the conversion be-tween the narrow-band flux ratio and the broadband flux ratio. Starting from the narrow-band fluxes measured on δ Vel’s com-ponents, we computed the radius and effective temperature of
each star assuming (as a first approximation) that the K flux ra-tios are identical to the 2.17 µm rara-tios, using the method des-cussed in Sect. 4.5. This gave us a first estimation of the spec-tral types of the stars. We then used the Pickles (1998)6 refer-ence spectra corresponding to their spectral types (A2IV, A4V and F8V) to recover the corresponding broadband flux ratio. The K band standard filter profile was taken from Bessell & Brett (1988). We observed that the true ratios in the K band are very close to the ratios in the 2.17 µm filter, within 0.01 mag for all three stars, which is small compared to the other uncertain-ties. We thus neglect this difference in the following analysis.
The COBE/DIRBE instrument measured FK = 121.7 ± 11.4 Jy at 2.2 µm (Smith et al. 2004), corresponding to mK = 1.77 ± 0.10, and the 2MASS catalog (Skrutskie et al. 2006) gives an apparent K band magnitude of mK= 1.72 ± 0.26 for Aab+B, equivalent to FK = 127 ± 34 Jy. Averaging these two measure-ments, we obtain mK= 1.76 ± 0.10 and consequently:
mK(Aab) = 1.86 ± 0.09 (19)
mK(B) = 4.40 ± 0.09 (20)
4.3. Photometry during the primary eclipse
The primary eclipse of Aab in the K band observed with NACO can give us the difference in surface brightness of Ab and Aa. As this eclipse is not total, but annular, we cannot derive unambigu-ously the brightness ratio of the two stars as it depends on their angular diameters. In this paragraph, we consider that the eclipse is perfectly centered, thus neglecting a possible differential effect of the limb darkening (LD) of the two stars. As we observed very close to the eclipse minimum and in the K band, where the LD is small (the LD/UD correction is less than 3%), this appears as a reasonable assumption. We also neglect the possible distortion of the photospheres of Aa and Ab due to a possible fast rotation. During the primary eclipse, the disk of Ab “replaces” part of the disk of Aa with a lower effective temperature (hence lower surface brightness) “patch”. The eclipse depth in the K band is 0.44 ± 0.01 mag (Sect. 3.2). This can be compared with the depth of the primary eclipse in the visible: ∆mV = 0.53 ± 0.01. The “color” of the primary eclipse is therefore ∆mV −∆mK = 0.09 ±0.02 mag. This corresponds to the “differential difference” in color between the two stars between the visible and IR wave-lengths. This leads to a magnitude difference of:
mK(Ab) − mK(Aa) = 1.02 ± 0.04 (21)
corresponding to a flux ratio f (Ab)/ f (Aa) = 39.2 ± 1.4 % and:
mK(Aa) = 2.22 ± 0.09 (22)
mK(Ab) = 3.24 ± 0.09 (23)
4.4. Emergence of Ab from the secondary eclipse
It is interesting to notice that our 2008-04-23 NACO observa-tion has been obtained only about 30 minutes after the end of the secondary (total) eclipse during which the δ Vel Aa component covered Ab. The apparent disks of the two stars are therefore “touching” each other. Our measurement shows a slight vari-ation of the photometric ratio ρ = f (B)/ f (A), as we measure 9.90 ± 0.12%, compared to an average value over the eight other
6 P. Kervella et al.: The eclipsing stellar system δ Velorum - I. VISIR and NACO imaging
out-of-eclipse epochs of 9.63±0.05%. This means that the mask-ing of part of the close environment of δ Vel Ab by Aa results in a slight loss of total flux of the Aab system.
Although of marginal statistical significance (2.1 σ), this measurement is the maximum value of the out-of-eclipse ratios we obtained. It could be due to the presence of a circumstellar flux contributor of unknown nature in the immediate vicinity of δVel Ab, accounting for 0.27 ± 0.13% of the total flux of Aab. If Ab is a fast rotator, and its rotation axis is perpendicular to the orbital plane, one hypothesis could be that it is the signature of a circumstellar disk made of gas (Ae episode).
4.5. Angular diameters, radii and effective temperatures From our spatially resolved photometry of the three stars of δ Vel (Aa, Ab and B), we can deduce their limb-darkened angular di-ameters θLD, photospheric radii R and effective temperatures Teff using the surface brightness-color (SBC) relations calibrated by Kervella et al. (2004) in (V, V − K) and the Hipparcos parlax. The results are summarized in Table 4. This approach al-lows us to rely only on empirical SBC relations (calibrated by interferometric angular diameter measurements) to compute the parameters of the three stars. Another approach to determine these parameters would be to adjust directly synthetic spectra to the photometry. While the comparison with such model spec-tra is necessary to determine the IR excess (Sect. 5), it has at this stage the disadvantage of making the derived parameters de-pendent on the choice of one particular numerical model library. For this reason, we prefer to use the empirical SBC relations. In any case, the good agreement between the model spectra and the measured photometry in the visible and near-IR domains shown in the bottom parts of Fig. 7 and 8 indicates that both methods give consistent results.
The parameters of δ Vel are in good agreement with the val-ues deduced for the combined system A+B from spectroscopy by Allende Prieto & Lambert (1999): Teff= 8700 K, R = 3.9 R⊙.
The larger radius is naturally explained by the combination of the flux from Aa and Ab (and to a lesser extent of B), while the effective temperature is a weighted average of the values of the three stars. They also find an effective gravity of log g = 3.66 and a mass of M = 2.51 M⊙. The reliability of these values is
uncertain due to the effect of the orbital motion of Aab on the spectral line broadening. However, we do not confirm the large radii derived by Kellerer et al. (2007) for Aa and Ab (6.0 and 3.3 R⊙) from interferometric observations of the trio.
5. Discussion
The IR excess detected around δ Vel by IRAS was recently at-tributed by G´asp´ar et al. (2008) to interstellar dust heated by δVel. In this Section, we examine the possibility that one of the components of δ Vel A or B presents an IR excess of circum-stellar origin. For this purpose, we compare the fluxes extracted from our spatially resolved VISIR observations to the expected photospheric flux from the Aab and B components.
To retrieve the synthetic stellar spectra of the three stars from the library assembled by Castelli & Kurucz (2003), hereafter CK03, we used the parameters listed in Table 4. We read the tables for log g values of 4.0 for δ Vel Aa and Ab, and 4.5 for B, and solar metallicities. The sensitivity of the models to small variations of these two parameters is minimal. We would like to emphasize that we did not fit these spectra to the available photometry, but we simply multiplied the CK03 spectra by the
1,E-17 1,E-16 1,E-15 1,E-14 1,E-13 1,E-12 1,E-11 1,E-10 1,E-09 1,E-08 1,E-07 0,1 1,0 10,0 100,0 F lu x d e n si ty (W /m2 /mi c) Aab B 40% 60% 80% 100% 120% 140% 160% 0,1 1,0 10,0 100,0 Wavelength (mic) R a ti o F /mo d e l
Fig. 7. Spatially resolved photometry of δ Vel Aab and B
com-pared to Castelli & Kurucz (2003) models of Aa+Ab and B, considering the stellar properties listed in Table 4 (top) and the residuals compared the observations (bottom).
Table 5. Observed fluxes and excesses of δ Vel compared to the
Castelli & Kurucz (2003) models. Nσ is the measured excess expressed in number of times the measurement uncertainty.
Band λ(µm) F (10−13W/m2/µm) F/Fmod(%) Nσ Aab+B PAH1 8.59 4.07 ± 0.27 99 ± 7 -0.2 PAH2 11.25 1.38 ± 0.12 98 ± 9 -0.3 NeII 12.81 7.26 ± 0.08 86 ± 11 -1.3 Aab PAH1 8.59 3.69 ± 0.27 98 ± 7 -0.2 PAH2 11.25 1.24 ± 0.12 97 ± 10 -0.3 NeII 12.81 0.67 ± 0.07 88 ± 11 -1.1 B PAH1 8.59 0.382 ± 0.028 104 ± 7 0.5 PAH2 11.25 0.138 ± 0.014 109 ± 10 0.9 NeII 12.81 0.056 ± 0.019 74 ± 34 -0.7
squared limb-darkened angular diameter of each star (Table 4). From these spectra, we derived the expected thermal IR flux from the stellar photospheres of Aa+Ab and B in the PAH1, PAH2 and NeII filters corresponding to our VISIR observations. We can also add the CK03 spectra of the three stars in or-der to compare the predicted flux of the trio to the existing non spatially resolved measurements of A+B from the litera-ture. The resulting spectrum is shown in Fig. 8. The photomet-ric measurements are taken from Thompson et al. (1978; UV fluxes from TD1), Morel et al. (1978; U BVRI), Skrutskie et al. (2006; 2MASS JHK), Smith et al. (2004; COBE/DIRBE, four wavelengths from 1.25 to 4.5 µm), VISIR (8.6, 11.25 and 12.81 µm, this work), Jayawardhana et al. (2001; N and 18.2 µm
Table 4. Properties of δ Vel Aa, Ab and B derived from their V and K band magnitudes using the surface brightness-color relations
from Kervella et al. (2004). The bolometric corrections for the V band were taken from Bessell et al. (1998). The approximate masses of the three stars are discussed in Sect. 5.
Star θLD(mas) Radius (R⊙) Teff(K) MV BCV Mbol L/L⊙ Spect. M/M⊙
Aa 1.21 ± 0.03 3.17 ± 0.08 9 000 ± 400 0.39 ± 0.04 -0.07 0.32 ± 0.04 59.2 ± 2.0 A2IV 2.5 ± 0.1 Ab 0.77 ± 0.02 2.02 ± 0.05 8 600 ± 350 1.50 ± 0.04 0.00 1.50 ± 0.04 20.0 ± 0.7 A4V 2.0 ± 0.1 B 0.53 ± 0.02 1.39 ± 0.06 6 350 ± 350 3.60 ± 0.04 0.00 3.60 ± 0.04 3.1 ± 0.2 F8V 1.3 ± 0.1 1,E-17 1,E-16 1,E-15 1,E-14 1,E-13 1,E-12 1,E-11 1,E-10 1,E-09 1,E-08 1,E-07 0,1 1,0 10,0 100,0 F lu x d e n si ty (W /m2 /mi c) 60% 80% 100% 120% 140% 160% 180% 200% 0,1 1,0 10,0 100,0 Wavelength (mic) R a ti o F /mo d e l
Fig. 8. Total model flux of δ Vel Aab+B (solid curve), together
with the available photometry from the literature (squares) and the VISIR photometry (filled circles). The dashed curve is the flux contribution of the IR excess model proposed by G´asp´ar et al. (2008). The bottom plot shows the relative photometry with respect to the combined photospheric model of the three stars.
bands), G´asp´ar et al. (2008; Spitzer/MIPS 24 and 70 µm), and IPAC (1986; IRAS 12, 25 and 60 µm). The additional flux from the bow shock model proposed by G´asp´ar et al. (2008) is shown on both panels of Fig. 8 as a dashed curve. Its contribution in the range of wavelengths sampled by our VISIR observations appears negligible (≈ 0.1% of the photospheric flux).
As shown in Fig. 7, Fig. 8 and Table 5, the comparison with our VISIR spatially resolved photometry of δ Vel A and B does not show a significant circumstellar IR excess in the VISIR bands compared to the expected photospheric flux of each of the two components, at a few percent level. The excess that is visible longwards of 10 µm in Fig. 8 comes from the flux contribution of the ISM bow shock at large angular distances that has been observed by G´asp´ar et al. (2008). We note that the IRAS and Jayawardhana et al. (2001) photometry shows an excess com-pared to their model between 12 and 25 µm. This may be a con-sequence of the fact that the flux contribution from the ISM is (at least partly) included in the large aperture measurements (IRAS in particular), but not in our narrow aperture photometry.
0,00 0,50 1,00 1,50 2,00 2,50 3,70 3,75 3,80 3,85 3,90 3,95 4,00 4,05 4,10 Log Teff (K) L o g L (L su n ) 1 Msun 1.5 Msun 2.0 Msun 2.5 Msun 3.0 Msun 200 Myrs 500 Myrs 700 Myrs Aa Ab B 1.2 Msun 1 Gyrs
Fig. 9. Positions of δ Vel Aa, Ab and B in the HR diagram, with
the isochrones and isomass curves from Girardi et al. (2000) overplotted.
We notice a relatively large ultraviolet excess on δ Vel in Fig. 8. A fast rotating star usually presents a UV excess due to its overheated polar caps (von Zeipel effect, see e.g. Aufdenberg et al. 2006). A discussion on the rotational velocity of the compo-nents of δ Vel A can be found in Argyle, Alzner & Horch (2002). As a remark, Royer, Zorec & Gomez (2007) found a rotational velocity of v sin i = 150 km/s, but this was computed for the combined spectrum of the three stars of δ Vel so a bias may be present.
The physical parameters derived for the three stars (Table 4) indicate that δ Vel Aa already evolved away from the main sequence. This is confirmed by the evolutionary tracks from Girardi et al. (2000), shown in Fig. 9, that give approximate masses of 2.5, 2.0 and 1.3 M⊙respectively for Aa, Ab and B, and
an age of approximately 400 − 500 Myrs for the system. This age compares well with the age of 330-390 Myr proposed by Rieke et al. (2005), while the masses are in relatively good agreement with Argyle, Alzner & Horch (2002), who determined a total dy-namical mass of the δ Vel AB system of 5.7+1.3
−1.1M⊙. We postpone
a more detailed discussion of the ages and evolutionary status of the δ Vel stars to a forthcoming paper.
6. Conclusion
Our VISIR photometry of δ Vel A and B does not show the pres-ence of an excess of circumstellar origin in the thermal IR do-main (8−13 µm) at a level of a few percents. This result indicates that these stars do not host a warm debris disk with a typical temperature around 200-300 K. This supports the conclusions of G´asp´ar et al. (2008) who attribute the IR excess detected with
ab-8 P. Kervella et al.: The eclipsing stellar system δ Velorum - I. VISIR and NACO imaging
sence of a warm circumstellar disk in the inner δ Vel system may be a consequence of the gravitational interactions between the three stars. They could have caused the dispersion of the residual circumstellar material from which they stars formed. However, the possibility still exists that a cold debris disk is present, as in the case of Vega (Su et al. 2005) and Fomalhaut (Stapelfeldt et al. 2004), but at large distances from the stars. In order to test this scenario, observations of δ Vel in the far IR or submillimet-ric domain similar for instance to those of Fomalhaut by Holland et al. (2003) would be necessary.
From the flux ratios in the V and K bands, we could derive the physical properties of the three stars Aa, Ab and B. δ Vel appears as a moderately evolved system, with the Aa compo-nent currently leaving the main sequence. As suggested by the
v sin i value of Royer et al. (2007), the ultraviolet excess of δ Vel
and our putative observation of near-IR circumstellar emission close to Ab may indicate that δ Vel Ab (and/or Aa) could be a fast rotator, turning this eclipsing system into a promising object to map the polar brightening associated to the von Zeipel effect (von Zeipel 1924).
Acknowledgements. We are grateful to the ESO observing team at Paranal for
the perfect execution of our NACO observations of δ Vel, in particular for the time-critical eclipse on May 18th, 2008. We also warmly thank Sebastian Otero (Asociaci´on Cielo Sur, Argentina), Brian Fraser (Sunninghill Observatory, South Africa) and Jaime Garc´ia (Instituto Cop´ernico, Argentina) for providing the visible photometry of δ Vel. This work received the support of PHASE, the high angular resolution partnership between ONERA, Observatoire de Paris, CNRS and University Denis Diderot Paris 7. This research took advantage of the SIMBAD and VIZIER databases at the CDS, Strasbourg (France), and NASA’s Astrophysics Data System Bibliographic Services.
References
Allende Prieto, & Lambert D. L. 1999, A&A, 352, 555 Argyle, R. W., Alzner, A., & Horch, E. P. 2002, A&A, 384, 171
Aufdenberg, J. P., M´erand, A., Coud´e du Foresto, V., et al. 2006a, ApJ, 645, 664, Erratum 2006, ApJ, 651, 617
Bessell, M. S. & Brett, J. M. 1988, PASP, 100, 1134 Bessell M. S., Castelli F., & Plez B. 1998, A&A, 333, 231 Bessell, M. S. 1990, A&A Suppl. Ser., 83, 357
Castelli, F. & Kurucz, R. L. 2003, IAU Symposium 210, Modelling of Stellar Atmospheres, Uppsala, Sweden, eds. N.E. Piskunov, W.W. Weiss. and D.F. Gray, 2003, ASP-S210, arXiv:astro-ph/0405087
Cohen, M., Walker, R. G., Carter, B., et al. 1999, AJ, 117, 1864
Doucet, C., Lagage, P. O. & Pantin, E. 2007, Proc. of the VIRA conference, Paris, 20-22 march 2006, in press, astro-ph/0610322
Domiciano de Souza, A., Kervella, P., Bendjoya, Ph, & Niccolini, G. 2008, A&A, 480, L29
Doucet, C., Habart, E., Pantin, E. et al. 2007, A&A, 470, 625 ESA 1997, The Hipparcos and Tycho Catalogues, ESA SP-1200 G´asp´ar, A., Su, K. Y. L., Rieke, G. H., et al. 2008, ApJ, 672, 974
Girardi, L., Bressan, A., Bertelli, G., Chiosi. C. 2000, A&A Suppl. Ser., 141, 371 Holland, W. S., Greaves, J. S., Dent, W. R. F., et al. 2003, ApJ, 582, 1141 IPAC 1986, IRAS Catalog of Point Sources, Version 2.0, Joint IRAS Science
W.G.
Jayawardhana, R., Scott Fisher, R., Telesco, C. M., et al. 2001, AJ, 122, 2047 Kellerer, A., Petr-Gotzens, M., Kervella, P., & Coud´e du Foresto, P. 2007, A&A,
469, 633
Kervella, P., Th´evenin F., Di Folco, E., & S´egransan, D. 2004, A&A, 426, 297 Kervella, P., & Domiciano de Souza, A. 2007, A&A, 474, L49
Lagage, P.O. et al. 2004, The ESO Messenger 117, 12
Lenzen, R., Hofmann, R., Bizenberger, P., & Tusche, A. 1998, SPIE 3354, 606 Masciadri, E., Brandner, W., Bouy, H. et al. 2003, A&A, 411, 157
Morel M., & Magnenat P. 1978, A&A Suppl., 34, 477 Otero, S. A., et al. 2000, IBVS, 4999
Pickles, A. J. 1998, PASP, 110, 863
Rieke G. H., Su K. Y. L., Stansberry J. A., et al. 2005, ApJ, 620, 1010 Royer, F., Zorec J., & Gomez A. E. 2007, A&A 463, 671
Rousset, G., Lacombe, F., Puget, F., et al. 2003, Proc. SPIE 4839, 140 Sch¨utz, O., & Sterzik, M. 2005, Proc. ESO Workshop “High Resolution Infrared
Spectroscopy in Astronomy”, H. U. K¨aufl, R. Siebenmorgen, and A. Moorwood ed., 104-108
Skrutskie, R. M., Cutri, R., Stiening, M. D., et al. 2006, AJ, 131, 1163 Smith B. J., Price S. D., Baker R. I. 2004, ApJ Suppl. Ser., 154, 673 Stapelfeldt, K. R., Holmes, E. K., Chen, C., et al. 2004, ApJS, 154, 458 Su, K. Y. L., Rieke, G. H., Misselt, K. A., et al. 2005, ApJ, 628, 487
Thompson G. I., Nandy K., Jamar C., et al. 1978, “Catalogue of stellar ultraviolet fluxes (TD1)”, The Science Research Council, U.K. (1978)
Tokovinin, A., Sarazin, M. & Smette, A. 2007, MNRAS, 378, 701 von Zeipel, H. 1924, MNRAS 84, 665