HAL Id: hal-01404161
https://hal.sorbonne-universite.fr/hal-01404161
Submitted on 28 Nov 2016
HAL is a multi-disciplinary open access
archive for the deposit and dissemination of
sci-entific research documents, whether they are
pub-lished or not. The documents may come from
teaching and research institutions in France or
abroad, or from public or private research centers.
L’archive ouverte pluridisciplinaire HAL, est
destinée au dépôt et à la diffusion de documents
scientifiques de niveau recherche, publiés ou non,
émanant des établissements d’enseignement et de
recherche français ou étrangers, des laboratoires
publics ou privés.
Distributed under a Creative Commons Attribution| 4.0 International License
Célina Roda, Hélène Charreire, Thierry Feuillet, Joreintje D. Mackenbach,
Helga Bárdos, Sofie Compernolle, Ketevan Glonti, Harry Rutter, Martin
Mckee, Johannes Brug, et al.
To cite this version:
Célina Roda, Hélène Charreire, Thierry Feuillet, Joreintje D. Mackenbach, Helga Bárdos, et al..
Lifestyle correlates of overweight in adults: a hierarchical approach (the SPOTLIGHT project).
In-ternational Journal of Behavioral Nutrition and Physical Activity, BioMed Central, 2016, 13, pp.114.
�10.1186/s12966-016-0439-x�. �hal-01404161�
R E S E A R C H
Open Access
Lifestyle correlates of overweight in adults:
a hierarchical approach (the SPOTLIGHT
project)
Célina Roda
1, Hélène Charreire
1,2, Thierry Feuillet
1, Joreintje D. Mackenbach
3, Sofie Compernolle
4, Ketevan Glonti
5,
Helga Bárdos
6, Harry Rutter
5, Martin McKee
5, Johannes Brug
3, Ilse De Bourdeaudhuij
4, Jeroen Lakerveld
3and Jean-Michel Oppert
1,7*Abstract
Background: Obesity-related lifestyle behaviors usually co-exist but few studies have examined their simultaneous relation with body weight. This study aimed to identify the hierarchy of lifestyle-related behaviors associated with being overweight in adults, and to examine subgroups so identified.
Methods: Data were obtained from a cross-sectional survey conducted across 60 urban neighborhoods in 5 European urban regions between February and September 2014. Data on socio-demographics, physical activity, sedentary behaviors, eating habits, smoking, alcohol consumption, and sleep duration were collected by
questionnaire. Participants also reported their weight and height. A recursive partitioning tree approach (CART) was applied to identify both main correlates of overweight and lifestyle subgroups.
Results: In 5295 adults, mean (SD) body mass index (BMI) was 25.2 (4.5) kg/m2, and 46.0 % were overweight (BMI ≥25 kg/m2
). CART analysis showed that among all lifestyle-related behaviors examined, the first identified correlate was sitting time while watching television, followed by smoking status. Different combinations of lifestyle-related behaviors (prolonged daily television viewing, former smoking, short sleep, lower vegetable consumption, and lower physical activity) were associated with a higher likelihood of being overweight, revealing 10 subgroups. Members of four subgroups with overweight prevalence >50 % were mainly males, older adults, with lower education, and living in greener neighborhoods with low residential density.
Conclusion: Sedentary behavior while watching television was identified as the most important correlate of being overweight. Delineating the hierarchy of correlates provides a better understanding of lifestyle-related behavior combinations which may assist in targeting preventative strategies aimed at tackling obesity.
Keywords: CART, Eating habits, Lifestyle-related behaviors, Obesity, Physical activity, Sedentary behavior, Sleep, Smoking status, Television viewing
* Correspondence:jean-michel.oppert@aphp.fr
1Équipe de Recherche en Épidémiologie Nutritionnelle (EREN), Université
Paris 13, Centre de Recherche en Épidémiologie et Statistiques, Inserm (U1153), Inra (U1125), Cnam, COMUE Sorbonne Paris Cité, Bobigny F-93017, France
7Sorbonne Universités, Université Pierre et Marie Curie, Université Paris 06,
Institute of Cardiometabolism and Nutrition, Department of Nutrition, Pitié-Salpêtrière Hospital, Assistance Publique-Hôpitaux de Paris, Paris, France Full list of author information is available at the end of the article
© The Author(s). 2016 Open Access This article is distributed under the terms of the Creative Commons Attribution 4.0 International License (http://creativecommons.org/licenses/by/4.0/), which permits unrestricted use, distribution, and reproduction in any medium, provided you give appropriate credit to the original author(s) and the source, provide a link to the Creative Commons license, and indicate if changes were made. The Creative Commons Public Domain Dedication waiver (http://creativecommons.org/publicdomain/zero/1.0/) applies to the data made available in this article, unless otherwise stated.
Roda et al. International Journal of Behavioral Nutrition and Physical Activity (2016) 13:114
Background
Excess body weight is determined by multiple factors acting in combination, including genetic, metabolic and behavioral factors, as well as more upstream socio-economic influences and built environment characteris-tics [1]. Those that are modifiable provide important potential targets for preventive interventions [2]. Diet and physical activity are recognized as the most prox-imal determinants of energy balance [3] but there is growing recognition of the role of sedentary behaviors (e.g., sitting time), independent of physical activity [4–7]. The influences of smoking and alcohol intake on body weight are also well documented [8–10]. More recently, a role has also been suggested for sleep duration [11–13].
The inter-relationship of these obesity-related lifestyle behaviors has stimulated interest in co-occurrence pat-terns [14, 15]. Several studies have used explorative data-driven methods, such as cluster analysis or latent class analysis to examine the relations between diet, physical activity, and sedentary behaviors, independently of the health outcome of interest [6, 16, 17]. Smoking status and alcohol consumption have been included in some analyses [18–20]. The variety of methodologies used make it difficult to ascertain how these factors cor-relate with each other and what this means for body weight and health. Additionally, previous studies have not considered contextual factors such as socio-economic characteristics and the built environment, in-creasingly recognized as major upstream determinants of overweight [21].
A recursive partitioning method—the classification and regression tree (CART) approach [22]—makes it possible to examine how a set of risk factors jointly in-fluence the risk of an outcome such as overweight. This approach has previously been used to assess the risk of overweight in children [23, 24] and the risk of reduced mobility in older obese adults [25].
This study sought to identify the hierarchy of lifestyle-related behaviors associated with overweight in Euro-pean adults, and to examine how subgroups identified differed by socio-demographic and built environment characteristics.
Methods
Study design and sampling
This study, part of the EU-funded SPOTLIGHT project [26], was conducted in five European urban regions: Ghent and suburbs (Belgium), Paris and inner suburbs (France), Budapest and suburbs (Hungary), the Randstad (a conurbation including Amsterdam, Rotterdam, the Hague and Utrecht in the Netherlands) and Greater London (United Kingdom). Sampling of neighborhoods and recruitment of participants have been described in detail elsewhere [27]. Briefly, neighborhood sampling
was based on a combination of residential density and socio-economic status (SES) data at the neighborhood level. This resulted in four pre-specified neighborhood types: low SES/low residential density, low SES/high residential density, high SES/low residential density and high SES/high residential density. In each country, three neighborhoods of each neighborhood type were ran-domly sampled (i.e. 12 neighborhoods per country, 60 neighborhoods in total). Subsequently, adult inhabitants (≥18 years) were invited to participate in a survey. A total of 6037 individuals participated in the study be-tween February and September 2014. The study was ap-proved by the corresponding local ethics committees of participating countries and all participants in the survey provided informed consent.
Measures Body mass index
Body mass index (BMI) was calculated by dividing self-reported weight (kg) by the square of the self-self-reported height (m2). Adults were categorized as overweight if their BMI was≥25 kg/m2[1].
Socio-demographic data
Socio-demographic variables included age, gender and educational level (defined as‘lower’ [from less than pri-mary to higher secondary education] and ‘higher’ [col-lege or university level] to allow comparison between country-specific education systems).
Physical activity
Physical activity during the last 7 days was documented using questions from the long version of the validated International Physical Activity Questionnaire (IPAQ) [28]. Good reliability (Spearman correlation coefficients ranged from 0.46 to 0.96) and acceptable criterion valid-ity (median ρ of about 0.30) have been found for this questionnaire in a 12 country study [28]. Transport-related and leisure time physical activity were estimated (in minutes per day− min/d) by multiplying the fre-quency (number of days in the last 7 days) and duration (average time/d).
Sedentary behavior
The validated Marshall questionnaire was used to collect sedentary behavior data during the last 7 days [29]. Acceptable criterion validity (Spearman correlation coefficient greater than or equal to 0.50 for watching TV, and using a computer at home during weekdays) has been demonstrated. Lowest validity coefficients were found for other leisure-time activities and transport-related sedentary behaviors during weekend days (correl-ation coefficients ranged from 0.15 to 0.42) [29]. Time spent (min/d) sedentary for travel, television (TV),
computer and other leisure time activities (e.g., socializ-ing, movies but not including TV and computer use) was averaged over a week.
Eating habits
Current eating habits were assessed using common food frequency questions on consumption of fruit, vegetables, fish, sweets, fast-food, sugar-sweetened beverages, and alcohol. Response options were ‘once a week or less’, ‘2 times a week’, ‘3 times a week’, ‘4 times a week’, ‘5 times a week’, ‘6 times a week’, ‘7 times a week’, ‘twice a day’, and ‘more than twice a day’.
Smoking status
Participants reported their smoking status: current, former or never.
Sleep duration
Participants provided information on their hours of sleep during an average night. The response options ranged from 4 to 16 h/night (in half-hour intervals).
Neighborhood clusters
Four neighborhood clusters were previously identified based on data related to food and physical activity fea-tures of the built environment collected by a Google Street View-based virtual audit performed in 59 study neighborhoods [30]. The clusters were labeled: cluster 1 (n = 33) ‘green neighborhoods with low residential dens-ity’, cluster 2 (n = 16) ‘neighborhoods supportive of active mobility’, cluster 3 (n = 7) ‘high residential density neigh-borhoods with food and recreational facilities’, and clus-ter 4 (n = 3) ‘high residential density neighborhoods with low level of aesthetics’.
Data analysis CART approach
Recursive partitioning was used to identify the hierarchy and combinations of all lifestyle-related behaviors de-scribed in the Measures section that best differentiated overweight (≥25 kg/m2
) vs. non-overweight (<25 kg/m2) participants.
Recursive partitioning is an algorithm of the CART nonparametric statistical method [22]. This approach has been used in different research fields, such as genetic epidemiology [31], and produced greater homogeneity in subgroups than has been achieved with other ap-proaches, such as regression models [32]. Recursive par-titioning is a step-by-step process by which a decision tree is built by either splitting or not splitting each node of the tree into two daughter nodes. Each possible split among all variables present at each node is considered. The tree is constructed by the algorithm asking a se-quence of hierarchical Boolean (yes/no) questions (e.g.,
is Xi≤ θj ?, where Xi is a candidate variable, and θj is a
cut-off ) generating descendant nodes [33]. The cut-off in the candidate variable that produced the maximal dif-ferentiation between individuals is retained, and used to split the sample into two subgroups (i.e. two daughter nodes). This process is repeated for each new subgroup found. Every variable is a potential candidate at each stage in growing the tree, so some variables may appear several times, using different cut-offs. The best way to split the data is determined by the Gini impurity index. This index ranges from 0 (pure node, i.e. all observations within the node assigned to a single target class—e.g., a node with a class distribution [0;1]) to 1 (impure node, i.e. mixed target classes—e.g., a node with a class distri-bution [0.5;0.5]). The complete tree is pruned by a se-quential node-splitting process to avoid over-fitting the data; a sequence of sub-trees is generated and compared. The optimum tree is obtained using both cross-validation and cost-complexity pruning method. The cost-complexity pruning method assesses the balance between misclassification costs and complexity of the sub-tree. Additionally, each terminal node was set to re-quire a minimum of 200 subjects.
Lifestyle subgroups
Characteristics of the subgroups identified through the CART analysis were compared. All variables included in the CART analysis were considered, in addition to socio-demographic and built environment characteristics (i.e. urban region, neighborhood type—pre-specified neigh-borhood type, and residential density and SES levels ex-amined separately—and neighborhood cluster).
Chi-squared tests, and Kruskal-Wallis tests with post-hoc Bonferroni-Dunn test were used to examine differ-ences between subgroups.
Multilevel regression analyses
Because participants were nested within neighborhoods, the likelihood of being overweight for each partitioning variable was estimated by a multilevel logistic regression model (neighborhood identifier included as a random ef-fect) adjusted for potential confounders (gender, age, education level, and neighborhood type).
Statistical analyses were performed using R version 3.2 [34] (‘R-part’ package [35]), and STATA software (release 13.0; Stata Corporation, College Station, TX, USA).
Results
Characteristics of the study population
Results are given for 5295 individuals for whom BMI was available. The study population comprised 55.8 % females, with a mean (standard deviation-SD) age of 51.7 (16.4) years; 54 % were highly educated. Mean BMI was 25.2 (4.5) kg/m2, and 46.0 % adults were overweight.
Compared to non-overweight subjects, overweight adults were more likely to be male, older, less educated, former smokers, short sleepers, less physically active, eating less fruit and vegetables, and spending more time sitting, especially when viewing TV. The prevalence of overweight ranged from 38.3 % in Greater Paris to 53.2 % in Greater Budapest (Table 1).
CART analysis
The final tree contained 10 nodes (i.e. 10 subgroups) and had a classification error of 35.4 %. The 6 variables that were retained as the most important for discrimin-ating overweight status were in the following order: sed-entary time while watching TV, smoking status, sleep duration, leisure time physical activity, and vegetable in-take (Fig. 1).
The odds of being overweight were 61 % (41–85 %) higher for those reporting longer time watching TV (≥142 min/d) than others.
Longer time spent watching TV (≥142 min/d) and be-ing a former smoker were important correlates of over-weight. Current or non-smokers who spent a long time watching TV and were less physically active during leis-ure time were also at risk of being overweight.
Among adults watching less TV (<142 min/d) and be-ing former smokers, those who were short sleepers (<7 h/night) were more likely to be overweight com-pared to long sleepers. Protective factors against being overweight among current and non-smokers included: short time watching TV, being physically active during leisure time, and eating vegetables every day.
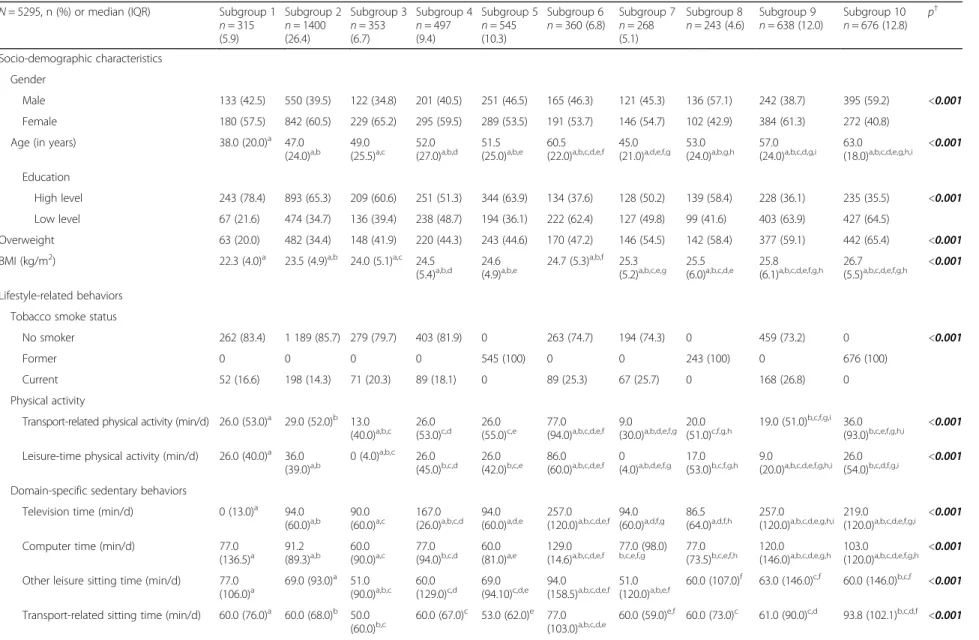
Lifestyle subgroups
Table 2 shows the characteristics of the subgroups identi-fied by CART. The proportion of overweight subjects ranged from 20 % (Subgroup 1) to 65.4 % (Subgroup 10). Overall, participants from the various subgroups differed in terms of lifestyle-related behaviors as well as socio-demographic and built environment characteristics.
Subgroup 1 (n = 315, mean [SD] BMI: 22.7 [3.4] kg/m2
) consisted of the youngest (40.8 [13.6] years-old), and highly educated participants (78.4 %). This subgroup re-ported the lowest time spent watching TV (mean [SD]: 5.2 [7.9] min/day, median: 0 min/day), the highest mean frequency of eating fruits and vegetables. The highest per-centage of participants living in neighborhoods that were characterized by high SES and high residential density was observed in this subgroup, as was the lowest percentage of participants living in‘green neighborhoods with low resi-dential density’.
In 4 subgroups (7, 8, 9, and 10), overweight prevalence was >50 %. Members lived mainly in low SES neighbor-hoods. Subgroup 7 grouped less physically active individ-uals, who ate fruits, vegetables, and fish less frequently.
Subgroup 8 members were short sleepers. The greatest percentage of individuals living in low residential neigh-borhoods was reported in this subgroup. Subgroup 9 in-cluded the greatest percentage of current smokers, individuals who reported long mean time watching TV (mean [SD]: 306.0 [131.3] min/day, median: 257 min/ day), and high mean consumption of sugar-sweetened beverages (4.9 [5.7] times/week, median: 3.0 times/week).
Subgroup 10 (n = 676, mean [SD] BMI = 27.2 [5.0] kg/m2) included mainly males, older (59.6 [14.4] years-old) and low educated adults (64.5 %), who re-ported high alcohol consumption and living in ‘green neighborhoods with low residential density’.
Discussion
This study investigated the hierarchy and combination of lifestyle-related behaviors in relation to the prevalence of overweight in European adults. Prolonged sitting while watching TV, being a former smoker, short sleep, lower levels of physical activity and lower vegetable con-sumption were the lifestyle-behaviors that identified the subgroups with highest likelihood of being overweight. High-risk subgroups included mainly males, older and less well educated adults living in greener neighborhoods with low residential density.
Although it is well recognized that overweight and obesity are multifactorial in origin [1, 2], few studies have examined the joint relation of lifestyle-related behaviors with overweight in adults. In this study, a hier-archy of lifestyle-related behaviors in identifying sub-groups at risk was established through a visual chart showing how risk factors are inter-related. The tree indi-cated that the most important factor was sitting while watching TV. This variable appeared several times at dif-ferent levels of the tree, underlying its importance. The variable that followed was smoking status, in both tree branches, and no additional variable appeared to explain the risk for overweight in former smokers (among those with longer duration of watching TV), suggesting its very high impact. Sleep duration, leisure time physical activity and vegetable intake appeared at later stages in the tree, suggesting they would have less importance compared to sedentary behavior and smoking status. Re-lations between the lifestyle-related behaviors and over-weight status were confirmed in multilevel regression analyses taking into account potential confounding fac-tors. The findings also suggested nonlinear relations be-tween lifestyle-related behaviors and overweight. Indeed, subgroups who watched TV a lot (>180 min/d) had lower odds of being overweight than subgroups who watched less TV (between 24 min/d and 142 min/d).
Although it has been suggested that a combination of several sedentary behavior variables is appropriate to capture sedentary lifestyle [36], only TV viewing was
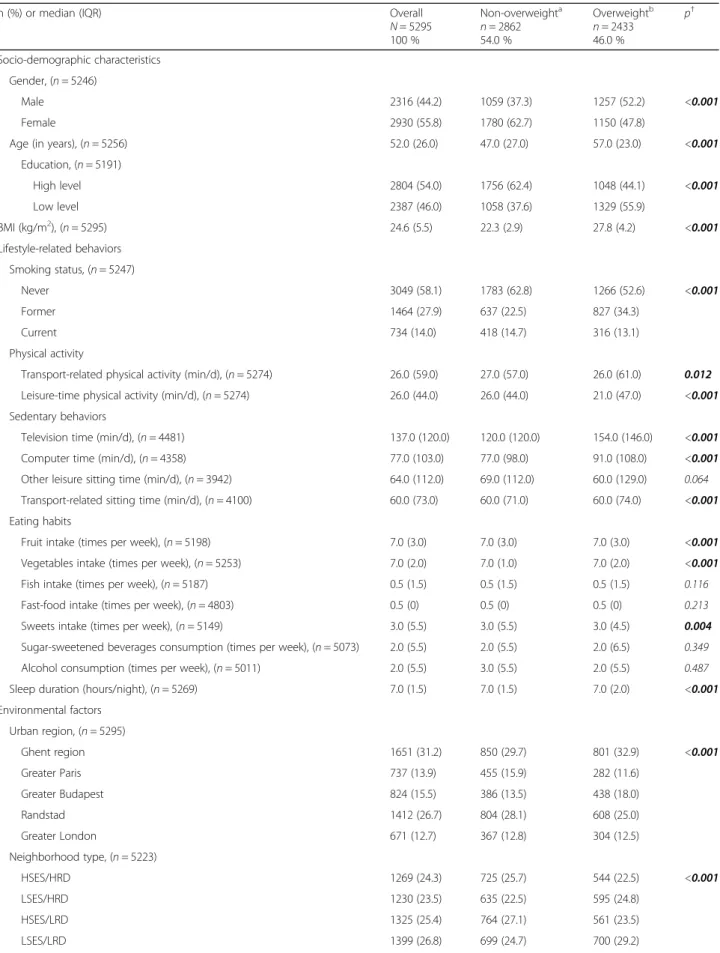
Table 1 Characteristics of the overall study population and according to weight status in the SPOTLIGHT study
n (%) or median (IQR) Overall
N = 5295 100 % Non-overweighta n = 2862 54.0 % Overweightb n = 2433 46.0 % p† Socio-demographic characteristics Gender, (n = 5246) Male 2316 (44.2) 1059 (37.3) 1257 (52.2) <0.001 Female 2930 (55.8) 1780 (62.7) 1150 (47.8)
Age (in years), (n = 5256) 52.0 (26.0) 47.0 (27.0) 57.0 (23.0) <0.001
Education, (n = 5191) High level 2804 (54.0) 1756 (62.4) 1048 (44.1) <0.001 Low level 2387 (46.0) 1058 (37.6) 1329 (55.9) BMI (kg/m2), (n = 5295) 24.6 (5.5) 22.3 (2.9) 27.8 (4.2) <0.001 Lifestyle-related behaviors Smoking status, (n = 5247) Never 3049 (58.1) 1783 (62.8) 1266 (52.6) <0.001 Former 1464 (27.9) 637 (22.5) 827 (34.3) Current 734 (14.0) 418 (14.7) 316 (13.1) Physical activity
Transport-related physical activity (min/d), (n = 5274) 26.0 (59.0) 27.0 (57.0) 26.0 (61.0) 0.012 Leisure-time physical activity (min/d), (n = 5274) 26.0 (44.0) 26.0 (44.0) 21.0 (47.0) <0.001 Sedentary behaviors
Television time (min/d), (n = 4481) 137.0 (120.0) 120.0 (120.0) 154.0 (146.0) <0.001
Computer time (min/d), (n = 4358) 77.0 (103.0) 77.0 (98.0) 91.0 (108.0) <0.001
Other leisure sitting time (min/d), (n = 3942) 64.0 (112.0) 69.0 (112.0) 60.0 (129.0) 0.064 Transport-related sitting time (min/d), (n = 4100) 60.0 (73.0) 60.0 (71.0) 60.0 (74.0) <0.001 Eating habits
Fruit intake (times per week), (n = 5198) 7.0 (3.0) 7.0 (3.0) 7.0 (3.0) <0.001
Vegetables intake (times per week), (n = 5253) 7.0 (2.0) 7.0 (1.0) 7.0 (2.0) <0.001
Fish intake (times per week), (n = 5187) 0.5 (1.5) 0.5 (1.5) 0.5 (1.5) 0.116
Fast-food intake (times per week), (n = 4803) 0.5 (0) 0.5 (0) 0.5 (0) 0.213
Sweets intake (times per week), (n = 5149) 3.0 (5.5) 3.0 (5.5) 3.0 (4.5) 0.004
Sugar-sweetened beverages consumption (times per week), (n = 5073) 2.0 (5.5) 2.0 (5.5) 2.0 (6.5) 0.349 Alcohol consumption (times per week), (n = 5011) 2.0 (5.5) 3.0 (5.5) 2.0 (5.5) 0.487
Sleep duration (hours/night), (n = 5269) 7.0 (1.5) 7.0 (1.5) 7.0 (2.0) <0.001
Environmental factors Urban region, (n = 5295) Ghent region 1651 (31.2) 850 (29.7) 801 (32.9) <0.001 Greater Paris 737 (13.9) 455 (15.9) 282 (11.6) Greater Budapest 824 (15.5) 386 (13.5) 438 (18.0) Randstad 1412 (26.7) 804 (28.1) 608 (25.0) Greater London 671 (12.7) 367 (12.8) 304 (12.5) Neighborhood type, (n = 5223) HSES/HRD 1269 (24.3) 725 (25.7) 544 (22.5) <0.001 LSES/HRD 1230 (23.5) 635 (22.5) 595 (24.8) HSES/LRD 1325 (25.4) 764 (27.1) 561 (23.5) LSES/LRD 1399 (26.8) 699 (24.7) 700 (29.2)
retained among several variables related to sedentary time. The greater importance of TV viewing has been previously suggested in cross-sectional studies [37–39]. Given the lack of evidence from prospective studies, the issue of bidirectional or reverse causality has been raised [40]. In the Nurses’ Health study, each 2 h/d increment in TV watching was associated with a 23 % [17–30 %] increased risk of obesity. However, the risk of developing obesity was attenuated after adjustment for baseline
BMI [5]. These findings may suggest that, even at base-line, women who watched more TV were already on a trajectory to become obese [5]. Heavier individuals at baseline could have a preference for sedentary habits due to their higher body weight. TV viewing is not only an indicator of sedentary behavior but may represent a potential surrogate of other behaviors affecting the energy balance e.g., via increased snack-ing behavior [7, 41].
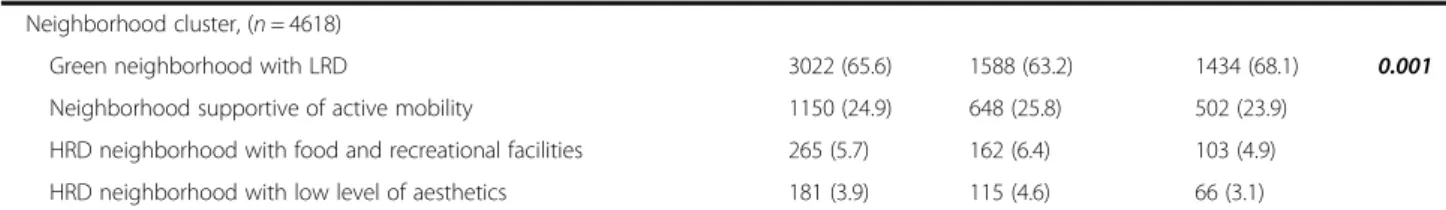
Table 1 Characteristics of the overall study population and according to weight status in the SPOTLIGHT study (Continued)
Neighborhood cluster, (n = 4618)
Green neighborhood with LRD 3022 (65.6) 1588 (63.2) 1434 (68.1) 0.001
Neighborhood supportive of active mobility 1150 (24.9) 648 (25.8) 502 (23.9) HRD neighborhood with food and recreational facilities 265 (5.7) 162 (6.4) 103 (4.9) HRD neighborhood with low level of aesthetics 181 (3.9) 115 (4.6) 66 (3.1)
Abbreviations: BMI body mass index, H- high-, IQR interquartile range, L- low-, RD residential density, SD standard deviation, SES socio-economic status
a
Non-overweight: BMI <25 kg/m2
b
Overweight: BMI≥25 kg/m2
†p-value from Chi-squared or Kruskal-Wallis test comparing overweight and non-overweight subjects
Boldface indicates statistical significance
Fig. 1 Recursive partitioning analysis (CART) of lifestyle-related behaviors for overweight status in SPOTLIGHT study (N = 5295). In dark grey are the identified subgroups with overweight prevalence above 50 %, and in light grey, those with overweight prevalence below 50 %. OR [95 %], odds ratios and confidence intervals at 95 % for each partitioning variable obtained by multilevel logistic regression model (dependent variable: overweight [yes/no], independent variables: partitioning variable identified by CART, gender, age, education, neighborhood type, and neighbor-hood identifier included as a random effect) are also provided. Abbreviations: h/n hours per night, min/d minutes per day, t/w times per week
Table 2 Profiles of the subgroups identified by recursive partitioning analysis (CART) in the SPOTLIGHT study
N = 5295, n (%) or median (IQR) Subgroup 1 n = 315 (5.9) Subgroup 2 n = 1400 (26.4) Subgroup 3 n = 353 (6.7) Subgroup 4 n = 497 (9.4) Subgroup 5 n = 545 (10.3) Subgroup 6 n = 360 (6.8) Subgroup 7 n = 268 (5.1) Subgroup 8 n = 243 (4.6) Subgroup 9 n = 638 (12.0) Subgroup 10 n = 676 (12.8) p † Socio-demographic characteristics Gender Male 133 (42.5) 550 (39.5) 122 (34.8) 201 (40.5) 251 (46.5) 165 (46.3) 121 (45.3) 136 (57.1) 242 (38.7) 395 (59.2) <0.001 Female 180 (57.5) 842 (60.5) 229 (65.2) 295 (59.5) 289 (53.5) 191 (53.7) 146 (54.7) 102 (42.9) 384 (61.3) 272 (40.8)
Age (in years) 38.0 (20.0)a 47.0
(24.0)a,b 49.0(25.5)a,c 52.0(27.0)a,b,d 51.5(25.0)a,b,e 60.5(22.0)a,b,c,d,e,f 45.0(21.0)a,d,e,f,g 53.0(24.0)a,b,g,h 57.0(24.0)a,b,c,d,g,i 63.0(18.0)a,b,c,d,e,g,h,i <0.001
Education
High level 243 (78.4) 893 (65.3) 209 (60.6) 251 (51.3) 344 (63.9) 134 (37.6) 128 (50.2) 139 (58.4) 228 (36.1) 235 (35.5) <0.001 Low level 67 (21.6) 474 (34.7) 136 (39.4) 238 (48.7) 194 (36.1) 222 (62.4) 127 (49.8) 99 (41.6) 403 (63.9) 427 (64.5)
Overweight 63 (20.0) 482 (34.4) 148 (41.9) 220 (44.3) 243 (44.6) 170 (47.2) 146 (54.5) 142 (58.4) 377 (59.1) 442 (65.4) <0.001 BMI (kg/m2) 22.3 (4.0)a 23.5 (4.9)a,b 24.0 (5.1)a,c 24.5
(5.4)a,b,d 24.6 (4.9)a,b,e 24.7 (5.3)a,b,f 25.3 (5.2)a,b,c,e,g 25.5 (6.0)a,b,c,d,e 25.8 (6.1)a,b,c,d,e,f,g,h 26.7 (5.5)a,b,c,d,e,f,g,h <0.001 Lifestyle-related behaviors
Tobacco smoke status
No smoker 262 (83.4) 1 189 (85.7) 279 (79.7) 403 (81.9) 0 263 (74.7) 194 (74.3) 0 459 (73.2) 0 <0.001
Former 0 0 0 0 545 (100) 0 0 243 (100) 0 676 (100)
Current 52 (16.6) 198 (14.3) 71 (20.3) 89 (18.1) 0 89 (25.3) 67 (25.7) 0 168 (26.8) 0 Physical activity
Transport-related physical activity (min/d) 26.0 (53.0)a 29.0 (52.0)b 13.0
(40.0)a,b,c 26.0(53.0)c,d 26.0(55.0)c,e (94.0)77.0 a,b,c,d,e,f 9.0(30.0)a,b,d,e,f,g 20.0(51.0)c,f,g,h 19.0 (51.0) b,c,f,g,i
36.0
(93.0)b,c,e,f,g,h,i <0.001
Leisure-time physical activity (min/d) 26.0 (40.0)a 36.0
(39.0)a,b 0 (4.0)a,b,c 26.0 (45.0)b,c,d 26.0 (42.0)b,c,e 86.0 (60.0)a,b,c,d,e,f 0 (4.0)a,b,d,e,f,g 17.0 (53.0)b,c,f,g,h 9.0 (20.0)a,b,c,d,e,f,g,h,i 26.0 (54.0)b,c,d,f,g,i <0.001 Domain-specific sedentary behaviors
Television time (min/d) 0 (13.0)a 94.0
(60.0)a,b 90.0(60.0)a,c 167.0(26.0)a,b,c,d 94.0(60.0)a,d,e 257.0(120.0)a,b,c,d,e,f 94.0(60.0)a,d,f,g 86.5(64.0)a,d,f,h 257.0(120.0)a,b,c,d,e,g,h,i 219.0(120.0)a,b,c,d,e,f,g,i <0.001
Computer time (min/d) 77.0 (136.5)a 91.2 (89.3)a,b 60.0 (90.0)a,c 77.0 (94.0)b,c,d 60.0 (81.0)a,e 129.0 (14.6)a,b,c,d,e,f 77.0 (98.0) b,c,e,f,g 77.0 (73.5)b,c,e,f,h 120.0 (146.0)a,b,c,d,e,g,h 103.0 (120.0)a,b,c,d,e,f,g,h <0.001 Other leisure sitting time (min/d) 77.0
(106.0)a 69.0 (93.0) a
51.0
(90.0)a,b,c 60.0(129.0)c,d 69.0(94.10)c,d,e 94.0(158.5)a,b,c,d,e,f 51.0(120.0)a,b,e,f 60.0 (107.0) f
63.0 (146.0)c,f 60.0 (146.0)b,c,f <0.001 Transport-related sitting time (min/d) 60.0 (76.0)a 60.0 (68.0)b 50.0
(60.0)b,c 60.0 (67.0)c 53.0 (62.0)e 77.0 (103.0)a,b,c,d,e 60.0 (59.0)e,f 60.0 (73.0)c 61.0 (90.0)c,d 93.8 (102.1)b,c,d,f <0.001 Roda et al. Internati onal Journal of Behavioral Nutrition and Physical Activity (2016) 13:114 Page 7 of 12
(5.0)a,b,c,d,e,f,g (4.0)a,b,c,e,f,g,h,i Vegetable intake (times per week) 7.0 (2.0)a 7.0 (1.0)b 7.0 (0)a,b,c 7.0 (2.0)a,c,d 7.0 (1.0)c,e 7.0 (2.0)a,b,c,e,f 5.0
(3.0)a,b,c,d,e,f,g 7.0 (2.0) c,g,h
7.0 (2.0)a,b,c,e,g,h,i 7.0 (2.0)a,b,c,g,i <0.001 Fish intake (times per week) 0.5 (1.5)a 0.5 (1.5)b 0.5 (1.5)c 0.5 (1.5)d 0.5 (1.5)e 0.5 (1.5)f 0.5
(0)a,b,c,d,e,f,g
0.5 (1.5)g 0.5 (1.5)b,f,g 0.5 (1.5)g
<0.001 Fast-food intake (times per week) 0.5 (0) 0.5 (0)a 0.5 (0)b 0.5 (0)c 0.5 (0)d 0.5 (0) 0.5 (0)a,b,c,d 0.5 (0)e 0.5 (0) 0.5 (0)e 0.001 Sweets intake (times per week) 3.0 (5.5) 3.0 (5.5) 3.0 (6.5) 3.0 (4.5) 3.0 (4.5)a 3.0 (5.5) 3.0 (4.5) 3.0 (5.5) 3.0 (4.5)a,b 3.0 (5.5)b 0.038 Sugar-sweetened beverages
consumption (times per week)
0.5 (4.5)a 2.0 (4.5)b 2.0 (6.5)c 2.0 (6.5)a,d 0.5 (3.5)c,d,e 2.0 (6.5)e 2.0 (6.5)a,e,f 2.0 (4.5)f,g 3.0 (6.5)a,b,
d,e,g,h 2.0 (6.5)
h
<0.001 Alcohol consumption (times per week) 2.0 (4.5)a 2.0 (4.5)b 2.0 (4.5)c 2.0 (4.5)d 4.0
(6.5)a,b,c,d,e
2.5 (5.5)d 0.5 (4.5)e,f 4.0 (6.5)a,b,c,d 2.0 (5.5)e,g 3.0 (6.5)a,b,c,d,f
<0.001 Sleep (hours/night) 7.0 (1.0)a 7.0 (1.5)b 7.0 (1.5)c 7.0 (1.5)d 7.5 (1.0)a,b,c,d,e 7.0 (2.0) e,f 7.0 (1.5)e,g 6.0 (0.5)a,b,c,d,e,f,g,h 7.0 (2.0) e,h 7.0 (2.0)e,h <0.001 Environmental factors Urban region Ghent region 62 (19.7) 364 (26.0) 170 (48.2) 150 (30.2) 148 (27.2) 137 (38.1) 71 (26.5) 57 (23.4) 256 (40.1) 236 (34.9) <0.001 Greater Paris 67 (21.3) 231 (16.5) 59 (16.7) 64 (12.9) 86 (15.8) 25 (6.9) 40 (14.9) 42 (17.3) 63 (9.9) 60 (8.9) Greater Budapest 90 (28.6) 219 (15.6) 27 (7.6) 77 (15.5) 95 (17.4) 44 (12.2) 66 (24.6) 50 (20.6) 65 (10.2) 91 (13.4) Randstad 62 (19.6) 393 (28.1) 70 (19.8) 137 (27.5) 153 (28.1) 115 (31.9) 66 (24.6) 62 (25.5) 162 (25.4) 192 (28.4) Greater London 34 (10.8) 193 (13.8) 27 (7.7) 69 (13.9) 63 (11.5) 39 (10.9) 25 (9.4) 32 (13.2) 92 (14.4) 97 (14.4) Neighborhood type HSES/HRD 92 (29.5) 378 (27.3) 86 (24.9) 109 (22.2) 127 (23.4) 86 (24.8) 47 (17.7) 54 (22.3) 142 (22.9) 148 (22.0) <0.001 LSES/HRD 69 (22.1) 305 (22.1) 64 (18.4) 133 (27.0) 114 (21.0) 96 (27.6) 75 (28.3) 50 (20.7) 165 (26.7) 159 (23.6) HSES/LRD 72 (23.1) 381 (27.5) 100 (28.8) 118 (24.0) 154 (28.4) 77 (22.2) 54 (20.4) 71 (29.3) 129 (20.8) 169 (25.1) LSES/LRD 79 (25.3) 319 (23.1) 97 (28.0) 132 (26.8) 148 (27.2) 88 (25.4) 89 (33.6) 67 (27.7) 183 (29.6) 197 (29.3) Residential density neighborhood
Low 151 (48.4) 700 (50.6) 197 (56.8) 250 (50.8) 302 (55.6) 165 (47.5) 143 (54.0) 138 (57.0) 312 (50.4) 366 (54.4) 0.054 High 161 (51.6) 683 (49.4) 150 (43.2) 242 (49.2) 241 (44.4) 182 (52.5) 122 (46.0) 104 (43.0) 307 (49.6) 307 (45.6) SES neighborhood Low 148 (47.4) 624 (45.1) 161 (46.4) 265 (53.9) 262 (48.2) 184 (53.0) 164 (61.9) 117 (48.3) 348 (56.2) 356 (52.9) <0.001 High 164 (52.6) 759 (54.9) 186 (53.6) 227 (46.1) 281 (51.8) 163 (47.0) 101 (38.1) 125 (51.7) 271 (43.8) 317 (47.1) Neighborhood cluster
Green neighb. with LRD 147 (53.1) 752 (62.1) 224 (70.2) 295 (68.6) 307 (63.7) 215 (68.5) 160 (68.7) 128 (62.5) 374 (68.4) 420 (70.1) <0.001
onal Journal of Behavioral Nutrition and Physical Activity (2016) 13:114 Page 8 of 12
Table 2 Profiles of the subgroups identified by recursive partitioning analysis (CART) in the SPOTLIGHT study (Continued)
Neighb. supportive of active mobility 80 (28.8) 325 (26.8) 66 (20.7) 94 (21.9) 127 (26.4) 76 (24.2) 52 (22.3) 55 (26.8) 135 (24.7) 140 (23.4) HRD neighb. with food and
recreational facilities
29 (10.5) 86 (7.1) 9 (2.8) 23 (5.3) 29 (6.0) 17 (5.4) 6 (2.6) 15 (7.3) 26 (4.7) 25 (4.2)
HRD neighb. with low level of aesthetics 21 (7.6) 49 (4.0) 20 (6.3) 18 (4.2) 19 (3.9) 6 (1.9) 15 (6.4) 7 (3.4) 12 (2.2) 14 (2.3)
Abbreviations: BMI body mass index, H- high-, IQR interquartile range, L- low-, neighb. neighborhood, RD residential density, SES socio-economic status †p-value from Chi-square test or Kruskal-Wallis
a-i
: refer to pairwise comparisons (p-value of Dunn’s test with Bonferroni adjustment < 0.05) Boldface indicates statistical significance
Roda et al. Internati onal Journal of Behavioral Nutrition and Physical Activity (2016) 13:114 Page 9 of 12
Former smokers were more likely to be overweight than both current and never smokers. These results are consistent with previous findings [10, 42–44]. Weight gain after quitting smoking has been related to the fact that nicotine acts as an appetite suppressant and quitting may be associated with increased energy intake [45, 46]. The average weight gain is about 4.5 kg, 1 year after quitting [46]. In the NHANES survey, weight gained over 10-years was significantly higher in former smokers compared to current smokers (8.4 kg vs. 3.5 kg, after ad-justment for age, gender, ethnicity, education level) [44]. A recent study has estimated that smoking cessation leads to an average increase of 1.5–1.7 BMI units and that the drop in smoking may explain up to 14 % of the rise in obesity prevalence in recent decades [47]. Weight gain after smoking cessation was less pro-nounced when number of years since smoking cessa-tion increased [43], and negatively associated with socio-economic status [48].
Short sleep duration was found to be associated with an increased risk of overweight. The hypothe-sized underlying mechanisms include thermoregula-tion, hunger hormone regulation changes, and/or an impact on physical activity and sedentary behaviors [49–52]. Short sleep duration was associated with other lifestyle-related behaviors, such as TV or com-puter use [52, 53], a correlation between time spent sleeping, physical activity and sedentary behavior was documented [54]. High leisure time physical activity and intake of vegetables were associated with lower prevalence of overweight. These behaviors—which tend to co-occur—are both well recognized as healthy lifestyle behaviors [55, 56]. Interestingly, some cut-offs found are close to thresholds previously reported and/or recommended guidelines (e.g., 2 h/d watching TV [5, 38], 7–9 h of sleep [57]). In addition, at least one variable from each component of lifestyle (phys-ical activity, sedentary behavior, sleep duration, eating habits, and smoking status) was identified as a correl-ate of overweight. Moreover, subgroups at high-risk of overweight were characterized by at least one un-healthy lifestyle behavior. These findings emphasize how all components of lifestyle are important to con-sider and a combination of unfavorable lifestyle fac-tors may predict overweight in adults.
Lifestyle subgroups identified by CART differed in terms of socio-demographic factors. The subgroup with the highest prevalence of overweight comprised mainly males, older adults and lower educated adults. These findings are in line with previous studies [58, 59]. Indi-viduals with higher educational background may be more informed about the health consequences of their lifestyles and have the resources to take action, leading to healthier lifestyle behaviors [60]. The subgroups
identified also varied across urban regions: 72.2 % of French respondents were in the subgroups with lower overweight prevalence (subgroups 1–6). Looking at differences at neighborhood level, as previously docu-mented [61], some neighborhoods seem more obeso-genic than others, especially low SES and low residential density neighborhoods. Socio-spatial disparities in obes-ity prevalence at census-tract level have been previously documented with lower prevalence in neighborhoods with high median home values [61]. Low SES neighbor-hoods have been shown to have less supportive environ-mental conditions for active transportation [21]. Moreover, a greater percentage of ‘green neighborhoods with low residential density’ was observed in subgroups with high overweight prevalence. Greener neighbor-hoods with low residential density may be less support-ive of actsupport-ive transport and more oriented towards motorized transport. Use of motorized transportation may be linked to weight gain [62]. Conversely, in high residential density neighborhoods, many destinations are easily accessed since located at shorter distance, and parking a car may be more difficult therefore encour-aging active transportation (e.g., walking, cycling, public transport) [21]. Thus, adults living in neighborhoods unsupportive of physical activity and far away from des-tinations may be more likely to remain indoors and watch TV.
This study has several strengths: a relatively large sample size, assessment of a number of lifestyle-related variables using standardized procedures, a sur-vey performed in different geographical areas across Europe, and the use of a nonparametric method (CART) providing a visual representation of lifestyle-related behavior inter-relationships. This study has some limitations, caution is thus needed when inter-preting and generalizing the results. Due to its cross-sectional nature, temporal relations between over-weight and lifestyle behaviors cannot be assessed. As data were self-reported, potential (recall) bias, and possible underestimation or overestimation of vari-ables (e.g., weight/height [63], sedentary behaviors [29, 64], physical activity [64–66]) cannot be ex-cluded. Although behaviors such as eating habits were not recorded in enough detail to assess the role of more detailed dietary aspects, such as macronutrient intake, many aspects of lifestyle currently thought to be associated with body weight were covered (seden-tary behavior, physical activity, eating habits, alcohol consumption, smoking status, and sleep duration). The CART method is data-driven, and the misclassifi-cation error was about 35 %. In the literature, it is not uncommon to report a misclassification error around 30 % and this might be higher for health promotion-based intervention strategies [67].
Conclusions
Low levels of TV viewing, non-smoking, high leisure time physical activity, high vegetable consumption, and longer sleep duration were identified as components of a healthy lifestyle associated with decreased risk of excess weight in adults. The results specifically point to the im-portance of sedentary habits as a key component to focus on when addressing the multiple factors associated with excess weight in preventive interventions.
Abbreviations
BMI:Body mass index; CART: Classification and regression tree; SD: Standard deviation; SES: Socio-economic status; TV: Television
Acknowledgements
The authors would like to thank all participants who took part in the SPOTLIGHT study.
Funding
This work is part of the SPOTLIGHT project funded by the Seventh Framework Programme (CORDIS FP7) of the European Commission, HEALTH (FP7-HEALTH-2011-two-stage), Grant agreement No. 278186. The content of this article reflects only the authors’ views, and the European Commission is not liable for any use that may be made of the information contained therein.
Availability of data and material
The data is not deposited in publicly available repositories due to the rules of the SPOTLIGHT consortium. For more information, please contact Jeroen Lakerveld (je.lakerveld@vumc.nl).
Authors’ contributions
The WP3 SPOTLIGHT group (SC, IDB, JM, JB, JL, HB, KG, HR, HC and JMO) developed the questionnaire, research protocol and conducted the data collection. CR performed the data analysis and drafted the manuscript supervised by JMO. All authors read, provided feedback, and approved the final submitted version of the manuscript.
Competing interests
The authors declare that they have no competing interests.
Consent for publication Not applicable.
Ethics approval and consent to participate
The study was approved by the corresponding local ethics committees of participating countries. In Belgium, the study was approved by the ethics committee of Ghent University Hospital, in France by the Commission Nationale de l'Informatique et des Libertés, in Hungary by the Health Science Council, Scientific Research Ethic Committee, in The Netherlands by the Medical Ethics Committee of the VU University Medical Center in Amsterdam, and in the United Kingdom by The London School of Hygiene & Tropical Medicine Ethics Committee.
All participants in the survey provided informed consent.
Author details
1Équipe de Recherche en Épidémiologie Nutritionnelle (EREN), Université
Paris 13, Centre de Recherche en Épidémiologie et Statistiques, Inserm (U1153), Inra (U1125), Cnam, COMUE Sorbonne Paris Cité, Bobigny F-93017, France.2Université Paris-Est, Lab-Urba, Créteil, France.3Department of
Epidemiology and Biostatistics, EMGO Institute for Health and Care Research, VU University Medical Center, Amsterdam, The Netherlands.4Department of
Movement and Sport Sciences, Faculty of Medicine and Health Sciences, Ghent University, Ghent, Belgium.5ECOHOST– The Centre for Health and
Social Change, London School of Hygiene and Tropical Medicine, London, UK.6Department of Preventive Medicine, Faculty of Public Health, University
of Debrecen, Debrecen, Hungary.7Sorbonne Universités, Université Pierre et Marie Curie, Université Paris 06, Institute of Cardiometabolism and Nutrition, Department of Nutrition, Pitié-Salpêtrière Hospital, Assistance
Publique-Hôpitaux de Paris, Paris, France.
Received: 26 April 2016 Accepted: 19 October 2016
References
1. WHO. Obesity: preventing and managing the global epidemic. Geneva: WHO Technical Report Series 894; 2000. p. 252. Available at: http://www. who.int/nutrition/publications/obesity/WHO_TRS_894/en/. Accessed 10 Mar 2016.
2. Butland B, Jebb S, Kopelman P, McPherson K, Thomas S, Mardell J et al. Foresight, Tackling Obesities: Future Choices, Project Report 2nd Edition, UK Government Office for Science: London; 2007. Available at: http://www. foresight.gov.uk/Obesity/17.pdf. Accessed 10 Mar 2016.
3. Swinburn BA, Sacks G, Hall KD, McPherson K, Finegood DT, Moodie ML, et al. The global obesity pandemic: shaped by global drivers and local environments. Lancet Lond Engl. 2011;378:804–14.
4. Dunton GF, Berrigan D, Ballard-Barbash R, Graubard B, Atienza AA. Joint associations of physical activity and sedentary behaviors with body mass index: results from a time use survey of US adults. Int J Obes (Lond). 2009; 33:1427–36.
5. Hu FB, Li TY, Colditz GA, Willett WC, Manson JE. Television watching and other sedentary behaviors in relation to risk of obesity and type 2 diabetes mellitus in women. JAMA. 2003;289:1785–91.
6. Omorou AY, Coste J, Escalon H, Vuillemin A. Patterns of physical activity and sedentary behaviour in the general population in France: cluster analysis with personal and socioeconomic correlates. J Public Health Oxf Engl. 2016; 38:483–92.
7. Thorp AA, Owen N, Neuhaus M, Dunstan DW. Sedentary behaviors and subsequent health outcomes in adults a systematic review of longitudinal studies, 1996-2011. Am J Prev Med. 2011;41:207–15.
8. Audrain-McGovern J, Benowitz N. Cigarette smoking, nicotine, and body weight. Clin Pharmacol Ther. 2011;90:164–8.
9. Traversy G, Chaput J-P. Alcohol consumption and obesity: an update. Curr Obes Rep. 2015;4:122–30.
10. Dare S, Mackay DF, Pell JP. Relationship between smoking and obesity: a cross-sectional study of 499,504 middle-aged adults in the UK general population. PLoS One. 2015;10:e0123579.
11. Capers PL, Fobian AD, Kaiser KA, Borah R, Allison DB. A systematic review and meta-analysis of randomized controlled trials of the impact of sleep duration on adiposity and components of energy balance. Obes Rev Off J Int Assoc Stud Obes. 2015;16:771–82.
12. Chaput J-P, Lord C, Aubertin-Leheudre M, Dionne IJ, Khalil A, Tremblay A. Is overweight/obesity associated with short sleep duration in older women? Aging Clin Exp Res. 2007;19:290–4.
13. Marshall NS, Glozier N, Grunstein RR. Is sleep duration related to obesity? A critical review of the epidemiological evidence. Sleep Med Rev. 2008;12: 289–98.
14. Kesse-Guyot E, Andreeva VA, Lassale C, Hercberg S, Galan P. Clustering of midlife lifestyle behaviors and subsequent cognitive function: a longitudinal study. Am J Public Health. 2014;104:e170–177.
15. Spring B, Moller AC, Coons MJ. Multiple health behaviours: overview and implications. J Public Health Oxf Engl. 2012;34:i3–10.
16. Charreire H, Casey R, Salze P, Kesse-Guyot E, Simon C, Chaix B, et al. Leisure-time physical activity and sedentary behavior clusters and their associations with overweight in middle-aged French adults. Int J Obes (Lond). 2010;34: 1293–301.
17. Rovniak LS, Sallis JF, Saelens BE, Frank LD, Marshall SJ, Norman GJ, et al. Adults’ physical activity patterns across life domains: cluster analysis with replication. Health Psychol. 2010;29:496–505.
18. Chou K-L. The prevalence and clustering of four major lifestyle risk factors in Hong Kong Chinese older adults. J Aging Health. 2008;20:788–803. 19. de Vries H, Kremers S, Smeets T, Reubsaet A. Clustering of diet, physical
activity and smoking and a general willingness to change. Psychol Health. 2008;23:265–78.
20. Martin-Diener E, Meyer J, Braun J, Tarnutzer S, Faeh D, Rohrmann S, et al. The combined effect on survival of four main behavioural risk factors for non-communicable diseases. Prev Med. 2014;65:148–52.
21. Sallis JF, Floyd MF, Rodríguez DA, Saelens BE. Role of built environments in physical activity, obesity, and cardiovascular disease. Circulation. 2012;125: 729–37.
22. Breiman L, Friedman J, Stone CJ, Olshen RA. Classification and Regression Trees. 1 edition. New-York: Chapman and Hall/CRC; 1984.
23. Van Hulst A, Roy-Gagnon M-H, Gauvin L, Kestens Y, Henderson M, Barnett TA. Identifying risk profiles for childhood obesity using recursive partitioning based on individual, familial, and neighborhood environment factors. Int J Behav Nutr Phys Act. 2015;12:17.
24. Agras WS, Hammer LD, McNicholas F, Kraemer HC. Risk factors for childhood overweight: a prospective study from birth to 9.5 years. J Pediatr. 2004;145:20–5.
25. King AC, Salvo D, Banda JA, Ahn DK, Gill TM, Miller M, et al. An observational study identifying obese subgroups among older adults at increased risk of mobility disability: do perceptions of the neighborhood environment matter? Int J Behav Nutr Phys Act. 2015;12:157.
26. Lakerveld J, Brug J, Bot S, Teixeira PJ, Rutter H, Woodward E, et al. Sustainable prevention of obesity through integrated strategies: The SPOTLIGHT project’s conceptual framework and design. BMC Public Health. 2012;12:793.
27. Lakerveld J, Ben-Rebah M, Mackenbach JD, Compernolle S, Glonti K, Bárdos H, et al. Obesity-related behaviours and BMI in five urban regions across Europe: sampling design and results from the SPOTLIGHT cross-sectional survey. BMJ Open. 2015;5:e008505.
28. Craig CL, Marshall AL, Sjöström M, Bauman AE, Booth ML, Ainsworth BE, et al. International physical activity questionnaire: 12-country reliability and validity. Med Sci Sports Exerc. 2003;35:1381–95.
29. Marshall AL, Miller YD, Burton NW, Brown WJ. Measuring total and domain-specific sitting: a study of reliability and validity. Med Sci Sports Exerc. 2010; 42:1094–102.
30. Feuillet T, Charreire H, Roda C, Ben-Rebah M, Mackenbach JD, Compernolle S, et al. Neighbourhood typology based on virtual audit of environmental obesogenic characteristics. Obes Rev. 2016;17:19–30.
31. Strobl C, Malley J, Tutz G. An introduction to recursive partitioning: rationale, application, and characteristics of classification and regression trees, bagging, and random forests. Psychol Methods. 2009;14:323–48. 32. Kiernan M, Kraemer HC, Winkleby MA, King AC, Taylor CB. Do logistic regression
and signal detection identify different subgroups at risk? Implications for the design of tailored interventions. Psychol Methods. 2001;6:35–48.
33. Izenman AJ. Modern Multivariate Statistical Techniques: Regression, Classification, and Manifold Learning. Springer. New York: Springer; 2008. 34. R Core Team. R : A language and environment for statistical computing. R
Foundation for Statistical Computing, Vienna, Austria. 2016. Available at: www.R-project.org.
35. Therneau TM, Atkinson EJ, Foundation M. An Introduction to Recursive Partitioning Using the RPART Routines. 2015.
36. Santaliestra-Pasías AM, Mouratidou T, Reisch L, Pigeot I, Ahrens W, Mårild S, et al. Clustering of lifestyle behaviours and relation to body composition in European children. The IDEFICS study. Eur J Clin Nutr. 2015;69:811–6. 37. Cameron AJ, Welborn TA, Zimmet PZ, Dunstan DW, Owen N, Salmon J, et al.
Overweight and obesity in Australia: the 1999-2000 Australian Diabetes, Obesity and Lifestyle Study (AusDiab). Med J Aust. 2003;178:427–32. 38. Hsueh M-C, Liao Y, Chang S-H. Are total and domain-specific sedentary time
associated with overweight in older taiwanese adults? Int J Environ Res Public Health. 2015;12:12697–705.
39. King AC, Goldberg JH, Salmon J, Owen N, Dunstan D, Weber D, et al. Identifying subgroups of U.S. adults at risk for prolonged television viewing to inform program development. Am J Prev Med. 2010;38:17–26. 40. Ekelund U, Brage S, Besson H, Sharp S, Wareham NJ. Time spent being
sedentary and weight gain in healthy adults: reverse or bidirectional causality? Am J Clin Nutr. 2008;88:612–7.
41. Bowman SA. Television-viewing characteristics of adults: correlations to eating practices and overweight and health status. Prev Chronic Dis. 2006;3:A38. 42. Basterra-Gortari FJ, Forga L, Bes-Rastrollo M, Toledo E, Martínez JA,
Martínez-González MA. Effect of smoking on body weight: longitudinal analysis of the SUN cohort. Rev Esp Cardiol. 2010;63:20–7.
43. Chen Y, Horne SL, Dosman JA. The influence of smoking cessation on body weight may be temporary. Am J Public Health. 1993;83:1330–2.
44. Williamson DF, Madans J, Anda RF, Kleinman JC, Giovino GA, Byers T. Smoking cessation and severity of weight gain in a national cohort. N Engl J Med. 1991;324:739–45.
45. Veldheer S, Yingst J, Zhu J, Foulds J. Ten-year weight gain in smokers who quit, smokers who continued smoking and never smokers in the United States, NHANES 2003-2012. Int J Obes (Lond). 2015;39:1727–32. 46. Aubin H-J, Rollema H, Svensson TH, Winterer G. Smoking, quitting, and
psychiatric disease: a review. Neurosci Biobehav Rev. 2012;36:271–84.
47. Courtemanche C, Tchernis R, Ukert B. The Effect of Smoking on Obesity: Evidence from a Randomized Trial. NBER Working papers No. 21937. 2016. National Bureau of Economic Research, Inc.
48. Swan GE, Carmelli D. Characteristics associated with excessive weight gain after smoking cessation in men. Am J Public Health. 1995;85:73–7. 49. Patel SR, Blackwell T, Redline S, Ancoli-Israel S, Cauley JA, Hillier TA, et al.
The association between sleep duration and obesity in older adults. Int J Obes (Lond). 2008;32:1825–34.
50. Patel SR, Hu FB. Short sleep duration and weight gain: a systematic review. Obes. 2008;16:643–53. Silver Spring Md.
51. Magee L, Hale L. Longitudinal associations between sleep duration and subsequent weight gain: A systematic review. Sleep Med Rev. 2012;16:231–41. 52. Lakerveld J, Mackenbach JD, Horvath E, Rutters F, Compernolle S, Bárdos H,
et al. The relation between sleep duration and sedentary behaviours in European adults. Obes Rev. 2016;17:62–7.
53. Basner M, Fomberstein KM, Razavi FM, Banks S, William JH, Rosa RR, et al. American time use survey: sleep time and its relationship to waking activities. Sleep. 2007;30:1085–95.
54. Chastin SFM, Palarea-Albaladejo J, Dontje ML, Skelton DA. Combined effects of time spent in physical activity, sedentary behaviors and sleep on obesity and cardio-metabolic health markers: a novel compositional data analysis approach. PLoS One. 2015;10:e0139984.
55. WHO. Global Strategy on Diet, Physical Activity and Health. Geneva; 2004. Available at: http://www.who.int/dietphysicalactivity/strategy/eb11344/ strategy_english_web.pdf. Accessed 10 Mar 2016.
56. Oppert J-M, Thomas F, Charles M-A, Benetos A, Basdevant A, Simon C. Leisure-time and occupational physical activity in relation to cardiovascular risk factors and eating habits in French adults. Public Health Nutr. 2006;9:746–54. 57. Hirshkowitz M, Whiton K, Albert SM, Alessi C, Bruni O, DonCarlos L, et al.
National Sleep Foundation’s sleep time duration recommendations: methodology and results summary. Sleep Health J Natl Sleep Found. 2015;1:40–3.
58. Kanter R, Caballero B. Global gender disparities in obesity: a review. Adv Nutr. 2012;3:491–8.
59. Pampel FC, Krueger PM, Denney JT. Socioeconomic disparities in health behaviors. Annu Rev Sociol. 2010;36:349–70.
60. Compernolle S, Oppert J-M, Mackenbach JD, Lakerveld J, Charreire H, Glonti K, et al. Mediating role of energy-balance related behaviors in the association of neighborhood socio-economic status and residential area density with BMI: The SPOTLIGHT study. Prev Med. 2016;86:84–91. 61. Drewnowski A, Rehm CD, Arterburn D. The geographic distribution of
obesity by census tract among 59 767 insured adults in King County, WA. Int J Obes (Lond). 2014;38:833–9.
62. Qin L, Stolk RP, Corpeleijn E. Motorized transportation, social status, and adiposity: the China Health and Nutrition Survey. Am J Prev Med. 2012;43:1–10. 63. Boström G, Diderichsen F. Socioeconomic differentials in misclassification of
height, weight and body mass index based on questionnaire data. Int J Epidemiol. 1997;26:860–6.
64. Rzewnicki R, Vanden Auweele Y, De Bourdeaudhuij I. Addressing overreporting on the International Physical Activity Questionnaire (IPAQ) telephone survey with a population sample. Public Health Nutr. 2003;6:299–305.
65. Shephard RJ. Limits to the measurement of habitual physical activity by questionnaires. Br J Sports Med. 2003;37:197–206.
66. Winckers ANE, Mackenbach JD, Compernolle S, Nicolaou M, van der Ploeg HP, De Bourdeaudhuij I, et al. Educational differences in the validity of self-reported physical activity. BMC Public Health. 2015;15:1299.
67. BeLue R, Francis LA, Rollins B, Colaco B. One size does not fit all: identifying risk profiles for overweight in adolescent population subsets. J Adolesc Health. 2009;45(5):517–24.