HAL Id: hal-01076615
https://hal.archives-ouvertes.fr/hal-01076615
Submitted on 22 May 2015
HAL is a multi-disciplinary open access
archive for the deposit and dissemination of
sci-entific research documents, whether they are
pub-lished or not. The documents may come from
teaching and research institutions in France or
abroad, or from public or private research centers.
L’archive ouverte pluridisciplinaire HAL, est
destinée au dépôt et à la diffusion de documents
scientifiques de niveau recherche, publiés ou non,
émanant des établissements d’enseignement et de
recherche français ou étrangers, des laboratoires
publics ou privés.
Out-of-equilibrium dynamics of photoexcited spin-state
concentration waves
Andrea Marino, Marylise Buron-Le Cointe, Maciej Lorenc, Loic Toupet,
Robert Henning, A. D. Dichiara, Keith Moffat, Nicolas Brefuel, Eric Collet
To cite this version:
Andrea Marino, Marylise Buron-Le Cointe, Maciej Lorenc, Loic Toupet, Robert Henning, et al..
Out-of-equilibrium dynamics of photoexcited spin-state concentration waves. Faraday Discussions, Royal
Society of Chemistry, 2015, 177, pp.363-379. �10.1039/C4FD00164H�. �hal-01076615�
Out-of-equilibrium dynamics of photoexcited
spin-state concentration waves
A. Marino,
aM. Buron-Le Cointe,
a,*M. Lorenc,
aL. Toupet,
aR. Henning,
bA. D. DiChiara,
cK. Moffat,
bN. Bréfuel,
dand E. Collet,
a,*The spin crossover compound [FeIIH2L2-Me][PF6]2 presents a two-step phase transition. In the intermediate phase, a spin state concentration wave (SSCW) appears resulting from a symmetry breaking (cell doubling) associated with a long-range order of alternating high and low spin molecular states. By combining time-resolved optical and X-ray diffraction measurements on a single crystal, we study how such a system responds to femtosecond laser excitation and we follow in real time the erasing and rewriting of the SSCW.
Introduction
FeII spin-crossover (SCO) complexes have been widely studied over the last decades, because of their ability to show reversible switching between low-spin (LS, S=0) and high-spin (HS, S=2) states, controlled by a change in temperature or pressure and more interestingly under light irradiation. SCO are now considered as prototype photo-switchable molecular materials.[1,2] One of the important successes of ligand field theory was to establish the origin of SCO in the coupling between electronic and structural degrees of freedom. As the electronic configuration changes from t2g6eg0 in the LS state to the less bonding t2g
4 eg
2
in the HS state, an important structural reorganization occurs. It is associated with an expansion of the average distance between the Fe and the 6 N atoms bonding it to the ligand.[1] Typical values are <Fe-N>LS≈2.0 Å and <Fe-N>HS≈2.2 Å.[3,4,5,6,7,8,9,10,11] In the solid state, the coexistence of short- and long-range interactions between molecules yields cooperative effects leading to continuous conversions or first order phase transitions with hysteresis.[1,2,12] The SCO phenomenon can be followed through the evolution of the fraction of HS molecules:
XHS=NHS/N
where NHS is the number of molecules in the HS state among the N molecules of the crystal. This is a totally symmetric order parameter. In many systems, the LS state is the ground state. When temperature is increased, the HS state of higher entropy is favoured, and XHS increases from 0 to 1. It is convenient to monitor the evolution of XHS by using complementary probes sensitive to the electronic state, such as optical spectroscopy,[13] or structural changes such as x-ray diffraction[6]. These probes can also be used in the time domain to follow the HS state conversion, when induced by light excitation. Femtosecond optical and x-ray spectroscopy studies of isolated molecules in solution evidenced that the molecular photo-switching occurs on the sub-picosecond timescale.[14-19] More recently we combined time-resolved x-ray diffraction and optical spectroscopy on weakly cooperative systems to investigate how SCO solids responds to femtosecond (fs) light excitation.[20-25] We have shown that the dynamics induces a multi-step response. First, the
sub-picosecond non-thermal molecular photo-switching occurs, resulting from a local trapping similar to the one observed in solution studies. Then, the molecular swelling and lattice heating induced by light drive lattice expansion within tens of ns. Finally, a thermal switching occurs on the microsecond timescale as the HS state is favoured once the temperature of the macroscopic crystal is higher.
Some SCO compounds, instead of showing a single step conversion, undergo two-step transitions. In addition to the HS and LS phases, an intermediate (INT) phase appears, for which XHS is close to 1/2[9,25] 1/3[26] , 1/4[27] or is irrational [5]. For some compounds, the appearance of the INT phase results from symmetry breaking and a long-range ordering of molecules in HS and LS states. This is the case for the material investigated here: [FeIIH2L
2-Me
][PF6]2 (H2L 2-Me denotes the organic ligand bis[((2-methylimidazol-4-yl)methylidene)-3-aminopropyl] ethylenediamine). [4]
Spin state concentration wave (SSCW)
Magnetic susceptibility measurements on [FeIIH
2L2-Me][PF6]2 [4], give the temperature evolution of the HS fraction XHS, indicating a two-step SCO conversion (Figure 1). Above 250 K, all molecules are in the HS state, and the two molecules of the unit-cell are symmetrically equivalent (one independent crystallographic site). Below 250 K, XHS continuously decreases to reach a pseudo-plateau in the [97 K-142 K] domain. In this INT phase, approximately 50% of the molecules are in LS and HS states. X-ray diffraction data revealed the occurrence of symmetry breaking in this INT phase. It corresponds to a doubling of the crystalline c axis, characterized by the appearance of additional Bragg reflections. In the doubled cell, there are now two crystallographically independent molecular sites (Figure 1 & 2). X-ray diffraction data at 130K [4] show that site 1 is mainly HS, as characterized by <Fe1-N>=2.145(5) Å, and site 2 is mainly LS with <Fe2-N>= 2.055(5) Å. The fact that the sites are not completely HS or LS, i.e. <Fe1-N> is different from <Fe-N>HS=2.190 Å and <Fe2-N> is different from <Fe-N>LS=2.012 Å, results from the partial spin-state ordering.[4,5,9]
Figure 1. (top) Structure of the INT phase at 110 K made of two independent sites around Fe1 and Fe2. Only the two symmetry
independent sites are shown for clarity. Above 142 K Fe1 and Fe2 are
equivalent by translation c, but not in the INT phase because of the cell doubling with c'=2c. (bottom) Evolution of the HS fraction (right axis) deduced from magnetic measurements (solid line) and x-ray diffraction (blue circles) through the <Fe-N> bond length (left axis) on site Fe1
(red triangle) and Fe2 (blue triangle) given in ref [4].
The x-ray diffraction data and this partial order can be well described in the framework of the Landau theory of phase transitions [28]. This theory postulates that any density ρ in the low symmetry phase can be described as made of two components ρ0 and δρ. In the HS phase, any density ρ0 belongs to the totally symmetric transformations of the high symmetry crystal. In particular, the spin state concentration (or density) XHS(r) is the same for every molecular sites in position r, which are all equivalent by applying the symmetry operators of the HS space group and especially the translation symmetry c:
XHS(r)= XHS(r+nc)=XHS, n ∈ |N
In the high-temperature/high-symmetry phase the different molecular sites along r//c have the same probability to be in the HS state. The scheme in figure 2c shows that XHS(r) ≈0.5 at 142 K, whereas XHS(r) ≈ 1 above 250 K. In the INT phase of lower symmetry, the density starts to change and becomes ρ = ρ0 + ηδρ. δρ has the symmetry of the INT phase, which is lower than that of ρ0 because of the cell doubling along c. Therefore ρ = ρ0 + ηδρ describes any density with the symmetry of the INT phase (and the new periodicity c'=2c), and so does XHS(r) in the INT phase. η is the symmetry breaking order parameter measuring the deviation of the INT phase from the high symmetry phase. In the doubled cell, there are two symmetry-independent molecular sites alternating along c' and now
XHS(r)= XHS(r+c') = XHS(r+2nc) ≠ XHS(r+(2n+1)c) The INT phase can then be simply described as a spatial modulation of the probability for a site in position r to be in the HS state:
XHS(r)=XHS+η×cos(q.r),
where XHS is the average HS fraction in the crystal (XHS≈0.5 on the plateau, Figure 1), q is the wave vector corresponding to a cell doubling along the c axis (q=c*/2=c'*) and the order parameter η measures the amplitude of the wave. As schematically represented in Figure 2a, the spin-state ordering corresponds to a spin-state concentration wave (SSCW), which forms on the plateau around an average value. Figure 2a depicts XHS(r) on the lattice sites, with a colour code indicating that sites are mainly HS (red) when XHS(r) is above 0.5, or mainly LS (blue) below. There are 4 molecules per unit cell in the INT phase but only 2 symmetry independent sites (two sites 1 and two sites 2). These are equivalent in the high symmetry phase by the translation c. That is the reason why the sequence of sites 1122 along
c
corresponds to HS-HS-LS-LS order (Fig. 2a). It is possible to describe the evolution of XHS and η from the x-ray diffraction data. The <Fe-N> bond is a well-known marker of the HS fraction [29] as XHS weights the contribution of HS and LS molecules in the observed value of <Fe-N>:<Fe-N>=XHS<Fe-N>HS + (1−XHS)<Fe-N>LS
with <Fe-N>HS=2.190 Å and <Fe-N>LS=2.012 Å (Fig. 1). This is also true for the independent molecular sites 1 and 2 in the INT phase with local HS fractions XHS1 and XHS2:
<Fe1-N>=XHS1<Fe-N>HS + (1−XHS1)<Fe-N>LS <Fe2-N>=XHS2<Fe-N>HS + (1−XHS2)<Fe-N>LS
Since at 130 K <Fe1-N>=2.145(5) Å and <Fe2-N>= 2.055(5) Å, we can estimate XHS1(130K)=0.75 and XHS2(130K)=0.25 (Fig. 1). This gives the two order parameters describing the wave at 130 K:
XHS=(XHS1+XHS2)/2=0.5 and η= (XHS1−XHS2)/2=0.25 The spin-state concentration wave at 130 K is therefore defined by:
XHS(r)=0.5+0.25×cos(q.r).
It is shown in Figure 1 that <Fe1-N> and <Fe2-N> evolve with temperature and become equal at 142 K, where the symmetry breaking disappears, i.e. where the two sites become symmetry equivalent. Above 142 K the symmetry imposes XHS1=XHS2. The structure of the unit in the INT phase (with a lattice parameter c'=2c) contains two independent molecular sites shifted by c=c'/2. The structure factor is then the sum of the contribution of each sites:
F(hkl)=F1(hkl)+F2(hkl).
For site 1, the molecule can be in the HS state, with a probability XHS1 and corresponding to a HS molecular structure factor FHS, or in the LS state with a probability (1−XHS1) and corresponding to a structure factor FLS. The structure factor on site 1 is then:
For site 2, the molecule can also be in the HS state with a probability XHS2 and corresponding to a structure factor FHS2 or to a molecule in the LS state with a probability (1−XHS2) and corresponding to a structure factor FLS2. But since the atoms in site 2 are shifted in space in the unit cell by c=c'/2 with respect to site 1, a phase term appears in FHS2 and FLS2 for all atoms, with respect to FHS and FLS on site 1
FHS2 =FHSe−iπl and FLS2=FLSe−iπl For l=2p+1 (odd), e−iπl = −1, one obtains
F2(hk 2p+1) = XHS2×FHS2+(1−XHS2)×FLS2 = −XHS2×FHS − (1−XHS2)×FLS
and
F(h k 2p+1)=F1(h k 2p+1)+F2(h k 2p+1)
= XHS1×FHS + (1−XHS1)×FLS− XHS2×FHS − (1− XHS2)×FLS
Since the concentration wave has an amplitude η around an average value XHS:
XHS1=XHS+η, (1−XHS1)=1−XHS−η, XHS2=XHS−η, (1−XHS2)=1−XHS+η Then for Bragg peaks (h k l) with l odd:
F(h k 2p+1) = (XHS+η)×FHS+(1−XHS−η)×FLS
− (XHS−η)×FHS− (1−XHS+η)×FLS
F(h k 2p+1)=(2η)×FHS + (−2η)×FLS
=
(2η)×(FHS − FLS), and I(h k 2p+1)µη2×|FHS − FLS|2In other words, the intensity of the Bragg reflections indexed as (h k 2p+1) in the c'=2c cell, which characterize the spin-state ordering between molecular sites 1 and 2, is proportional to the square of the order parameter η measuring the amplitude of the wave. The intensity of these peaks I(h k 2p+1)=0 when η=0. Figure 2d, shows the evolution of the intensity of such Bragg peaks, which vanishes at 142 K and characterizes the temperature above which the spin-state concentration wave, SSCW, is erased and the high symmetry phase is reached. These data also show that the order rapidly saturates below 135 K as I(h k 2p+1) remains constant. This is also in agreement with Figure 1, showing a ≈0.1Å difference between <Fe1-N> and <Fe2-N> below 135 K, whereas the difference also vanishes at 142 K. When temperature is decreased below 90 K, the compound completely switches to the LS state and the spin concentration wave disappears. Finally, the lattice parameters are also sensitive to the thermal spin conversion, especially the parameter a (Fig. 2e). The expansion arises from continuous conversion from INT to HS phases. In the 100-250 K range, the thermal expansion is nearly linear, with a slope of 0.0015 Å/K. These results differ from those obtained on the derivative compound with a SbF6 counter anion, for which a SSCW forms
with a periodicity incommensurate with the one of the lattice. [5] It remains at low temperature and can be erased by light below 40 K, as the photoinduced HS state is stable. The erasing of the SSCW was due to the complete conversion to the HS state, indicated by the disappearance of characteristic satellites reflections and the change of <Fe-N>.
The spin-state concentration wave being so characterized, we now discuss how it responds in the time domain to femtosecond light excitation.
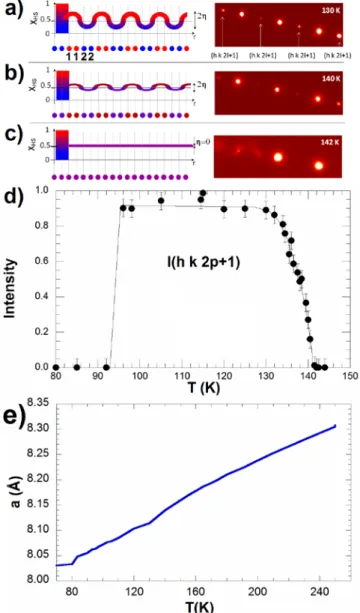
Figure 2. a) Spin-state concentration wave among molecular sites 1 and 2 schematically represented by XHS(r)=XHS+η×cos(q.r) on the plateau
where XHS≈0.5. The periodicity of the modulation is 2c, where c is the
distance between sites 1 and 2 which are symmetry equivalent at high temperature in the high symmetry phase. The spin-state concentration wave gives rise to diffracted intensity in the Bragg peaks indexed (h k 2p+1) in the doubled cell (right). Below 135 K, the order is maximum with a strong diffracted intensity I(h k 2p+1) on superstructure peaks. b) At 140 K the diffracted intensity I(h k 2p+1)µη2 is ≈25% of the saturated value, where η=0.25, indicating η≈0.125 at 140 K. Above 142K I(h k 2p+1)=0 indicating η=0. d) temperature dependence of the Bragg peaks characterizing the spin-state concentration wave. e) Thermal expansion of the lattice parameter a.
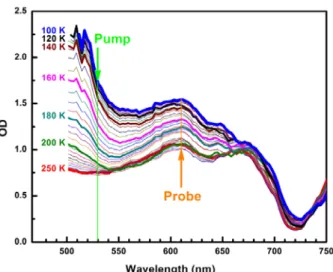
Figure 3. Temperature dependence of optical density measured on a single crystal, revealing the MLCT band of the LS state around 500 nm. For time-resolved studies, the pump was set to 530 nm and the probe to 610 nm.
Results
Optical pump-probe studies
First, we performed ultrafast optical pump-probe measurements to study the photo-switching dynamics of [FeIIH2L2-Me][PF6]2 in the INT phase where the SSCW forms. We used the femtosecond pump-probe set-up at IPR in Rennes. The effects of temperature and excitation density on the time course of XHS were investigated. Details are given in the experimental section. Figure 3 shows how optical density (OD), measured on a single crystal, changes in the visible range as the SCO occurs from INT to HS phases. The characteristic Metal-to-Ligand Charge-Transfer (MLCT) band of the LS state appears around 500 nm in the INT phase. We photoexcited the system in the tail of this band at 530 nm to ensure a larger penetration depth and an efficient photo-switching from LS to HS states as observed under continuous light irradiation at 10 K [4,5]. A global decrease of OD in the visible range is observed when temperature increases and LS to HS conversion occurs. We used OD change (probe at 610 nm) to monitor the evolution of XHS after fs laser excitation, as successfully performed in other SCO solids [20-24]. Typical results are presented in Figures 4a and 4b. Experiments were performed at different excitation energies at 135 K, where the SSCW is ordered, and 142 K, where it disappears.
We observe a 3-step process, similar to the one reported for the out-of-equilibrium spin-state switching induced by fs laser excitation in other single-step spin-crossover crystals [20-24]. First, the absorption of light at the molecular level locally photo-switches a small fraction ∆XHShν of molecules from LS to HS state. The inset of Fig. 4b shows the evolution of optical density, ∆OD, following fs laser excitation. The transient peak, which appears immediately after excitation is associated with the MLCT state, whereas the decrease of OD onto a plateau
within hundreds of fs is the optical fingerprint of the formation of HS state. This step is referred to as the photo-switching step. Since a low excitation density was used, a small fraction of LS molecules was photo-switched to the HS state. From the OD change shown in the inset, it is estimated that 0.2% of the
Figure 4. Time evolution of the photo-excited fraction of HS molecules at 142 K (a) and 135 K (b) for different pump energy, revealing the 3 steps of photoinduced (∆XHShν), elastic (∆XHSEl) and thermal (∆XHSTh) nature. The
inset in (b) shows the OD change during the photo-switching: the transient peak is due to MLCT state and the decrease to HS state. (c) shows the evolution of the photoinduced and thermal steps with the pump energy.
Figure 5. (a) Time evolution of the photo-excited fraction of HS molecules for 0.7 µJ pump energy for different temperature. (b) Evolution of the thermal step with temperature and model used for describing the thermal response (solid line).
molecules switch from LS to HS state at the ps timescale. Higher excitation density resulted in sample damage.
The responses at 135 and 142 K show similar features and in particular, a linear dependence of the fraction of photo-switched molecules ∆XHShν with the excitation energy per pump pulse (Fig. 4c). This linear response to excitation density was already reported for cooperative FeIII SCO material [14], and underlined the local nature of this step. The fraction of HS molecules increases anew after tens of ns as lattice expansion occurs (discussed below under time-resolved diffraction) and reaches ∆XHSEl. Previous studies indicated that an internal pressure drives lattice expansion [20-24]. Finally, the thermal step occurs resulting from macroscopic crystal heating by the laser flash, which gives rise to a thermal population of the HS state ∆XHSTh on the µs timescale. We observe in Fig. 4c at 135 K, where the SSCW forms, a change of thermal regime: below 0.8µJ the thermal population ∆XHSTh is moderate, whereas it increases above that energy. At 142 K the change of regime occurs around 0.4µJ. In order to clarify the origin of this effect, we studied the response to fs laser excitation at different temperatures with a fixed pump energy of 0.7 µJ/pulse. The
data shown in Fig. 5 clearly indicate that the thermal population is maximal around 150 K and moderate around 135 K.
As explained in detail in [21], this thermal population can be described as resulting from a temperature jump ∆T of the crystal due to laser excitation. It depends on the absorbed optical energy and therefore of XLS the initial fraction of molecules in the LS state at a given temperature T, which is the absorbing species. The optical energy absorbed by the crystal is redistributed over phonons and the corresponding heat causes a temperature increase ∆T over the macroscopic length scale of the crystal. This occurs on the µs time scale and is limited by heat diffusivity. After this global heating, the HS fraction reaches a transient equilibrium value XHS(T+∆T). Then when the temperature jump is small, ∆XHSTh=∆T×dXHS(T)/dT. Since the optical density at 530 nm, describing optical absorption, is around 4 times higher for the LS species (fraction 1−XHS(T)) than for the HS (fraction XHS(T)) species, the absorbed optical energy is:
Ea(T) µ ∆T(T) µ XLS + 1/4XHS = 1−0.75XHS(T)
Then we can calculate how the thermal population of the HS state ∆XHSTh changes with temperature from the temperature dependence of XHS provided in Fig. 1:
∆XHSTh = [1−0.75XHS(T)]×dXHS(T)/dT
This curve shown in Fig. 5 reproduces well the maximum of thermal population around 150 K, where the slope of the thermal evolution of XHS(T) is maximum (Fig. 1). It also indicates that the thermal effect is minimum around 135 K for an excitation pump energy of 0.7µJ, where the thermal population is negligible and smaller than 1%. Both the data at 135 K for different pump energies and the data at 0.7 µJ for different temperatures indicate that thermal effects are small for a pump energy of 0.7µJ at 135 K, where the SSCW is formed. We use these experimental conditions to study the response of the SSCW to fs laser excitation by using time-resolved x-ray diffraction.
Time-resolved diffraction studies
Time-resolved diffraction studies were performed at the BioCARS beamline at the Advanced Photon Source, Argonne National Laboratory. The optical pump laser beam was similar to the one used for optical measurements in terms of pump wavelength (530 nm), laser spot size (300 µm) and pump energy (0.7 µJ). Figure 6a shows how XHS obtained by optical spectroscopy changes in time, with a negligible thermal population of HS state (<1%). X-ray diffraction experiments reveal a multi-step expansion of the lattice parameter a (quite sensitive to the spin-state conversion). Just after laser excitation, there is no change of the lattice parameter (Fig. 6b) and a first expansion is only observed after few ns, corresponding to the so-called elastic step [21-24]. It results from an
Figure 6. Time dependence of XHS obtained by optical studies (a), of
the lattice parameters a (b), and of the intensity of Bragg peaks characterizing the presence of the SSCW (c and d). Data are shown on a log scale for positive time delays.
internal pressure induced by the larger volume of the photoswitched molecules and by the lattice heating. A second and larger expansion is observed with a maximum 200 µs after laser excitation, when other molecules thermally populate the HS state.
These data correlate quite well with the optical data presented in Fig. 4 and with previous reports on other single-step spin-crossover materials [20-24]. What is new in the present compound is the symmetry breaking aspect associated with the formation of the SSCW, which can be probed by following the time course of the characteristic Bragg reflections indexed (h k 2p+1) in the doubled cell. Fig 6c shows the typical response of such Bragg peaks. Just after laser excitation, the intensity of some peaks decreases e.g. for the (2 5 5) peak or increases e.g. for the (1 4 7) peak.
On longer timescales, the intensity of all the Bragg peaks indexed as (h k 2p+1) monotonically decreases and approaches 0 within 1.5 ms. Fig. 7 show the evolution of the diffracted intensity in the (3 k l) reciprocal plane 6 ns before and 1.5 ms after laser excitation. The decrease of intensity of the Bragg reflections down to ≈20 % is similar for all the Bragg peaks indexed (h k 2p+1), as observed in Fig. 7 for the (3 k 3) Bragg peaks. The intensity then recovers its initial value within 15 ms as shown in Fig. 8 on a linear timescale; so does the lattice parameter a.
From the crystal structures obtained by time-resolved x-ray diffraction, we could also extract the evolution of the order parameters XHS from the time evolution of the <Fe1-N> and
Figure 7. (top) Diffracted intensity in the reciprocal (3 k l) plane indexed in the doubled cell, showing the decrease of (3 k 2p+1) Bragg peaks before (−6 ns) and 1.5 ms after laser excitation. (bottom) Slice of the diffracted intensity along (3 k 3).
<Fe2-N> bond lengths and η from their difference, in a similar way to that explained above for characterizing the SSCW at thermal equilibrium. Data shown in Fig. 9 indicate that XHS does not change significantly during the out-of-equilibrium dynamics (in agreement with optical data), whereas η decreases by a factor ≈2 around 1 ms in agreement with the decrease down to ≈20% of I(h k 2p+1) Bragg peaks.
Discussion
Combined time-resolved optical spectroscopy and x-ray diffraction studies provide an overview of the out-of-equilibrium dynamics of SSCW. During the three steps associated with the out-of-equilibrium dynamics in the solid state, there are a few differences compared to the response of single-step materials.
On the photoswitching step, we could only photoswitch a small fraction ∆XHShν≈0.2% of the molecules. This is too small to erase the wave: as the initial fraction of HS molecules on site 2
Figure 8. Recovery of the lattice parameters a, and of the intensity of the (2 5 5) Bragg peaks characterizing the presence of the SSCW.
is 25%, light cannot bring this value up-to 0.75 to make it equal to the fraction on site 1, which would erase the wave. The number of photons required in a fs pulse would simply destroy the sample. This is however possible in some materials [5] with cw light at low temperature, since the photoinduced HS state is long-lived.
However, some molecules absorb optical energy and switch from LS to HS states and this is enough to drive lattice expansion as an internal pressure appears after photo-excitation. As molecules have to rearrange in this step, the structure factor is slightly modified: the intensity of some (h k 2p+1) peaks increases, whereas for others it decreases (Fig. 5).
Then, as the lattice warms up, the temperature increases and the HS/LS equilibrium is shifted and an additional fraction of molecules reach the HS state. But again, this fraction of thermally populated HS state is small with ∆XHSTh < 0.005. It is possible to estimate the temperature jump of the crystal by comparing the 0.01 Å expansion of the lattice parameter a (Fig. 5b) to the thermal expansion coefficient of 0.0015 Å/K observed in Fig. 2e. We estimate then the temperature jump ∆T to be in the 5-7 K range, which should bring the crystal from the initial 135 K to a transient temperature close to 142 K within hundreds of µs. Indeed, in this temperature interval the average HS fraction XHS remains almost constant at thermal equilibrium. But at 142 K, the SSCW is erased. We indeed observe in Figs. 6 and 7 through the vanishing of the I(h k 2p+1) peak intensities that the SSCW almost disappears within 1.5 ms. The intensity decreases down to 15% of the initial value corresponds to a decrease of η by a factor larger than 2. This is in agreement with the value estimated from the bond length difference between sites 1 and 2 shown in Fig. 9. From these experimental results, we can conclude that it takes time to destroy the long-range order of the SSCW. Erasing the SSCW means that each molecular site needs to reach the same new equilibrium value of XHS. Therefore we can conclude that the typical timescale for the system to explore different HS/LS configurations and to reach thermal equilibrium is in the 100µs-1ms range. Finally, as the crystal cools down by heat exchange
Figure 9. Evolution of the order parameters XHS and η obtained by
time-resolved x-ray diffraction
with the cryostat, the initial 135 K temperature is regained. The lattice parameter relaxes to its initial value as observed on single step SCO compounds [24], and the SSCW reappears on the 15 ms timescale.
Conclusion
In addition to providing molecular movies, time-resolved diffraction is a powerful tool for investigating symmetry breaking aspects of photoinduced phase transitions and out-of-equilibrium thermodynamics.
Our study reveals that the photo-switching step alone cannot erase the SSCW by promoting 50% of the molecules from LS to HS: this requires an excitation density well above the sample damage. It is only in the transient thermal equilibrium, reached with a moderate temperature jump only slightly increasing the average HS fraction, that the spin state concentration wave can be erased. It requires the system to explore different HS/LS configurations, so that XHS reaches the same value on the different crystalline sites.
Experimental
Experiments were performed on single crystals with typical dimensions of (250 ± 50) × (200 ± 50) × (30 ± 5) µm3. Crystals were cooled with a
liquid nitrogen cryostream. The optical pump-probe experiments were configured in transmission geometry with quasi-collinear configuration. We used the set-up described in [21], combining a mechanical translation stage to adjust the optical path difference for sub-ns measurements and the synchronization of two femtosecond amplifiers for 10 ns to ms delays. The pump wavelength was set to 532 nm on the MLCT band where it efficiently induces LS-to-HS conversion of the [FeIIH2L2-Me] cation [4,5]. To excite the crystal, we used energies per pump pulse in the 0.1-1.4 µJ range focussed in a 300 µm spot, which corresponds to excitation
fluences in the 1-16 µJ/mm2 range. The probe was set 610 nm to monitor
the LS-to-HS photoswitching dynamics through the variation of OD, and from which XHS was extracted (see also refs. [14,21]). Time-resolved
X-ray diffraction experiments were performed at the BioCARS beamline at the APS synchrotron [30], where individual X-ray pulses were selected by a fast chopper. X-ray diffraction data were collected at 15 keV with a MAR-CCD detector and varying delays dt between the laser pump and the X-ray probe. For measuring the time dependence of the lattice parameters and diffracted intensity, we performed partial data collection. At each time delay, we collected 60 frames each with a 10 s exposure, at 1° steps of the diffractometer ϕ axis. We used a typical pump excitation density of 10 µJ/mm2. The unit cell parameters and data reduction were
obtained with CrysAlis software [31].
Notes and references
a Institut de physique de Rennes, UMR 6251 Université Rennes 1-CNRS,
35042 Rennes, FRANCE. E-mail: marylise.buron@univ-rennes1.fr, E-mail: eric.collet@univ-rennes1.fr
b Center for Advanced Radiation Sources, The University of Chicago,
Chicago, IL 60637, USA.
c Argonne National Laboratory, 9700 S. Cass Av. Argonne, IL
60439-4857, USA.
d OMNT, CEA-CNRS, Campus Minatec, 38053 Grenoble, FRANCE
This work was supported by the CNRS and Région Bretagne (PhD support of A.M.), the Institut Universitaire de France, Rennes Métropole, the ANR (ANR-13-BS04-0002) and Europe (FEDER). BioCARS is funded by NIH grant R24 GM111072 to K.M. K.M. and E.C. thank the University of Chicago for funding through the “France and Chicago Collaborating in the Sciences” (FACCTS) program. This research used resources of the Advanced Photon Source, a U.S. Department of Energy (DOE) Office of Science User Facility operated for the DOE Office of Science by Argonne National Laboratory under Contract No. DE-AC02-06CH11357.
1 A. Bousseksou, G. Molnar, L. Salmon, W. Nicolazzi, Chem. Soc.
Rev, 2011, 40, 3313.
2 Spin-Crossover Materials: Properties and Applications (Ed. M. A. Halcrow), John Wiley & Sons, 2013.
3 P. Guionneau, M.Marchivie, G. Bravic, J.-F. Létard, D. Chasseau,
Top. Curr. Chem., 2004, 234, 97–28.
4 N. Bréfuel, H. Watanabe, L. Toupet, J. Come, M. Kojima, N. Matsumoto, E. Collet, K. Tanaka, J.P. Tuchagues, Ang. Chem. Int.
Ed, 2009, 48, 9304
5 E. Collet, H. Watanabe, N. Bréfuel, L. Palatinus, L. Roudaut, L. Toupet, K. Tanaka, J.-P. Tuchagues, P. Fertey, S. Ravy, B. Toudic, H. Cailleau, Phys. Rev. Lett., 2012, 109, 257206.
6 E. Collet, M.L. Boillot, J. Hebert, N. Moisan, M. Servol, M. Lorenc, L. Toupet, M. Buron-Le Cointe, A. Tissot, J. Sainton, Acta Cryst. B, 2009, 65, 474.
7 J. Kusz, M. Zubko, A. Fitch and P.Gütlich, Z. Kristallogr., 2011, 226, 576 – 584
8 S. Pillet, V. Legrand, M. Souhassou and C. Lecomte, Phys. Rev. B, 2006, 74, 140101.
9 D. Chernyshov, M. Hostettler, K. W. Törnroos and H.-B. Bürgi,
Angew. Chem. Int. Ed., 2003, 42, 3825 – 3830.
10 M. Yamada, M. Ooidemizu, Y. Ikuta, S. Osa, N. Matsumoto, S. Iijima, M. Kojima, F. Dahan, and J.P. Tuchagues, Inorg. Chem., 2003, 42, 8406 – 8416.
11 M. Marchivie, P. Guionneau,, J. A. K. Howard, G. Chastanet, J.-F. Létard, A. E. Goeta and D. Chasseau, J. Am. Chem. Soc., 2002, 124, 194 – 195.
12 M. Buron-Le Cointe, J. Hébert, C. Baldé, N. Moisan, L. Toupet, P. Guionneau, J.-F. Létard, E. Freysz, H. Cailleau and E. Collet, Phys.
Rev. B, 2012, 85, 064114.
13 A. Goujon, F. Varret, K. Boukheddaden, C. Chong, J Jeftic, Y. Garcia, A. D. Naik, J.C. Ameline and E. Collet. Inorg. Chim. Acta, 2008, 361, 4055-4064.
14 R. Bertoni, M. Lorenc, A. Tissot, M.-L. Boillot and E. Collet, Coord. Chem. Rev., 2015, 282-283, 66-76.
15 R. Bertoni, M. Lorenc, A. Tissot, M. Servol, M.-L. Boillot and E. Collet, Ang. Chem. Int. Ed, 2012, 51, 7485 –7489.
16 A. Marino, P. Chakraborty, M. Servol, M. Lorenc, E. Collet, A. Hauser, Ang. Chem. Int. Ed, 2014, 53, 3863-3867.
17 A. Marino, M. Servol, R. Bertoni, M. Lorenc, C. Mauriac, J.-F. Létard, E. Collet, Polyhedron, 2013, 66, 123-128
18 H.T. Lemke, C. Bressler, L.X Chen, D.M. Fritz, K.J. Gaffney, A. Galler, W. Gawelda, K. Haldrup, R.W. Hartsock, H. Ihee, J. Kim, K.H. Kim, J.H Lee, M.M. Nielsen, A.B. Stickrath, W. Zhang, D. Zhu and M. Cammarata, J. Phys. Chem. A, 2013, 117, 735.
19 C. Bressler, C. Milne, V. T. Pham, A. El Nahhas, R.M. van der Veen, W. Gawelda, S. Johnson, P. Beaud, D. Grolimund, M. Kaiser, C. Borca, G. Ingold, R. Abela and M. Chergui, Science, 2009, 323, 489. 20 M. Cammarata, R. Bertoni, M. Lorenc, H. Cailleau, S. Di Matteo, C.
Mauriac, S.F. Matar, H. Lemke, M. Chollet, S. Ravy, C. Lauhlé, J.-F. Létard, E. Collet, Phys. Rev. Lett., 2014, 113, 227402.
21 M. Lorenc, C. Balde, W. Kaszub, A. Tissot, N. Moisan, M. Servol, M. Buron-Le Cointe, H. Cailleau, P. Chasle, P. Czarnecki, M. L. Boillot and E. Collet, Phys. Rev. B., 2012, 85, 054302.
22 H. Cailleau, M. Lorenc, L. Guérin, M. Servol, E. Collet and M. Buron-Le Cointe, Acta Cryst. A, 2010, 66, 189.
23 E. Collet, M. Lorenc, M. Cammarata, L. Guérin, M. Servol, A. Tissot, M.L. Boillot, H. Cailleau and M. Buron-Le Cointe, Chem.
Eur. J., 2012, 18, 2051.
24 E. Collet, N. Moisan, C. Baldé, R. Bertoni, E. Trzop, C. Laulhé, M. Lorenc, M. Servol, H. Cailleau, A. Tissot, M.L. Boillot, T. Graber, R. Henning, P. Coppens and M. Buron-Le Cointe, Phys. Chem. Chem.
Phys., 2012, 14, 6192.
25 S. M. Neville, B. A. Leita, G. J. Halder, C. J. Kepert, B. Moubaraki, J.-F. Létard and, K. S. Murray, Chem. Eur. J., 2008, 14, 10123– 10133.
26 S. Pillet, E.-E. Bendeif, S. Bonnet, H.J. Shepherd and P. Guionneau,
Phys. Rev. B, 2012, 86, 064106
27 K.D. Murnaghan, C. Carbonera, L. Toupet, M. Griffin, M.M. Ditru, C. Desplanches, Y. Garcia, E. Collet, J.F. Létard, G. Morgan, Chem.
Eur. J., 2014, 20, 5613-5618
28 L. Landau, Ukr. J. Phys., 2008, 53, 25-35; L. Landau, Zh. Eksp. Teor.
Fiz., 1937, 7, 19–32.
29 P. Guionneau and E. Collet, Piezo- and Photo-Crystallography
Applied to Spin-Crossover Materials, in Spin-Crossover Materials: Properties and Applications, ed. M. A. Halcrow, John Wiley & Sons
30 T. Graber, P. Anfinrud, H. Brewer, Y-S Chen, H-S Cho, N. Dashdorj, R.W. Henning, I. Kosheleva, G. Macha, M. Meron, R. Pahl, Z. Ren, S. Ruan, F. Schotte, V. Šrajer, P.J. Viccaro, F. Westferro and K. Moffat, J. Synchrotron Rad., 2011, 18 658-670.
31 CrysAlis RED, Version 1.171.26. Oxford Diffraction Ltd, Abingdon, Oxfordshire, England.