Design for Surprise and
dea Gene
by
Geoff T. Tsai
S.B. Mechanical Engineering
Massachusetts Institute of Technology, 2009
MASSACHUSETTS INSTITUTE
OF TECHNOLOGY
JUL 29 2011
I
ARCHIVES
Submitted to the Department of Mechanical Engineering in partial fulfillment of the requirements for the degree of
Master of Science in Mechanical Engineering at the
Massachusetts Institute of Technology June 2011
@ Massachusetts Institute of Technology 2011. All rights reserved.
A
Author Geoff T. Tsai
Department of Mechanical Engineering May 12,2011
Certified by Maria C. Yang
Assistant Professor of Mechanical Engineering & Engineering Systems Thesis Supervisor
7)07)
Accepted by David E. Hardt
Professor of Mechanical Engineering Chairman, Department Committee on Graduate Studies
ration Methods
Design for Surprise and
Idea Generation Methods
by
Geoff T. Tsai
Submitted to the Department of Mechanical Engineering on
May 12, 2011, in partial fulfillment of the requirements for the degree Master of Science in Mechanical Engineering
Abstract
This thesis explores the meaning of surprise in product design and how surprise can be created in the early phase of the design process, specifically during ideation. In product and service markets with multiple competitors and where product differentiation is difficult, surprise, if used correctly, can be an indispensable differentiator-creating emotional attachment and fostering brand loyalty. A two-part experiment tests three different idea generation methods-brainstorming, multiple perspectives, and counter
attributes (a new method proposed in this thesis)-and how ideation
sketches from these methods are rated by workers on Amazon's Mechanical Turk. Findings reveal that counter attributes may be less effective at
generating surprising ideas. Brainstorming and multiple perspectives perform similarly to each other, but small differences in the structure of an idea generation method may either inhibit or encourage creativity and surprise. The findings also reveal that how clearly an idea is expressed in a sketch greatly influences the variance for how it will be rated upon review.
Thesis Supervisor: Maria C. Yang
Acknowledgements
I wish to thank my advisor, Professor Maria Yang, for providing me with this incredible research opportunity. Over the past two years she has been unfailingly supportive and encouraging of my research, and my
development as a researcher and instructor.
Thank you to Justin Lai, whose contributions to my research, my studies, and my experience in the Ideation Lab are far too numerous for me to mention here, other than to say that he has been a tireless mentor, always eager to help and challenge me with new projects. I probably would have finished my thesis much earlier (probably) if it hadn't been for all the projects we've worked on together (sorry Maria!), but they've all been amazing experiences, and I wouldn't have discovered my love of teaching if it hadn't been for Justin's encouragement.
Thank you to Tomonori Honda for his indispensable, wizard-like help with all the statistical analysis. Thank you to my other colleagues in Ideation Lab: Jesse, Garrett, Heidi, Lisa, Anders, and Catherine. Thank you to Barry and David in CADLAB for first inspiring me to pursue product design and for being such amazing role models for teaching. Thank you, Ari, for your unwavering help and for understanding about the late nights and early mornings.
Thank you, Mom and Dad, for your love and support. From my first LEGO inventions as a kid to my more recent projects and research, you've been there every step of the way. Thank you, Michael, for keeping all of my thoughts organized with EagleFiler; I absolutely couldn't have done my research without it. Thank you also for being the best brother/editor, and for challenging me-whether you knew it or not-to write something I'd be proud to show you. Most of all, thank you, Lauren. You always seemed to know, better than I, where I should go and what I should do. Over the past two years, your silent encouragement has always been heard and has immutably changed the direction of my life. You've been the best sister and the best friend.
Table of Contents
Chapter 1
9
Introduction & Background
Emotional Design
9
Kano Model
9
Surprise and Delight
10
Examples of Surprise 12
Designing for Surprise 13
Chapter 2
16
Methods
Idea Generation Methods
16
Brainstorming 16
Multiple Perspectives 17
Experiment Overview
18
Experiment Part I: Generating Ideas
18
Experiment Part II: Evaluating Ideas
19
Evaluating Ideation Methods 19
Mechanical Turk 19
Review Criteria 20
Chapter 3
22
Results
Review Statistics
22
Visualizing the Data
23
Comparing Idea Generation Methods 23
Comparing Adjective Meaning 26
Effect of Idea Clarity 29
Chapter 4
38
Discussion
Counter Attributes for Generating Surprise
38
Sketch Idea Clarity
39
Future Work
39
Current Dataset 39
Collecting More Data 40
Appendix
41
Sample Documents from Experiment
Prompt for idea generation exercise
41
Version A - Brainstorming (page 1) 41
Version A - Brainstorming (page 2) 42
Version B - Multiple Perspectives (page 1) 43
Version B - Multiple Perspectives (page 2) 44
Version C - Counter Attributes (page 1) 45
Version C - Counter Attributes (page 2) 46
Ideation sketches from Experiment: Part
1
47
Mechanical Turk Survey from Experiment: Part II
56
Study Introduction 56
Sample sketch review interface 57
Chapter 1
Introduction & Background
Good design is design that surprises, something that is unexpected but immediately comprehensible and pleasing.
-Norman Klein, professor, California Institute of the Arts' Emotional Design
The following are questions often asked of design research:
How can we make better products?
How can we be better at making better products?
Donald Norman in Emotional Design2 suggests that we can make products work better by making people feel good. In his example, Norman cites a study conducted by Masaaki Kurosu and Kaori Kashimura which timed how long it took people to complete a task at an ATM.3 Different layouts of buttons were used, and the study found that the more visually pleasing interfaces enabled participants to complete their task more quickly. This is the idea of positive affect, wherein a positive emotion is created in order to boost performance. But what can be done to improve products other than improving the layout of buttons? How can we make people feel better? Kano Model
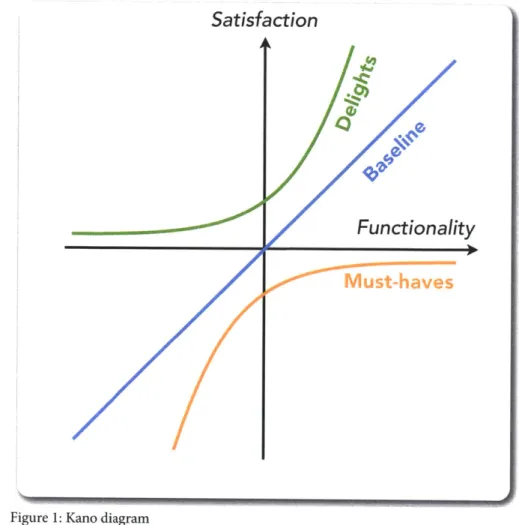
The Kano model4 is a way of plotting a product's ability to satisfy users relative to the functionality it provides, as shown in Figure 1. This model suggests that as a baseline a user's satisfaction with a product increases linearly as the number of basic features increases. However, a user's satisfaction can increase at an accelerated rate if a product possesses features beyond the user's expectations. This rapid increase forms the basis for user delight.5But is it a good idea to delight the user, and if so, how?
Satisfaction
Must-haves
Figure 1: Kano diagram
Prior research has shown that delighting a user through the use of a product can provide an advantage over competing products.6
There is a concern that delighting users once may cause them to expect to be delighted by future products as well, leading to the conclusion that failing to delight users is equivalent to failure. It might seem then that refraining from delighting users might be a safer strategy. However, failing to delight the user and merely providing the must-have qualities creates a commodity business and provides possible competitors a greater
opportunity to delight with their own products by providing more than the must-have requirements.7
Surprise and Delight
Given that it is better to delight the user, the question that still remains is "how can the designer delight the user?" One strategy for this
-incorporating the idea from the Kano model of unexpected, additional
features - is to surprise the user.
While surprise and delight are related, unlike delight, surprise itself is not an emotion. Surprise, however, is a trigger of emotion, and being a trigger
it can create either positive or negative emotion; a surprise can be good or bad.
Surprise in a product can be accomplished in many ways. For example, one method is to create a product that looks different from how it feels. This creates a conflict between different sensory inputs when a person sees an object, makes an assumption about what it should feel like, and then is surprised when the objects feels different from how it looks. Geke Ludden et al. at the Delft University of Technology (The Netherlands) have done this by experimenting with visual tactile incongruities by gauging people's reactions to selected products that exhibit these types of incongruities8 and also by categorizing the types of sensory combinations that can produce surprise.9
What about surprise that does not originate from different information from sensory inputs? Surprise can also occur beyond the boundaries of an experience with a physical product; it can come from a service experience. Online retailer Zappos, for example, is well known for surprising its customers by shipping orders faster than expected.10 However, more generally surprise can occur from one of two situations: one, a new product that is similar to a familiar one but operates or behaves in a different manner, two, a new product that cannot easily be compared to other products but changes the experience of a familiar task or activity. Since a surprise can come from either a product or a service experience, as a more general definition, surprise results from the formulation of an expected experience and the unexpected outcome of a different experience. In the case of Zappos, the expectation of a shipping time is created by the shipping option chosen at checkout. The surprise occurs when the arrival of the package beats the expectation. Over time this surprise may become expected, and therefore no longer surprising, but even so, as is the case for delighting the user, the incentive still exists to continue to surprise. While the consequence of surprise may be that users begin to expect that
experience and no longer appreciate the significant leap of novelty, failure to create surprise practically ensures they will not experience that
delightful leap. The benefit of surprise, like delight, is it allows a product or service experience to be differentiated from the competition. This surprise can lead to emotional attachment and brand loyalty."
In the case of a product, though, in order to be surprising it is not enough to be merely novel. Novelty can often be detected by cursory examination of a product, and if it is detected then it can no longer surprise; it becomes what is expected. In order for a product to surprise, the novelty must be in some way hidden or non-obvious. Working with the definition of surprise, in order to be surprised by a product, a person who sees it for the first time must form an expectation that is later challenged by a different outcome than earlier predicted.
Examples of Surprise
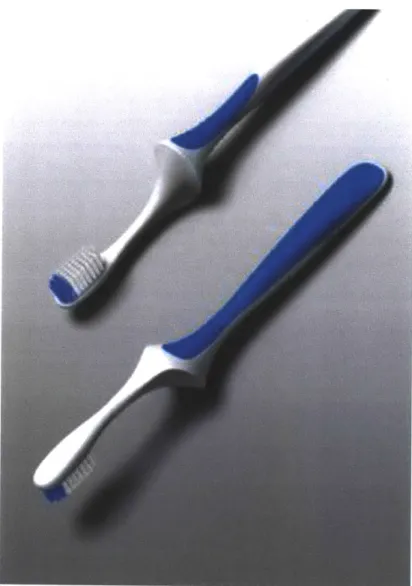
Figure 2: "Float" toothbrush has a handle designed so the bristles never touch the counter surface.
Figure 2 shows the "Float" toothbrush designed by Ju-hyung Kang, Lee Tae Hoon, and Nam Song-e of the Jeju National University (South Korea).12 The shape of the handle is specially designed so that the bristles never touch the bathroom counter surface.
This toothbrush is a good example of surprise because the novel feature of the handle is not immediately obvious upon looking at the toothbrush; it is left as something to be discovered by the user. In addition, this element of surprise is not something tacked on, but something designed with
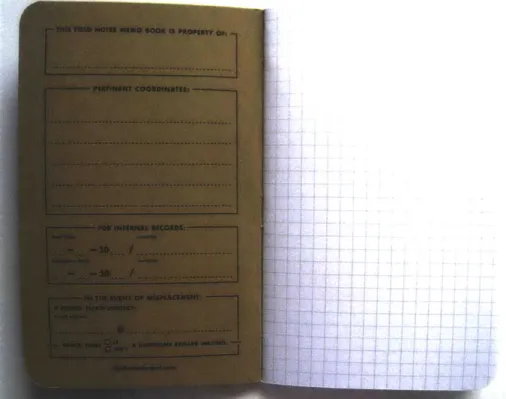
Figure 3: "Field Notes" pocket notebook, inside cover3
Figure 3 shows the inside cover of a "Field Notes" pocket notebook. This is a simple five-inch notebook, similar to other popular pocket notebooks like ones made by Moleskine. What makes this notebook surprising is at the bottom of the inside cover, under the section titled "In the event of misplacement:" there is a field for contact information followed by "hence, there is/isn't a handsome reward waiting." The owner of the notebook then has the option of checking a box to indicate whether or not he would reward the return of this notebook if lost.
This feature of the notebook is not advertised on the company's website. First-time buyers discover this hidden bit of humor when they open the packaging. Field Notes notebooks are functionally no different from other popular, five-inch, paper notebooks. However, this surprise for new customers instantly generates a positive emotional response-in the form of humor-that can now be associated with the product, forever
differentiating it from the competition. Designing for Surprise
Creating surprising products can be beneficial because a surprising object attracts attention, can evoke interest and is remembered better.
-Geke Ludden, et al. Delft University of Technology, 200614
In the previous examples of surprise in products, it is unknown how the designers arrived at those particular surprising design intentions. For those products-and other surprising products like them-was surprise an
element that was designed in a flash of insight? An accident? Geke Ludden, Barry Kudrowitz, Hendrik Schifferstein, and Paul Hekkert built physical prototypes that incorporated sensory incongruities in order to create surprise and humor.15 The study focused on users' reactions, but can there be a process applied to the act of creating and designing for surprise-and not necessarily surprise based on sensory-incongruity? What can designers do in their design process in order to encourage a surprising outcome? Can design for surprise be encouraged through modification of the design process, and if so, what effect does this have on the resulting products? The rest of this research focuses on measuring the ability of a design process to encourage surprise.
In order to design for surprise, let us return to the definition in which a surprise results from the formulation of an expected experience and the unexpected outcome of a different experience; therefore, products that surprise must create one expectation but deliver a different experience. Another way to look at this is to view the design of these types of
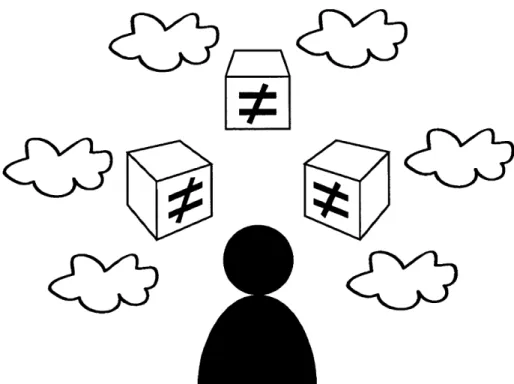
surprising products as a way of challenging assumptions. When designing a new product, for example a new idea for a stapler, in order to create a design that is surprising, it would be helpful to first describe current staplers. These attributes would then be something someone would come to expect about a stapler. Therefore, in order to introduce surprise into a new design, one or more of these attributes could be changed in order to challenge the assumption of what makes a stapler a stapler and create an unexpected, surprising experience. Using this process of listing the assumed attributes of a product concept, but then intentionally changing these attributes, I propose a new method for idea generation called "counter attributes"-a method to generate ideas for surprise. Figure 4 illustrates this process by showing the idea generator at the center,
visualizing attributes of a product concept (represented as cubes), and then generating ideas based on counter notions of those attributes.
(2)?
Figure 4: Counter Attributes as an idea generation method
As an example of how to use counter attributes as an idea generation strategy, if a person were tasked to design a new type of bicycle, she might first create a list of common bicycle attributes:
-two wheels
-rigid frame
-powered by foot pedals
-option to choose speeds
She would then pick an attribute like "powered by foot pedals" and try to generate ideas for bicycles that would not be "powered by foot pedals" such as bicycles "powered by hand"
The primary research question of this thesis is "how can the type of idea generation method affect the quality of the ideas generated?". More
specifically, the goal is to determine whether counter attributes can be used as a strategy to generate ideas for surprise. The hypothesis is that counter attributes should be an effective strategy for generating surprise because it forces idea generators to challenge assumptions about a product concept.
< 2
i?
4D
<2:z?
Chapter 2
Methods
In order to test the effectiveness of counter attributes at idea generation, and specifically at generating ideas that are surprising, we constructed an experiment in two parts. Part Is goal is to test the use of counter attributes as a strategy by actually generating ideas. Part II's goal is to evaluate those ideas.
Idea Generation Methods
Rather than attempt to assess counter attributes as a method on an absolute scale, we chose to compare this strategy of idea generation against two other strategies: brainstorming and multiple perspectives.
Brainstorming
Figure 5: Brainstorming as an idea generation method
Brainstorming is the most well-known type of idea generation method and has been researched extensively.16 17 As depicted in Figure 5, in this method the process is to freely generate ideas, usually constrained within a specific context or problem, but to reserve judgement until later. There are very few rules with brainstorming, but the goal is to not allow self-assessment and judgement to inhibit the flow of ideas.
According to Jami Shah, brainstorming is a type of "germinal" method, meaning it is intended to be used to produce ideas from scratch, and it exists as part of a larger family of "intuitive" methods, methods used to break down mental blocks, as opposed to the other large family of "logical" methods, which are more technically based and use systematic analysis to arrive at a solution.18
Multiple Perspectives
<:2j
<:2?j
<:2?
<:2?
<:2?
<:2?
Figure 6: Multiple Perspectives as an idea generation method
Multiple perspectives, as it relates to Shah's hierarchy of idea generation methods, is similar to brainstorming in that it is another type of "germinal" method. Using multiple perspectives, a person starts by listing or mapping out different types of users or different contexts in which the product would be used. These viewpoints could either be real-by visiting and
interviewing actual, different users-or imagined. He would then pick one of those viewpoints and begin generating ideas within that constraint. As an example of how to use multiple perspectives as an idea generation strategy, if a person were tasked to design a new type of bicycle, he might create a list of common bicycle viewpoints:
- bicycles for road use
- bicycles for off-road use
- bicycles for children
He would then pick a viewpoint like "bicycles for children" and try to imagine ideas for what those bicycles would look like.
One of the intended benefits of multiple perspectives is that it removes one of the possible mental stumbling blocks of brainstorming where a person can become stuck thinking too restrictively. By mapping out first the scope of contexts and users, the person is better aware of the idea space and can jump to generating ideas from a different perspective once one perspective starts to feel stale.
Experiment Overview
While brainstorming, multiple perspectives, and counter attributes operate in different ways, how can their output-ideas-be measured? In order to answer this question, we devised an experiment in two parts. Part I would involve using different idea generation methods to generate ideas; Part II would evaluate those ideas in order to determine any differences deriving from the method used.
Experiment Part I: Generating Ideas
For participants of Part I of the study, we selected students enrolled in an introductory undergraduate design class at MIT. This class was chosen as the study environment because of the students' comparatively equal level of experience in the design process. It was hoped that, since they were still new to design, students would be more comfortable trying a new method for generating ideas, rather than disoriented by trying something they were unaccustomed to.
Fourteen students were each given a single sheet of paper which explained a prompt to generate ideas for new stapler concepts. Each student worked individually for fifteen minutes, and each was given a stack of blank paper and a wide, permanent marker to quickly sketch and annotate ideas. In order to evaluate the effectiveness of counter attributes at generating surprise, and to compare it against other idea generation methods, there were three distinct methods of idea generation chosen: A: Brainstorming, B: Multiple Perspectives, C: Counter Attributes.
Brainstorming Multiple Perspectives Counter Attributes Figure 7: the three different methods of idea generation used in this study. A: Brainstorming, B: Multiple Perspectives, C: Counter Attributes
While each student was instructed to generate ideas for staplers, they were each randomly given a different set of instructions to use a specific method of idea generation-either A, B, or C. Examples of these three different variations of the prompt can be found in the Appendix.
After reading the instructions, students were then allowed fifteen minutes to individually generate ideas for staplers using the method described on the prompt. Because students were working individually and not sharing with others their ideas, sketches, or even which prompt they were given, the amount of distraction from other students was minimized.
At the end of the idea generation exercise, the students completed a short survey about their experiences. We collected each student's sketches, survey, and prompt they were given. Organizing the different papers this way, we would know which student-and which sketches-corresponded to which idea generation prompt: A, B, or C. Once all the papers had been collected from the students, there were almost 130 sketches total, but these sketches would then need to be reviewed in order to assess the differences in idea generation methods.
Experiment Part II: Evaluating Ideas
For Part II of this experiment, we evaluated the individual ideas for stapler concepts in order to assess any differences that may have been caused by the three different idea generation methods employed in Part I.
Evaluating Ideation Methods
It should be noted that, in this case, the effectiveness of the idea generation methods is being measured by an intermediate form-the ideation sketch. In their paper on measuring idea generation effectiveness, Shah,
Hernandez, and Smith discuss the differences between measuring an ideation process at a purely psychological level-while the process is taking place-and measuring the output from that process-such as prototypes.19
By measuring the ideation sketches produced from an idea generation
process, we avoid the highly-controlled, psychological experiment and the indirect nature in which those observations relate to output. We also avoid measuring physical prototypes produced. For those experiments that measure prototypes, the idea generation phase is but one part of a more lengthy process, and it is difficult, at best, to attempt to eliminate the many additional variables. Therefore, by evaluating the sketches produced from idea generation, we seek to capture a more direct and informative view of the process.
Mechanical Turk
In order to evaluate the almost 130 sketches produced in Part I of the study, we used Amazon's online service, "Mechanical Turk'. Self-described as "artificial artificial intelligence," Mechanical Turk is a both a posting space for jobs-called HITs: Human Intelligence Tasks-and a network of
registered users to complete those jobs in return for monetary compensation.20
Mechanical Turk is an extremely useful tool for collecting data; with hundreds of thousands of users in over 100 countries, it is a diverse environment in which to collect data.21 When posting a HIT, the designer is able to specify certain restrictions such as how many users are allowed to complete the task, the location of those users (for example: United States), and the user approval rating (reflective of how satisfactorily they have completed other HITs), as well as other demographic information. Although it is somewhat of a new service, Mechanical Turk is already a popular tool for gathering data for research and there have already been several studies to examine the service itself.2 23 Although there may be some doubts about the subject population or the validity of the results, Paolacci, Chandler, and Ipeirotis have tested Mechanical Turk as a research tool and they have produced some interesting results. In their study, they found that the population of Mechanical Turk users-when restricted to the U.S.-is at least as representative of the U.S. population as a more traditional subject pool, even more so than a typical university pool where the subjects are undergraduates near the age of twenty. They compared the results of several tests between Mechanical Turk, a typical internet survey, and a university pool and found comparable levels of unreliable responses. In addition, they also found the amount of money for compensation has no effect on the data quality, and that there is no evidence that the responses are of any poorer quality than those from a typical subject pool.2 4
In order to create our Mechanical Turk HIT, each of the sketches were scanned and any personal information such as names or initials were removed from the digital pictures in post processing. Each individual scanned picture was given an identification number that referenced a table. The otherwise anonymous sketch, when referenced to the table, would indicate which student had created the sketch and what type of idea generation method was used.
Review Criteria
Because Mechanical Turk HITs tend to be short tasks, much less than an hour long, we divided the 128 sketches into four groups of 32. Each part would contain an assortment of sketches from different people and from different prompts. All four parts were published as HITs on Mechanical Turk with identical formatting and questions, with the only difference being the sketches that were shown to the worker.
Each HIT was limited to workers in the United States with a 95% or greater approval rating. Workers received $1.50 for successful completion of the HIT, corresponding to roughly a $3/hour wage-within the normal range for typical HIT compensation. Before starting the review portion of each
HIT, workers were requested to answer various demographic questions about their gender, age, and education.
In the review section of the HIT, workers were told that they would be reviewing concept ideas for a new stapler. For each sketch they would be asked if the idea was clear, answering "yes"' or "no". Whether the idea was clear to them or not, they would also be asked how much they agreed with each of the following adjectives describing the sketch:
-novel -non-obvious -useful -creative -surprising -unusual
Next to each adjective, they could indicate their agreement level by answering using a five-point scale: "strongly agree", "agree", "neutral", "disagree", "strongly disagree". Also, for each sketch, workers could optionally type in any comments about the idea, such as "I've seen this kind of product before" or "I'm concerned this would be too complicated". Each of the six adjectives were chosen for specific reasons. None of them were defined in the HIT, but this was done intentionally in order to assess what meanings the words have for non-product-experts. Additionally, there was intentional overlap between the meanings of the words. The
adjectives "novel", "non-obvious", and "useful" were chosen because of their traditional use in the patent environment. If any of the ideas generated are truly good and unique, then hypothetically they could be something patentable, and thus be described by these three adjectives.
However, since the population of reviewers would be representative of the
U.S. population, and not specifically product designers, the adjective
"creative" is important to the study for its appeal to a more general audience. Additionally, research by Teresa Amabile indicates that while "creative" as a quality may be difficult to break down into its components and understand what about a product makes it creative, people are able to recognize "creative" when they see it: something is creative if a set of judges can independently agree it is creative.2By 5 having "creative" on the list of adjectives in addition to "nover, "non-obvious", and "useful" it will be possible to see what distinction, if any, a representative sample of the population makes between these words.
"Surprising" and "unusual" were both chosen as words to gain more insight into the possible differences between ideas generated via brainstorming, multiple perspectives, or counter attributes-as well as to describe a quality not quite captured by either the patent adjectives or by "creative". Both of these words were also chosen in order to see if people make a distinction between "surprising" and "unusual" or if the two are generally viewed as synonymous.
Chapter 3
Results
After results from the HITs were submitted by workers, the responses were examined for completeness as well as checked to be sure workers didn't submit the same response for all the questions or spend too little time completing the reviews. Workers who completed the reviews satisfactorily received compensation, while for others, the HIT was resubmitted so that there were 100 usable responses for each of the four parts of the study.
Review Statistics
Most workers completed a HIT successfully. There were no obviously rushed responses-HITs that lasted only a few seconds, rather than twenty
minutes-or HITs with all the same responses for every question indicating that their responses were not serious. In addition, of the over 400 workers, less than 2% failed to complete the HIT in its entirety. Also it
is interesting to note that 63% of the Mechanical Turk workers who
completed the survey were female, and the average age was 34.3 years. This is comparable to the Paolacci et al. study on Mechanical Turk workers in which 75% were female, and the average age was 34.3 years.26
Natural Language Scores to Numeric Scores
Since each of the 128 sketches were reviewed by 100 people and rated on six different qualities, there are easily over 75,000 data points. The first step was to convert some of the natural-language data into a numerical score.
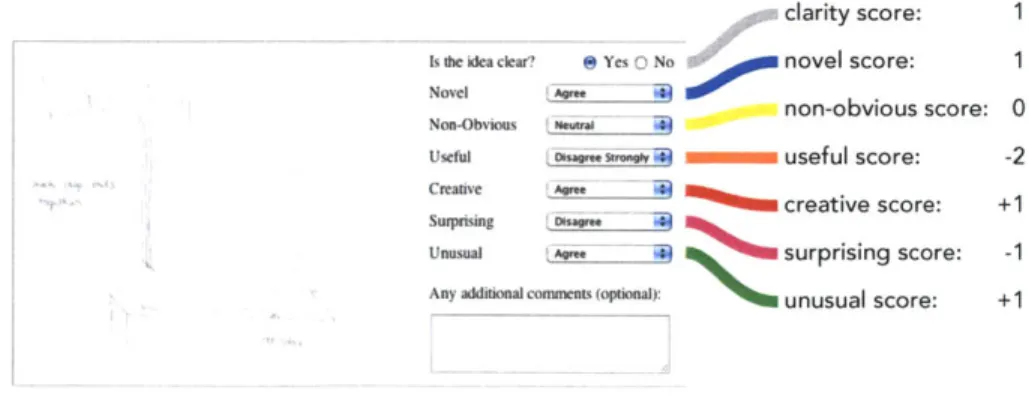
For each quality (novel, non-obvious, useful, etc.), workers identified their agreement level by selecting "strongly agree", "agree", "neutral", "disagree", or "strongly disagree'. These agreement levels were then converted to a numerical score with -2 corresponding to "strongly disagree", -1 to
"disagree", 0 to "neutral", + 1 to "agree", and +2 to "strongly agree".
clarity score: 1
Is he ideaclear e Yes O No novel score: 1
Novel 0
non-obvious score: 0 Non-Obvious Nw
useful swam useful score: -2
Creative P creative score: +1
Surprising
Unusual Q surprising score: -1
Any uddional comments (op"*onaI) unusual score: +1
Figure 8: sketch idea quality scoring rubric
Figure 8 demonstrates this scoring rubric, as well as how a "yes"/"no" response for "Is the sketch clear?" corresponds to a 0 or 1 clarity score.
Visualizing the Data
Comparing Idea Generation Methods
Once all the scores were converted to numeric scores, the 100 reviewer scores for each adjective were averaged for each of the 128 sketches-producing an average rating for "clarity" "novelty" etc. for each sketch. These sketch idea quality scores were then organized by idea generation method: brainstorming, multiple perspectives, and counter attributes. Interestingly, in this experiment all three methods produced a similar number of sketches; counter attributes produced the least with 38, brainstorming next up with 41, and multiple perspectives with 49.
However, in order to compare the raw quality scores of these methods and account for the difference in the number of ideas, the raw quality scores for each ideation method were averaged over the number of sketches in order to produce an average quality score.
Average Scores for Idea Generation Methods
0 U 0)
<0
F average 9 qai s ftA 0 .2
D Z C - r
00 0
Brainstorming Multiple Perspectives Counter Attributes
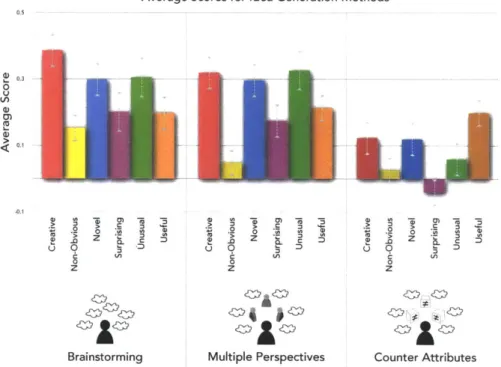
Figure 9: average idea quality scores for idea generation methods: brainstorming, multiple perspectives, and counter attributes. The standard error is represented by the grey bars.
Figure 9 shows the average scores for idea qualities, grouped by which idea generation method produced the sketch. Looking at the set of six qualities for sketches from each type of idea generation method, there is very little apparent difference between many of the qualities of ideas generated by brainstorming and by multiple perspectives. "Novel", "surprising", "unusual"', and "useful" all appear to be similar for brainstorming and multiple perspectives. Although "creative" scores are higher for
brainstorming than for multiple perspectives, the amount of difference is within the standard error for the two quantities and so may not be
considered a significant difference. However, there is a difference between the "non-obvious" scores from brainstorming and multiple perspectives. Here the difference is greater than the standard error and it seems to indicate that ideas generated via brainstorming are more non-obvious-less obvious-than ideas generated via multiple perspectives.
The real surprise, however, are the scores for the ideas generated via counter attributes. The original hypothesis was that counter attributes would be a helpful tool for generating ideas that were surprising. By deliberately trying to challenge assumptions and generate ideas different from what was expected, it was anticipated that the ideas would be more unusual. Perhaps the ideas would not all be useful ideas, but they would at least be more unusual. As Figure 9 shows, the ideas generated via counter attributes have a much lower "unusual" score and even received the only negative overall score for "surprising". Additionally, the scores for "creative" and "novel" are also significantly lower than the scores from either
brainstorming or multiple perspectives. Interestingly, while so many of these scores seem lower for ideas from counter attributes, "useful" appears to be a constant quality across all three methods of idea generation. Perhaps this suggests that all three methods produce, on average, equally useful ideas, or perhaps normal people in a study-as opposed to product designers-are not capable of accurately assessing an idea's usefulness. The bar chart in Figure 9 does seem to suggest that, on average, the ideas generated from counter attributes are not as good as the ideas generated via brainstorming or multiple perspectives. However, this score examines only the average score of all the sketches from a particular idea generation method. In a more realistic scenario, it may not matter what the average
quality of idea is that comes from an idea generation session. As long as a subsequent selection process is effective, it matters more how many great ideas are generated and not how many mediocre or poor ideas are.
011 413 410 414 *4 *5 100 Top 20% Top 25% 50 + 0 -50 -100 *
A
AaBrainstorming Multiple Counter Perspectives Attnbutes
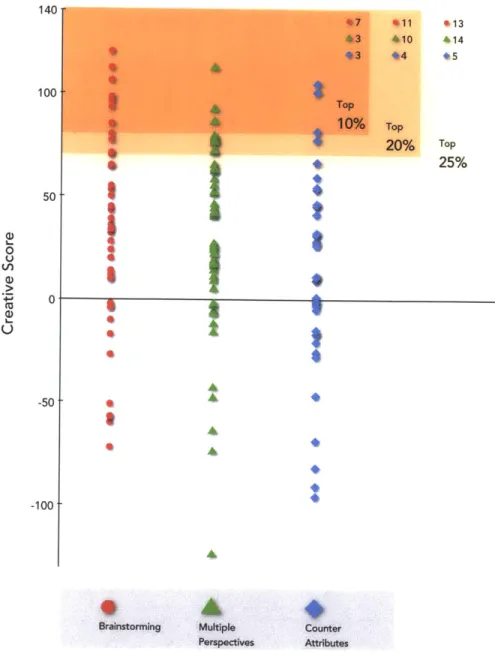
Figure 10: the top-rated ideas grouped by idea generation method
Figure 10 shows all 128 ideas arranged in order of their "creative" score, with the ideas at the top being the most creative. The data are in three columns to represent which idea generation method produced the idea. The previous bar chart in Figure 9 seemed to suggest that ideas generated
by brainstorming were the most creative, ideas from multiple perspectives
were equal or possibly less creative, and ideas from counter attributes by far the least creative. Figure 10, which shows the top-scoring ideas,
supports this.
Looking at the top 10% of the highest-scoring ideas, seven of them came from brainstorming, while only three came from multiple perspectives and three from counter attributes. Expanding the view to the top 20%, it begins to look like brainstorming and multiple perspectives are equal in output,
but that counter attributes significantly lags behind in producing creative ideas. Further expanding the view to the top 25% shows similar results with brainstorming producing 13 of the ideas, multiple perspectives producing 14, and counter attributes producing only five. While the method of counter attributes produced significantly fewer creative ideas in the top 25%, it is not for lack of number of ideas given that all three methods produced a similar number of ideas.
Comparing Adjective Meaning
Given some of the similar scores for "creative" and "novel" in the bar chart in Figure 9, and given that the six adjectives were intentionally chosen with some overlap in meaning, it is interesting to look at the correlation
between how reviewers rated different adjectives.
Creative Non- Novel Surprising Unusual Useful Obvious Creative X 0.84 0.97 0.9 0.91 -0.22 Obous X 0.9 0.89 0.89 -0.47 Novel X 0.94 0.92 -0.26 Surprising X 0.98 -0.47 Unusual X -0.54 Useful X
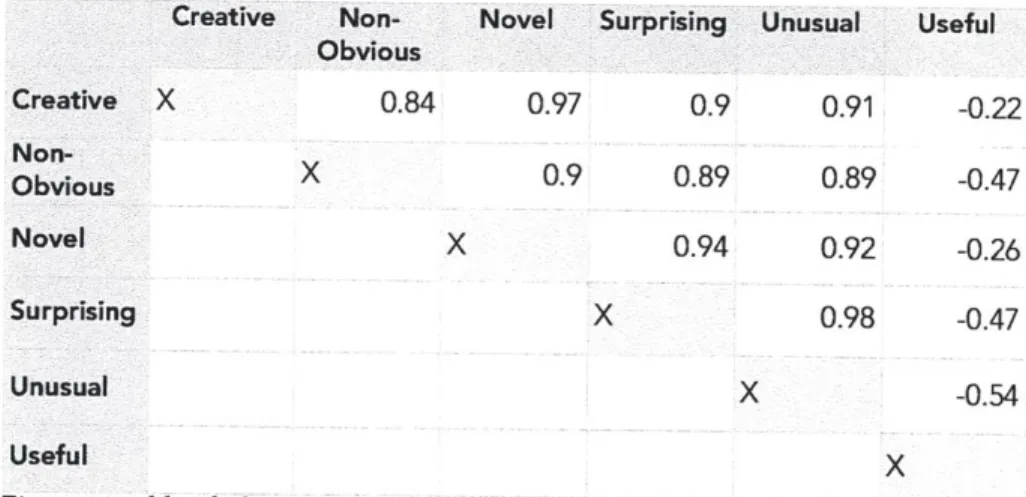
Figure 11: table of adjective to adjective correlations
Figure 11 shows a table of all the different possible adjective to adjective Pearson correlations. For all of these correlations, the p-value is less than
0.05. As the chart shows, adjectives "novel" and "creative" are very highly
correlated, as are "unusual" and "surprising. Alternatively, this can be viewed by plotting the scores against each other, as has been done in Figure 12 and Figure 13.
Figure 12: average sketch creative score versus average sketch novel score
Figure 13: average sketch surprising score versus average sketch unusual score
Interestingly, there are reasonably high correlations amongst most of the adjectives. For example, although seemingly having different meanings and
Creative vs. Novel
given that both are individually common terms for describing a product's patentability, "non-obvious" and "novel" share a high correlation as well,
also represented in Figure 14.
Non-Obvious vs. Novel
Figure 14: average sketch non-obvious score versus average sketch novel score
While most of the adjectives have reasonably high correlations with each other, none seem to have a significant correlation with "useful". None of the correlations have a magnitude greater than 0.50, and, even more
interesting, is that usefulness is negatively correlated with all of the other adjectives. The effect of this negative correlation can be seen in Figure 15 which plots "useful" versus "creative". Given the general downward sloping trend of the plot, it seems to indicate that increasing scores of creativity are
Figure 15: average sketch useful score versus average sketch creative score
Effect of Idea Clarity
In addition to comparing one adjective to another, there is also the clarity score. Initially, the clarity question ("Is the idea clear? yes/no") was
included on the Mechanical Turk HIT for each sketch so that unclear ideas, and how they were rated, would not have as much influence as clearly sketched ideas. While all the data presented up to this point have only included ideas with a clarity score of 50% or greater (only 10% of all ideas fall below that threshold), it is interesting to see how the clarity score of all of the 128 ideas relates to the other qualities such as "creative" or
"surprising".
The original hypothesis was that unclear ideas would exhibit greater variation for the other qualities. For example, if an idea were not clearly sketched, one person might rate its creativity highly but another might rate it poorly; the score would depend greatly on how the sketch was
interpreted. However, plotting the standard deviation of qualities versus clarity produced surprisingly different results.
Figure 16: novel standard deviation versus clarity
Non-Obvious StDev vs. Clarity
1.4 R = 0.1081 1.3-1.2 1.1 -0.9 0.8 0.7 0.6 0.5 0 0.2 0.4 0.6 0.8 1 1.2
Figure 17: non-obvious standard deviation versus clarity
Novel StDev vs. Clarity
1.4 -R2= 0.27903 1.3-1.2 -1.1 - 1-0.9 0.7 0.6 0.5 0 0.2 0.4 0.6 0.8 1 1.2
Useful StDev vs. Clarity
1.5 -R= 0.14818 1.4-1.3 1.2 1.1 1 0.9 0.8 0.7 0.6 0.5 0 0.2 0.4 0.6 0.8 1 1.2Figure 18: useful standard deviation versus clarity
Creative StDev vs. Clarity
1.3 R2=0.22694 1.2-1.1 1-0.9 0.8 0.7
+
0.6 0.5 0 0.2 0.4 0.6 0.8 1 1.2Surprise StDev vs. Clarity
1.3 R2= 0.20252 1.2 . 1.1 1 0.9 0.8 0.7 -0.6 0.5 0 0.2 0.4 0.6 0.8 1 1.2Figure 20: surprising standard deviation versus clarity
Unusual StDev vs. Clarity
1.4 -R2-= 0.05516 1.3-1.2 - 1.1-0.9 0.8 0.7 0.6 0.5 0 0.2 0.4 0.6 0.8 1 1.2
Figure 21: unusual standard deviation versus clarity
Figures 16-21 show each adjective as it is plotted against clarity. In all cases, the plots do not show what was hypothesized: standard deviation
decreasing with increasing clarity. In actuality, all of the plots seem to suggest the opposite is true-that the standard deviation, or the variation, of other ratings actually increases as the sketch becomes more clear. This can also be visualized another way by plotting the actual sketch quality scores-rather than standard deviation-versus clarity, as is shown in Figures 22-27. 'hese plots give a slightly more complete picture than what was shown by the standard deviation versus clarity plots. These plots not only show how the variation of ratings increases with increasing clarity, but also that unclear sketches have a distinct starting point for how they are rated. In addition to the fanning out of data points, the plots show that unclear sketches tend to be rated more consistently, without significant numbers of reviewers rating "agree" or "disagree" but rather sticking toward the middle "neutral". This would seem to indicate that for unclear ideas, reviewers used the "neutral" rating as a way of responding, "I don't know how to rate the idea".
Novel vs. Clarity
1.5 1* 0.5 0*0
.) 0.2 0.4* 0.6 0.**
1 1.2 -0.5.
-1 -1.5Non-Obvious vs. Clarity
1.5 1 0.5 46' -1 -1.5Figure 23: non-obvious scores versus clarity
Useful vs. Clarity
1.5 1~0.5
-0a at . * 40. 0.6 .8 *$1 1.2 -0.51 -1 -1.5Creative vs. Clarity
1.5 1 0.5 0 -00.2 0 $ 0.6"~ 1 1.2 -0.5 -1.5Figure 25: creative scores versus clarity
Surprise vs. Clarity
1.5 10.5
-- t.2 .0.4
1 1.2 -0.5 -1 4 -1.5Unusual vs. Clarity
2 1.5 1 - 0.5-0 - p 0.2 0.4*0.6
#1 1. -0.5 -1*
-1.5Figure 27: unusual scores versus clarity
It is important to remember that data points on these plots of quality versus clarity represent the mean score of an individual sketch versus clarity. Each point, therefore, represents an individual sketch and the average score of how 100 people on Mechanical Turk rated it on a particular quality. Similarly, on the plots of adjective standard deviation versus clarity, each point represents an individual sketch and the standard deviation of how 100 people on Mechanical Turk rated it on a particular quality. In both types of these plots, either the average score or the standard deviation of that score is plotted against the average clarity score for the corresponding sketch. What is important to remember is that these data points represent individual sketches. However, what about looking at the data from the reviewer's, rather than the sketch's, perspective?
Novel StDev vs. Average Clarity
0.7 R2 = 0.96968 0.6 0.5 0.4 0. 1 0 0.11 0.34 0.49 0.71 0.90Figure 28: novel standard deviation versus bins of average clarity
Another way to look at the qualities plotted against clarity is to look at the standard deviation of sketch quality from individual reviews with similar clarity and plot this average versus clarity. In order to do this, all of the individual sketch reviews from Mechanical Turk were arranged in order of clarity-ignoring their relationship to particular sketches. This range of clarity scores from zero to one were divided into five bins of equal size (0.2), and the standard deviation of the "novel" scores for that clarity bin was calculated. Figure 28 shows that "novel" standard deviation for clarity-binned reviews increases quite linearly with clarity. What this plot shows is that, independent of the actual sketch, individual reviewers are much more consistent with their ratings of an unclear sketch, and the standard
Chapter 4
Discussion
Counter Attributes for Generating Surprise
The original experiment set out to answer the question: "Can surprise be encouraged during the idea generation phase?" This was attempted by creating the counter attributes method and using it as a way of consciously altering assumed characteristics of a product, thus creating something unexpected. As it turned out, what was unexpected was not the ideas produced by counter attributes, but the comparison of results from the different ideation methods.
While all three methods produced similar numbers of sketches, the comparisons showed that brainstorming and multiple perspectives yielded similarly rated sketches, while counter attributes yielded markedly different ratings. In nearly every quality, "novel", "non-obvious", "creative", etc., sketches produced from using counter attributes were consistently rated lower than sketches from either brainstorming or multiple perspectives. For counter attributes, "surprising" even achieved an overall negative score in an otherwise positive-dominated score environment. Similarly,
"unusual", while not a negative score, had the largest negative change as compared to brainstorming or multiple perspectives. In other words, while counter attributes was meant to be used as a method to generate the most surprising ideas, it actually produced the least surprising ideas and ones that were also less creative and novel.
What is the reason for this? It may be possible the difference in
performance is related to training. It is not uncommon for people to have experience with the brainstorming process, but counter attributes as a method for idea generation would have been entirely new to them. This theory, however, would not explain the performance of multiple
perspectives-which was similar to brainstorming. Considering the limited experience the students have had with idea generation processes, multiple perspectives would also have been a new strategy and so performance should have been similar to counter attributes-which it was not. It is also important to acknowledge that not all surprises can be
experienced through a sketch, others are truly experiential-requiring a higher-resolution experience than can be created by the more abstract nature of a sketch. In the examples of surprise presented earlier in the
Introduction, surprises like those created by Zappos are more embodied in an experience than a surprise created on a two-dimensional medium like the inside cover of a Field Notes notebook (Figure 3). Admittedly, it is a known limitation of this study that we are measuring sketches, and not
actual products. However, measuring sketches allows a closer view of the output from idea generation, rather than a more distant view based on physical prototypes or products. If counter attributes had been a truly effective method for generating surprise, it should still have generated more surprises-experiential or not-than other methods.
An alternate theory is that perhaps the structures themselves of the different ideation methods are the cause. Multiple perspectives might be considered more structured than brainstorming, given that a list of viewpoints is generated first and then ideas from those viewpoints.
However, once the viewpoints have been created, the process is a bit more like roleplaying where the idea generator is imagining things from the perspective of a different user. With counter attributes, the process is a bit more restrictive. While a list of attributes are generated first, generating ideas from those attributes is more rule-based where the new idea must fit into the schema of the counter attribute. This requires less the imagination to see things differently, and more an adherence to a set of rules or filters. Perhaps it is this filtering process that limits the surprising and creative output from this method. In brainstorming, the mantra is to defer
judgement: generate ideas freely and without restraint-only filtering ideas after brainstorming is over. Multiple perspectives works a similar way except the idea generator doesn't just generate ideas from their own
perspective, but from others' as well. Counter attributes, on the other hand, imposes a filtering process with the counter attribute, and thus by
introducing judgement into the generation process, inhibits the creative output.
Sketch Idea Clarity
Comparing sketch quality ratings to the sketch clarity provided another unexpected result. Sketches that were rated as being unclear tended to be rated neutral, and as sketches became more clear the variance of ratings also increased, yielding a greater standard deviation for sketches that were rated as being clear. While it was assumed that reviewers who were unsure of what the idea was would rate it poorly, in actuality reviewers rated it neutral so as not to rate high or low. Similarly, while it was assumed that reviewers would rate clear ideas the most consistently, these ideas tended to have the most variance as people who understood what the idea was formed stronger opinions about it and were divided on whether to rate it high or low. As a recommendation for those seeking feedback on their ideas, it seems that a clearer sketch will better enable others to provide stronger feedback.
Future Work Current Dataset
Working with the current set of data, there is still a significant amount of analysis to do. When conducting Part I of the experiment where students generated and sketched ideas, the activity was followed by students
completing a survey about what they thought about the exercise. This survey asked them questions about how they thought of themselves as a creative person, as well as how they were feeling that day. The survey also asked them questions about their amount of prior experience in design. So far, this data has not been analyzed, but it would be interesting to analyze it with respect to the multitude of sketching data. For example, "How do the
sketch ratings for someone who felt creative compare with the ratings for someone who didn't?" "Did people who found the exercise more enjoyable produce more ideas?", or "Does experience and the type of ideation
method co-affect their performance?"
In addition to the student survey data, there is more analysis that could be done at the sketch level. For example, while the sketches were rated on an absolute scale, another question would be, "How do the sketches compare to each other?" It may be useful to make this comparison by categorizing all the ideas by approach-glue, magnets, etc.-in order to determine the conceptual overlap. Although there were several ideas that multiple people independently generated, it is not yet known how the type of ideation method relates to this. For example, "Does one ideation method tend to produce more different ideas, or does another tend to allow multiple people to arrive at similar ideas?" Deciding which ideas are similar would require some categorization, as well as interpretation of some of the less clear sketches. However, the review of these sketches could take place on Mechanical Turk.
Collecting More Data
In the current Mechanical Turk HIT for this study, incomplete responses were eliminated from the analysis since they seemed to indicate that the reviewer was not giving the responses his or her full attention. Future Mechanical Turk HITs should incorporate a more integrated test for attention. Based on the work done by Paolacci et al., a few trick questions meant to intentionally mislead the inattentive reviewer can help determine which data points are reliable and which aren't.
The current study tested three different ideation methods. Increasing the sample size of the number of idea generators would increase confidence in differences between methods, as well as produce a larger overall number of sketches with which to analyze. Expanding on this study, it would also be interesting to test other, intuitive ideation methods such as morphological analysis27 or K-J method28 or even other systematic and logical methods such as TRIZ.9
Appendix
Sample Documents from Experiment
Prompt for idea generation exercise
Version A - Brainstorming (page 1)
Idea Generation Exercise
Name Introduction
You are participating in a planned idea generation exercise. The goal of this exercise is to gain a better understanding of different approaches to the brainstorming process.
You will be generating concepts for new office products. You will be given more information about the specific office product on the other side of this page. Do not start until you have completely read and understood this page.
Instructions
Try to come up with as many ideas as you can, quickly, not spending too much time on any one single idea.
Sketch every idea you have on a separate sheet of paper; include a title for the sketch and label any necessary details. You will have approximately 15 minutes to brainstorm and sketch.
Stop
Once you have completely read and understood the instructions, you may turn over this sheet and begin brainstorming.
Version A - Brainstorming (page 2)
Idea Generation Exercise
Prompt
You will be brainstorming ideas for something that accomplishes a task similar to a stapler-something for fastening together multiple sheets of paper. Remember your instructions for brainstorming.
Reflections
Once you are finished with this exercise, please answer the following questions about your experiences.
1. 1 thought this experience was enjoyable
strongly disagree disagree neutral
2. 1 thought this experience was stressful strongly disagree disagree neutral
3. 1 am generally a creative person
strongly disagree disagree neutral
4. 1 feel creative today
strongly disagree disagree neutral
5. 1 think the concepts I sketched are useful
strongly disagree disagree neutral
6. 1 think the concepts I sketched are surprising
strongly disagree disagree neutral
agree agree strongly
agree agree strongly
agree agree strongly
agree agree strongly
agree agree strongly
agree agree strongly
7. Overall I am satisfied with the concepts I sketched
strongly disagree disagree neutral agree agree strongly
Version B - Multiple Perspectives (page 1)
Idea Generation Exercise
Name
Introduction
You are participating in a planned idea generation exercise. The goal of this exercise is to gain a better understanding of different approaches to the brainstorming process.
You will be generating concepts for new office products. You will be given more information about the specific office product on the other side of this page. Do not start until you have completely read and understood this page.
Instructions
1. Before you begin generating ideas, you will first write down on a
separate sheet of paper a list of different perspectives or viewpoints commonly associated with the specific product.
2. Then, start by choosing one of those viewpoints and spend a few minutes generating ideas for that viewpoint.
For example, if your task were to design a new type of bicycle, you might create a list of common bicycle viewpoints:
-bicycles for road use
-bicycles for off-road use
-bicycles for children
-bicycles for the disabled
You would then pick a viewpoint like "bicycles for children" and try to imagine ideas for what those bicycles would look like.
3. Try to come up with as many ideas as you can, quickly, and then move
on to the next viewpoint.
It's up to you to decide how much time to spend on each viewpoint, but it's recommended you spend no more than a few minutes generating ideas related to a viewpoint before moving on to the next.
Sketch every idea you have on a separate sheet of paper; include a title for the sketch and label any necessary details. You will have approximately 15 minutes to brainstorm and sketch.
Stop
Once you have completely read and understood the instructions, you may turn over this sheet and begin brainstorming.
Version B - Multiple Perspectives (page 2)
Idea Generation Exercise
PromptYou will be brainstorming ideas for something that accomplishes a task similar to a stapler-something for fastening together multiple sheets of paper. Remember your instructions for brainstorming.
Reflections
Once you are finished with this exercise, please answer the following questions about your experiences.
1. 1 thought this experience was enjoyable
strongly disagree disagree neutral agree agree strongly
2. 1 thought this experience was stressful
strongly disagree disagree neutral agree agree strongly
3.1 am generally a creative person
strongly disagree disagree neutral agree agree strongly
4. 1 feel creative today
strongly disagree disagree neutral agree agree strongly
5.1 think the concepts I sketched are useful
strongly disagree disagree neutral agree agree strongly
6.1 think the concepts I sketched are surprising
strongly disagree disagree neutral agree agree strongly
7. Overall I am satisfied with the concepts I sketched
strongly disagree disagree neutral agree agree strongly
Feel free to use the remaining space for any additional comments you have.
Version C - Counter Attributes (page 1)
Idea Generation Exercise
Name
Introduction
You are participating in a planned idea generation exercise. The goal of this exercise is to gain a better understanding of different approaches to the brainstorming process.
You will be generating concepts for new office products. You will be given more information about the specific office product on the other side of this page. Do not start until you have completely read and understood this page.
Instructions
1. Before you begin generating ideas, you will first write down on a
separate sheet of paper a list of attributes commonly associated with the specific product.
2. Then, start by choosing one of those attributes and spend a few minutes generating ideas that deliberately oppose that chosen attribute. For example, if your task were to design a new type of bicycle, you might create a list of common bicycle attributes:
- two wheels - rigid frame
-powered by foot pedals
-option to choose speeds
You would then pick an attribute like "powered by foot pedals" and try to imagine ideas for bicycles that would not be "powered by foot pedals", such as bicycles "powered by hand".
3. Try to come up with as many ideas as you can, quickly, and then move
on to the next attribute.
It's up to you to decide how much time to spend on each attribute, but it's recommended you spend no more than a few minutes generating ideas related to an attribute before moving on to the next.
Sketch every idea you have on a separate sheet of paper; include a title for the sketch and label any necessary details. You will have approximately 15
minutes to brainstorm and sketch.
Stop
Once you have completely read and understood the instructions, you may turn over this sheet and begin brainstorming.
Version C - Counter Attributes (page 2)
Idea Generation Exercise
PromptYou will be brainstorming ideas for something that accomplishes a task similar to a stapler-something for fastening together multiple sheets of paper. Remember your instructions for brainstorming.
Reflections
Once you are finished with this exercise, please answer the following questions about your experiences.
1. 1 thought this experience was enjoyable
strongly disagree disagree neutral agree agree strongly
2.1 thought this experience was stressful
strongly disagree disagree neutral agree agree strongly
3.1 am generally a creative person
strongly disagree disagree neutral agree agree strongly
4. 1 feel creative today
strongly disagree disagree neutral agree agree strongly
5.1 think the concepts I sketched are useful
strongly disagree disagree neutral agree agree strongly
6.1 think the concepts I sketched are surprising
strongly disagree disagree neutral agree agree strongly
7. Overall I am satisfied with the concepts I sketched
strongly disagree disagree neutral agree agree strongly
Ideation sketches from Experiment: Part I
SCVCA