HAL Id: cea-02388818
https://hal-cea.archives-ouvertes.fr/cea-02388818
Submitted on 2 Dec 2019
HAL is a multi-disciplinary open access
archive for the deposit and dissemination of
sci-entific research documents, whether they are
pub-lished or not. The documents may come from
teaching and research institutions in France or
abroad, or from public or private research centers.
L’archive ouverte pluridisciplinaire HAL, est
destinée au dépôt et à la diffusion de documents
scientifiques de niveau recherche, publiés ou non,
émanant des établissements d’enseignement et de
recherche français ou étrangers, des laboratoires
publics ou privés.
extraction with tri-n-butylphosphate in the purex
process
P. Moeyaert, M. Miguirditchian, M. Masson, B. Dinh, X. Heres, S. de Sio, C.
Sorel
To cite this version:
P. Moeyaert, M. Miguirditchian, M. Masson, B. Dinh, X. Heres, et al.. Experimental and modelling
study of ruthenium extraction with tri-n-butylphosphate in the purex process. Chemical Engineering
Science, Elsevier, 2017, 158, pp.580-586. �10.1016/j.ces.2016.10.035�. �cea-02388818�
EXPERIMENTAL AND MODELLING STUDY OF RUTHENIUM EXTRACTION
WITH TRI-N-BUTYLPHOSPHATE IN THE PUREX PROCESS
P. Moeyaert
a, M. Miguirditchian
a, M. Masson
a, B. Dinh
a, C. Sorel
a, X. Hérès
aand J.-F. Dufrêche
ba French Alternative Energies and Atomic Energy Commission, CEA, Nuclear Energy Division, Radio Chemistry & Processes Department, DRCP, BP
17171, F-30207 Bagnols sur Cèze, France.
E-mail: pauline.moeyaert@cea.fr; Tel: +33 4 66 79 77 57
b Institut de Chimie Séparative de Marcoule, Université de Montpellier 2, UMR 5257 CEA / CNRS / UM2 / ENSCM BP 17171 30207 Bagnols sur
Cèze Cedex, France
Abstract –
Ruthenium extraction by tri-n-butylphosphate (TBP) from nitric acid was studied and modelled in the conditions of the PUREX process. Experimental distribution ratios obtained for water, nitric acid and ruthenium were described with a physicochemical model based on the application of the mass action law on each extraction equilibrium and by taking into account deviations from thermodynamic ideal behaviour both in aqueous and organic phase using Mikulin and Sergievskii-Dannus equations. The best agreement between experimental and calculated ruthenium extraction isotherms was obtained by considering the formation of two complexes andin organic phase. This model was then used to simulate ruthenium behaviour in a counter-current PUREX hot test
performed in mixer-settlers.
Highlight
Extraction of ruthenium from nitric acid media by TBP/TPH was studied at lab-scale
A thermodynamic model based on Mikulin equation and Sergievskii-Dannus model was developped
Good agreement between experimental and calculated distribution ratios was obtained
Mathematical model was tested successfully during a counter-current PUREX hot test performed in mixer-settlers
Keywords –
Ruthenium, Nitric acid, Uranium, TBP, Solvent extraction, Modelling.1. Introduction
Uranium and plutonium are recovered from spent nuclear fuels and separated from the fission products by the PUREX process (Plutonium Uranium Refining by Extraction) using the tri-n-butylphosphate (TBP) as extractant in the organic phase. [1]
Among the fission products formed by irradiation of the fuel in the reactor, ruthenium is considered as one of the most troublesome. First, it contributes significantly to the radioactivity of the spent fuel in the first years of cooling. As the half-life of 106Ru isotope is about one year (T1/2 = 373.6 d),
the decontamination factor (DF) required for uranium and plutonium decontamination towards ruthenium in the PUREX process must be very high to reach uranium and plutonium specifications versus contamination especially if short cooling time fuels are reprocessed. Although ruthenium is poorly extracted by TBP, the low quantities co-extracted with uranium and plutonium in organic phase are then very difficult to scrub in the process. Moreover, speciation of ruthenium is very complex in nitric acid media, mainly due to the sensitive equilibria occurring between the different ruthenium species present in solution. [2] Most of the Ru(IV) ions produced during
the dissolution of the spent fuel in nitric acid are quickly converted to Ru(III). Ruthenium (III) forms highly stable RuNO3+ species, resulting in the formation of a series of extractable nitro-nitrato complexes. [3, 4] The improvement of the decontamination of uranium and plutonium being an important goal for future reprocessing plants, it becomes crucial to well understand and simulate the behaviour of this element in the extraction cycles of the PUREX process. Thus, the purpose of the present work is to investigate the extraction of ruthenium by 30% TBP diluted in TPH at T=298.15 K. Batch solvent extraction experiments of ruthenium were first carried out to determine accurate distribution data at different nitric acid and uranium concentrations. From these extraction isotherms, a physico-chemical model was proposed to describe ruthenium extraction by TBP. Simple solutions theory and Sergievskii-Dannus model were used to take into account deviations from thermodynamical ideal behaviour, in aqueous and organic phase respectively. After implementation in the CEA PAREX code [5], this model was tested to simulate the experimental distribution ratios measured from a genuine high active solution as well as the concentration profiles of 106Ru measured after a PUREX hot test in mixer-settlers.
2. Experimental and modelling
2.1. Distribution data acquisitions from surrogate solutions Reagents
TBP was purchased from Prolabo and diluted to 30 vol. % in TPH (hydrogenated tetrapropylene, Novasep process) and purified by successive contacts with equal volumes of 0.1 M sodium hydroxide, 0.3 M sodium carbonate and water. Solutions of 5×10⁻³ M RuNO were prepared at different nitric
acid concentrations from 0.1 to 6 M by dissolution of
RuNO(NO3)3 (provided by Alfa Aesar) in HNO3 and were used
for ruthenium extraction experiments. The ruthenium stock solutions concentrations were checked by ICP-OES (Optima 8000 from Perkin Elmer). As low concentrations of ruthenium are difficult to measure in organic phase, aqueous solutions were spiked with 106Ru (10-7 M) and ruthenium concentration was determined by gamma spectrometry. On the one hand, commercialized 106Ru diluted in chlorhydric acid (provided by Eckert and Ziegler) was used to spike Ru solutions while on the other hand, 106Ru was isolated by several batch extractions from a high active solution recovered from a spent UOX fuel (burn-up 60 GWd.t-1). To equilibrate the speciation of ruthenium in aqueous solution (especially the formation of trinitrato complexes) prior to the solvent extraction experiments, spiked solutions of Ru in nitric acid were heated at 90°C for one hour with a reflux condenser to trap the volatile compound RuO4.
After preparation, the speciation of RuNO(NO3)3 solutions was
checked by UV-visible spectrophotometry (Cary 5, Agilent). Solutions with nitric acid, ruthenium and uranium were prepared from a concentrated uranium stock solution (363 gU.L-1 in 0.24 M HNO3) supplied by AREVA. Its concentration
was determined by X-Ray fluorescence (Quant’X from ThermoScientific). The same experimental protocol was applied for spiking and equilibrating the Ru-U aqueous solutions. All other high grade chemical reagents (HNO3,
NaOH, EtOH, …) were purchased from Prolabo and used without further purification.
Solvent extraction experiments
Solvent extraction experiments were performed by contacting equal volumes of organic phase and Ru (or Ru-U) aqueous solutions in nitric acid for one hour at T=298.15 K (controlled by a water bath). For experiments without uranium, organic
phases were pre-equilibrated with aimed nitric acid solutions prior to the extraction to prevent nitric acid transfer during experiments. After centrifugation, the two phases were separated and aliquots were sampled for analysis. Water concentration in the organic phase was determined by Karl-Fischer coulometric titration (Metrohm KF 831). Nitric acid concentrations in aqueous and organic phases were measured by acid-base titration against 0.1 M NaOH solution, by diluting the aliquot in water and water/ethanol mixture (50/50%vol)
respectively or in saturated ammonium oxalate in presence of uranium. Uranium concentration in organic phase was determined by UV-vis. spectrophotometry. Ruthenium-106 activities in aqueous and organic phases were measured by gamma spectrometry (Hyper pure Ge detector, CANBERRA). The distribution ratio of ruthenium (D) is defined according to equation (1):
(1)
where and A are the radioactivities of the 106Ru, respectively in the organic and aqueous phase (expressed in terms of decays per unit volume per second). It is assumed from previous experiments that D-values between 0.1 and 10 exhibit a maximum error of about 5% while the error may be up to 10% for lower (0.01-0.1) and higher (10-100) values.
2.2. Modelling
Speciation studies are usually based on a liquid-liquid extraction method to determine the stoichiometry of organic complexes. The solutions generally used in the actinides separation processes are too complex and too much concentrated to make the approximation that thermodynamical activities are equal to concentrations. Thus, a thermodynamic approach based on the simple solutions theory and Sergievskii-Dannus model to take into account deviations from
thermodynamical ideal behaviour, respectively in aqueous and organic phase, is known to be very efficient to model the thermodynamic behaviour of electrolytes in spent nuclear fuel solutions. [6, 7]
Theory
Ruthenium is assumed to be present as RuNO(NO3)3 in a
dissolution solution of spent nuclear fuel in nitric acid. [8-10] Extraction of ruthenium by TBP can thus be written according to equilibrium (2):
(2)
where the overlined species refer to the organic phase.
According to the mass action law, the extraction constant , ( = ruthenium complexes in organic phase) associated with this equilibrium can be written as:
(3)
where aX and are thermodynamic activities of species in
aqueous and organic phase, respectively. The stoichiometric coefficients of TBP, nitric acid, Ru and water in organic complexes are i, j, k and h, respectively.
Deviation from ideal behaviour in aqueous solutions
Simple solution theory can be used to take into account deviation from ideal behaviour in aqueous solutions [11]. The simple solution concept can be stated by the Zdanovskii-Stokes-Robinson relation (ZSR rule) which associates the concentrations of the constituent electrolytes with their concentrations in the binary solution of the same water activity as the mixture: [7]
at a
H2O = cst (4)
where mXis the molality (mol.kg-1) of the electrolyte X in the
mixture, mXbiis the molality (mol.kg-1) of the electrolyte in a
binary solution of the same water activity as the mixture and
aH2Ois the water activity of the mixture.
If binary data are available for the solutes and considered mixtures satisfy the “simple” solution concept [12], the ZSR relation can be applied directly to calculate the water activity of the mixture iteratively. Moreover, for mixtures for which this rule can be applied, Mikulin demonstrated that the activity coefficients of electrolytes can be expressed as a function of the mixture composition and the compositions of binary mixtures of the same water activity: [7]
(5)
where and are the stoichiometric mean activity coefficients of the electrolyte X, respectively in the mixture and in the isopiestic binary solution, mX and mX
bi
are the molalities (mol.kg-1) of the electrolyte, respectively in the mixture and in the isopiestic binary solution, νX is the sum of the
stoichiometric coefficients of the electrolyte.
Deviation from ideal behaviour in organic solutions
In the literature, water has a prominent role on deviations from ideality in organic phase. [13, 14] Indeed, organic species can be associated with water molecules in two types of interactions: hydration water that forms hydrated complexes of well-defined stoichiometry and solubilized water resulting from non-ordered interactions between the species and water in the organic phase. To take into account both types of interactions, activity
coefficients of organic species are calculated according to Sergievskii–Dannus relationship: [6]
(6)
where denotes the activity of species X in the organic phase and corresponds to the solubilized water resulting from non-stoichiometric hydration species, in the same organic phase (same diluent and same extractant concentration) but in equilibrium with pure water (aH2O = 1). By substituting
equation (6) in equilibrium (3), and assuming that the ratio
is constant with the extraction isotherm (i.e. for a given concentration of extractant), it is possible to define for each distribution equilibrium an effective constant :
(7)
The term characterizes mainly the deviation from ideal behaviour resulting from interactions between the species X and the diluent. Considering the ratio as constant for a given proportion of TBP/TPH is a usual assumption when applying the Sergievskii–Dannus model because these individual values cannot be calculated. [6, 7] Indeed, for a constant TBP/TPH ratio, it can be assumed that the influence of the diluent on the organic complexes and the extractant can be neglected.
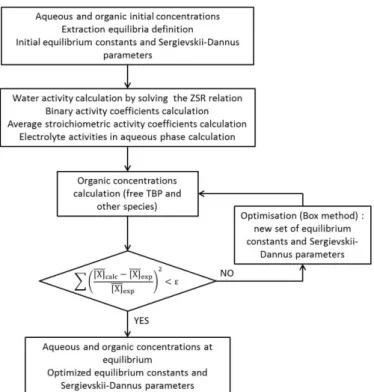
Method of modelling
Calculations for extraction isotherms modelling were performed using the Scilab 5.4.1 software. The calculated concentrations were determined by an iterative method based on least-squares analysis. The following criterion was minimized, comparing the experimental values of the molal concentration with the one obtained by the model:
(8)
Experimental ruthenium, water and nitric acid concentrations were measured in both phases at equilibrium. The results were used to calculate water, nitric acid and ruthenium thermodynamic activities in the aqueous phase. Water activity was calculated by an iterative method based on dichotomy resolution of equation (4). The molal concentration of each solvate and the total molal concentrations of ruthenium
( ), nitric acid ( ), TBP ( ) and water ( ) in the organic phase were calculated with the Scilab program according to the mass action law and mass balances associated to each component. To model the extraction isotherms, various hypotheses were put forward about stoichiometry of each organic complex. The stoichiometry that was tested for each complex was chosen to be consistent with previous published results. [9] The stoichiometries used for the model was those which gave the best agreement between experimental and calculated concentrations, corresponding to the minimum value of χ2
. The resolution method applied is shown in Figure 1.
Figure 1: Flowchart showing the resolution of ruthenium solvent extraction modelling using the Scilab software
2.3. Batch experiments from a genuine solution
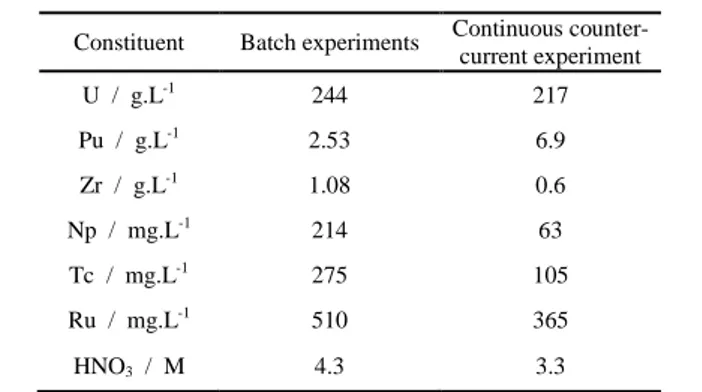
Single-stage batch experiments were carried out to determine the distribution ratios of ruthenium from a genuine dissolution solution of spent fuel which composition is shown in Table 1. Desired volumes of the organic and aqueous phases were vigorously shaken and after separation, organic and aqueous phases were sampled for analysis (see part 2.1). Uranium concentrations and 106Ru activities were measured by X-ray fluorescence and gamma spectrometry respectively. Operating conditions for batch experiments are summarized in Table 2.
Table 1: Composition of the feed solution for batch and continuous counter-current experiments
Constituent Batch experiments Continuous counter-current experiment
U / g.L-1 244 217 Pu / g.L-1 2.53 6.9 Zr / g.L-1 1.08 0.6 Np / mg.L-1 214 63 Tc / mg.L-1 275 105 Ru / mg.L-1 510 365 HNO3 / M 4.3 3.3
Table 2: Operating conditions for batch experiments
Run Organic phase Aqueous phase O/A 1 - Main
extraction
TBP pre-equilibrated with 6 M HNO3
High active feed solution (see Table 1)
2.5
2 - FP scrub From 1 HNO3 5 M 2
2.4. Continuous counter-current test on a genuine solution
A flowsheet of a first PUREX process cycle was tested in laboratory-scale mixer-settlers at Cyrano shielded cell of CEA Fontenay-aux-Roses. MOX and UOX fuels, respectively discharged from Beznau and Fessenheim nuclear reactors, were dissolved in nitric acid and used as feed solution for the hot test. The composition of the feed solution is shown in Table 1. The flowsheet of the counter-current experiment is depicted in Figure 2.
The test was performed in 32 stages of Cyrano type PMMA (polymethylmethacrylate) laboratory-scale mixer-settler. Stainless steel perforated paddle impellers were used for mixing. All reagents were introduced by syringe pumps. Flow rate measurements were performed using volumetric flowmeters.
On-line UV-visible spectrophotometric measurements were implemented to measure uranium concentrations in the aqueous and organic phases during the test. [15] Samplings were also performed to analyse U, Pu, and H+ concentrations in aqueous
outputs. At the end of the test, aliquots of both aqueous and organic phases were sampled in each stage and analysed by acid-base titration, ICP-AES, gamma and alpha spectrometry to obtain experimental profiles.
Figure 2: PUREX flow sheet tested in mixer-settlers
3. Results
3.1. Distribution data from Ru surrogate solutions
Absorption spectrum of initial ruthenium solutions were first acquired and compared to check the influence of the nature of
106
Ru tracer on the Ru aqueous speciation. The absorption spectrum of an aqueous solution of ruthenium nitrosyl spiked with 106Ru from a genuine high active solution is identical to an
inactive aqueous solution of ruthenium nitrosyl. while absorption spectrum is clearly different if 106Ru arose from a commercialized source (Figure 3). Because commercialized
106
Ru is provided in 6 M HCl, the differences are attributed to interactions between ruthenium nitrosyl and Cl- ions. In some experiments, because of the dilution factor of the 106Ru stock solution, Cl- molar concentration can reach 0.2 M. To confirm this assumption, an aqueous solution of ruthenium nitrosyl was prepared and spiked with HCl to reach 0.2 M. The black curve in Figure 3 shows that ruthenium nitrosyl speciation changes can accurately be attributed to the presence of HCl, probably
due to the formation of RuNO(NO3)3-x(Cl)x complexes [16]
which may impact the extraction of ruthenium in organic phase.
Figure 3: Absorption spectra at T=298.15 K. of equilibrium mixtures of RuNO complexes in nitric acid (CRu ~ 500 mg.L-1 and HNO3 ~ 3 M. ― : RuNO(NO3)3 +
commercialized 106Ru diluted in HCl ([HCl] ~ 0.2 M). ― : RuNO(NO3)3 + HCl ([HCl]
~ 0.2 M). ― : RuNO(NO3)3 + high active solution. ― : RuNO(NO3)3.
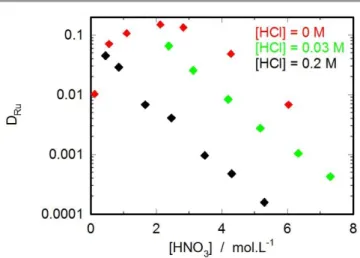
Solvent extraction experiments were performed by spiking inactive Ru solutions with various amounts of commercialized
106
Ru (different dilution factor of 106Ru stock solution, i.e. different HCl concentrations), or with 106Ru isolated from the high active solution ([HCl] = 0 M). Figure 4 shows that Ru distribution ratio is strongly influenced by Cl- concentration: ruthenium extraction is significantly lower when Cl -concentration increases, which is in agreement with literature data. [17]
Distribution data obtained without HCl are similar to those reported in reference [18] which confirm that the use of 106Ru from spent fuel treatment is the best way to reproduce ruthenium behaviour in reprocessing process. This method was thus used for the whole distribution experiments performed in this part.
Figure 4: Ruthenium experimental distribution ratios for various HCl concentrations for H2O/HNO3/RuNO(NO3)3/TBP/TPH system at T=298.15 K.
The variation of experimental values of DRu is plotted on Figure
6 (and also on Figure 4) as a function of nitric acid concentration. First, DRu increases with HNO3 concentration
probably due to the formation of trinitrato Ru species in aqueous phase, which are highly extractable in organic phase. Then, beyond 2 M HNO3 ruthenium distribution ratio decreases
due to the competition between Ru and HNO3 extraction by
TBP. Experiments were also carried out at 3 M HNO3 for
different initial uranium concentrations (ranging from 0 to 220 gU.L
-1
) in order to check the impact of uranium loading (TBP saturation) on ruthenium extraction (see Figure 8). The results clearly show the drastic decrease in DRu with increasing
uranium organic concentration (or TBP saturation) explained by a saturation effect (decrease in free TBP concentration).
3.2. Modelling results
The data given in [19] were used for the modelling of water and nitric acid extraction by TBP. The complexes and the corresponding parameters and associated to the
extraction equilibrium are reported in Table 3. These values were then held fixed when modelling water, nitric acid and ruthenium extraction isotherms. The calculated concentrations
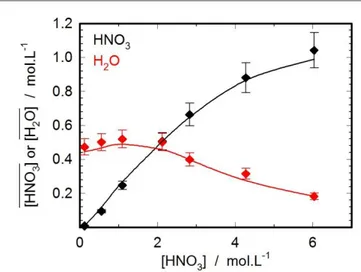
of nitric acid and water in organic phase are plotted on Figure 5 as a function of the aqueous nitric acid concentration. A very good agreement is obtained between calculated and experimental values.
Table 3: Optimized parameters for H2O/HNO3/TBP/TPH system
Species - 0.3 2.32 10-2 4.2 7.58 10-2 0.01 3.81 10-1 0.3 2.81 10-2 0.5
As shown on Figure 6, ruthenium extraction by TBP was then correctly represented with two organic complexes
and , in
addition to the species mentioned in Table 3. The complexes and corresponding parameters and are reported in Table
4.
Table 4: Optimized parameters for H2O/HNO3/RuNO(NO3)3/TBP/TPH
system Species 0.016 0 0.107 0
Ruthenium speciation diagram (Figure 7) shows the predominance of the complex from 0.1 to 4 M HNO3, which is consistent with previous published
results. [9, 20] Beyond 5 M HNO3,
becomes predominant because of the decrease in free TBP concentration.
Ruthenium distribution ratios at 3 M HNO3 were also
calculated by this model for increasing concentrations of uranium. Figure 8 compares calculated and experimental DRu
acquired in this study and in ref. [21], plotted as a function of
uranium loading (TBP saturation by uranium extraction). Batch experimental data obtained here are in good agreement with Bruce’s experimental results. [21]
The model fits correctly the decrease in ruthenium extraction with uranium loading but slightly overestimates ruthenium distribution ratio at high uranium saturation.
Figure 9 depicts the ruthenium calculated distribution ratio as a function of the uranium saturation of the solvent and nitric acid concentrations in aqueous phase. This figure clearly shows that the extraction of ruthenium is maximal around 2 M HNO3 and
without uranium.
Figure 5: Experimental (♦) and calculated (―) nitric acid molarities and experimental (♦) and calculated (―) water molarities versus nitric acid concentration in aqueous phase for H2O/HNO3/RuNO(NO3)3/TBP/TPH system at T=298.15 K.
Figure 6: Experimental (♦) and calculated (―) ruthenium distribution ratios versus nitric acid concentration in aqueous phase for H2O/HNO3/RuNO(NO3)3/TBP/TPH system at T=298.15 K. ◊: Natarajan’s work [18]
Figure 7: Ruthenium speciation diagram for the H2O/HNO3/RuNO(NO3)3/TBP/TPH
system at T=298.15 K.
Figure 8: Ruthenium distribution ratios versus uranium saturation of the solvent for H2O/HNO3/RuNO(NO3)3/TBP/TPH system at [HNO3]=3 M and at T=298.15 K.
♦: Experimental at [HNO3]=3 M. ◊: Bruce’s work at [HNO3]=3 M. [21] ―: Calculated
at [HNO3]=3 M.
Figure 9: Calculated ruthenium distribution ratio as a function of uranium saturation of the solvent and nitric acid concentrations in aqueous phase at equilibrium.
3.3. Batch extraction experiments from a genuine solution
The model was then implemented into the CEA PAREX code
[22]
and used to calculate the DRu obtained in batch conditions
from a genuine solution of spent nuclear fuel in the conditions of the PUREX process. Experimental and calculated values are reported in Table 5 and show that calculated distribution ratios are consistent with the experimental values. The model however slightly overestimates ruthenium extraction as already observed in the previous experiments from surrogate solutions in presence of uranium (Figure 7). On the other hand, ruthenium distribution ratios are largely under-estimated by the
PAREX code in scrubbing conditions. This difference is explained by the retention of ruthenium in organic phase once extracted by TBP [10], which is not yet taken into account in the model.
Table 5: Comparison between ruthenium distribution ratios calculated using the CEA PAREX code and those obtained after batch experiments on a genuine solution. In parenthesis: calculated with the CEA PAREX code.
Run 1 – Main extraction 2 – FP scrub DRu exp 2.8.10-4 0.19
DRu calc 5.2.10-4 2.1.10-3
[ ] / g.L-1 91 (90) 81 (80)
[HNO3] / M 5.9 (5.9) 2.3 (2.3)
3.4. Continuous counter current test on a genuine solution
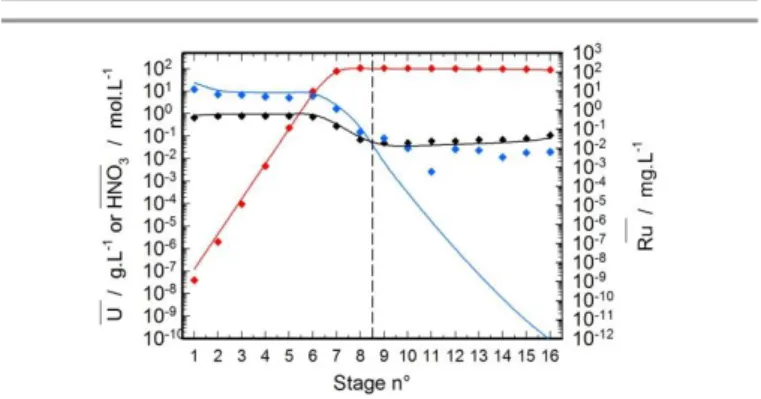
The model was then used to reproduce the nitric acid, uranium and ruthenium concentration profiles measured in aqueous and organic phase in every stage of the main extraction and FP scrubbing steps of the PUREX hot test. The experimental and calculated profiles of nitric acid, uranium and ruthenium are plotted in Figure 10 and Figure 11. The good agreement obtained between experimental and computed profiles through the main extraction stages confirms the validity of the model in these conditions. Ruthenium and nitric acid concentrations in organic phase remain stable from stage numbers 1 to 6 and sharply decrease at stages 7 and 8 due to uranium saturation (decrease in free TBP concentration). However, except for stage n°9, the phenomenological model does not correctly reproduce the profiles in the FP scrubbing step. Here again, the lack of simulation is due to the retention of ruthenium in organic phase, observed experimentally in batch conditions and not modelled yet. Ruthenium being strongly extracted in organic phase as a species that can be hardly stripped, its extraction is thus logically under estimated in these conditions.
Figure 10: Experimental and calculated profiles of nitric acid in mol.L-1 (♦ and ―),
uranium in g.L-1 (♦ and ―) and ruthenium in mg.L-1 (♦ and ―) in aqueous phase at the end of the test in the main extraction and FP scrub battery
Figure 11: Experimental and calculated profiles of nitric acid in mol.L-1 (♦ and ―), uranium in g.L-1 (♦ and ―) and ruthenium in mg.L-1 (♦ and ―) in organic phase
4. Conclusions
Extraction isotherms modelling using simple solutions theory to calculate activity coefficients in the aqueous phase via Mikulin equation, and Sergievskii–Dannus relationship for activity coefficients of organic species, was performed to study water, nitric acid and, for the first time, ruthenium nitrosyl nitrate extraction by TBP 30%vol in TPH. The model leads to
consistent data with batch experiments for the extraction of ruthenium, water and nitric acid. The best consistency between experimental and calculated ruthenium distribution ratios was obtained by considering two ruthenium complexes in the organic phase: and
. Concentrations of ruthenium were measured at the end of a continuous hot test in mixer settlers using a genuine aqueous solution from spent nuclear fuel. Results show that this model is able to accurately represent ruthenium concentration profiles in the extraction part but the retention in the organic solvent is not yet reproduced by the model. In the near future, the phenomena responsible for ruthenium retention in a loaded TBP organic solvent have to be clearly explained to improve our understanding and simulation of ruthenium decontamination during nuclear fuel reprocessing operations.
5. Acknowledgements
The authors are grateful to L. Chareyre for her valuable support for 106Ru experiments and also to S. Michaud for the modelling of water, nitric acid and uranium extraction. The authors express their thanks to Dr. A. Salvatores for his explanations and fruitful discussions on the work related to the extraction of
ruthenium. The authors want also to acknowledge AREVA NC for financial support through the PAREC project.
References
1. Schulz, W.W. and Navratil, J.D., Science and Technology of Tributyl Phosphate. Synthesis, Properties, Reactions and Analysis. Vol. I. 1984, Boca Raton, Etats-Unis: CRC Press, Inc. 2. Pruett, D.J., Solvent extraction behaviour of ruthenium nitrosyl
nitrate in nitric acid-tri-normal-butyl phosphate systems. Abstracts of Papers of the American Chemical Society, 1980.
179(MAR): p. 129-NUCL.
3. Fletcher, J.M., et al., Nitrato and Nitro Complexes of Nitrosylruthenium. Journal of Inorganic & Nuclear Chemistry, 1955. 1(6): p. 378-401.
4. Swain, P., et al., Separation and recovery of ruthenium: a review. Journal of Radioanalytical and Nuclear Chemistry, 2013. 298(2): p. 781-796.
5. Montuir, M., et al., Parex simulation code: an efficient tool to model and simulate solvent extraction operations. ISEC'11, 2011. 6. Mokili, B. and Poitrenaud, C., Modeling of Nitric-Acid and Water
Extraction from Aqueous Solutions Containing a Salting-out Agent by Tri-n-Butylphosphate. Solvent Extraction and Ion Exchange, 1995. 13(4): p. 731-754.
7. Mokili, B. and Poitrenaud, C., Modelling of the extraction of neodymium and praseodymium nitrates from aqueous solutions containing a salting-out agent or nitric acid by tri-n-butylphosphate. Solvent Extraction and Ion Exchange, 1996. 14(4): p. 617-634.
8. Boswell, G.G.J. and Soentono, S., Ruthenium nitrosyl complexes in nitric acid solutions. Journal of Inorganic and Nuclear Chemistry, 1981. 43(7): p. 1625-1632.
9. Rozen, A.M., Kartasheva, N.A., and Nikolotova, Z.N., Extraction of Nitrosoruthenium by Tributyl-Phosphate. Radiochemistry, 1995. 37(3): p. 213-219.
10. Siczek, A.A. and Steindler, M.J., Chemistry of Ruthenium and Zirconium in the Purex Solvent-Extraction Process. Atomic Energy Review, 1978. 16(4): p. 575-618.
11. Moeyaert, P., et al., Modeling and speciation of uranium (VI) and technetium (VII) co-extraction with DEHiBA. Inorganic Chemistry, Submitted.
12. Ruas, A., et al., Uranyl(VI) nitrate salts: Modeling thermodynamic properties using the binding mean spherical approximation theory and determination of "fictive" binary data. Journal of Physical Chemistry B, 2006. 110(7): p. 3435-3443. 13. Rozen, A.M. and Andrutskii, L.G., Mathematical model of the
extraction of water by tributylphosphate and a monosolvate of nitric acid in diluents. Russian Journal of Inorganic Chemistry, 1981. 26(10): p. 1502-1506.
14. Rozen, A.M., et al., Mathematical model of the extraction of microquantities of Tc(VII) by tributyl phosphate. Atomnaya Ehnergiya, 1987. 63(3): p. 175-178.
15. Bollesteros, M.J., et al., Implementation of americium separation from a PUREX raffinate, in Atalante 2012 International Conference on Nuclear Chemistry for Sustainable Fuel Cycles, C. Poinssot, Editor. 2012, Elsevier Science Bv: Amsterdam. p. 178-183.
16. Fletcher, J.M., Chemical principles in the separation of fission products from uranium and plutonium by solvent extraction. Process Chemistry, ed. P.i.N.E.S. III. 1961. 446.
17. Blicharska, M., et al., Separation of fission produced Ru-106 from simulated high level nuclear wastes for production of brachytherapy sources. Journal of Radioanalytical and Nuclear Chemistry, 2013. 298(3): p. 1713-1716.
18. Natarajan, R., et al., Optimization of Flowsheet for Scrubbing of Ruthenium during the Reprocessing of Fast Reactor Spent Fuels. Separation Science and Technology, 2013. 48(16): p. 2494-2498.
19. De Sio, S., et al., Contribution of extraction isotherms modeling based on the Mikulin-Sergievskii-Dannus approach to the speciation of plutonium(IV) in TBP 30%/dodecane. Radiochimica Acta, 2013. 101(6): p. 373-377.
20. McKay, H.A.C., Tributyl phosphate as an extracting agent for the nitrates of the actinides elements. Process Chemistry, ed. P.i.N.E.S. III. 1961.
21. Bruce, F.R., The behaviour of fission products in solvent extraction processes. Process Chemistry, ed. P.i.N.E.S. III. 1961. 22. Sorel, C., et al. The simple solution modeling implemented in the
PAREX code to simulate solvent extraction operations. in Global 2011. 2011.
![Figure 8: Ruthenium distribution ratios versus uranium saturation of the solvent for H 2 O/HNO 3 /RuNO(NO 3 ) 3 /TBP/TPH system at [HNO 3 ]=3 M and at T=298.15 K](https://thumb-eu.123doks.com/thumbv2/123doknet/13122969.387595/10.892.68.433.415.692/figure-ruthenium-distribution-ratios-versus-uranium-saturation-solvent.webp)