HAL Id: cea-02509184
https://hal-cea.archives-ouvertes.fr/cea-02509184
Submitted on 16 Mar 2020
HAL is a multi-disciplinary open access
archive for the deposit and dissemination of
sci-entific research documents, whether they are
pub-lished or not. The documents may come from
teaching and research institutions in France or
abroad, or from public or private research centers.
L’archive ouverte pluridisciplinaire HAL, est
destinée au dépôt et à la diffusion de documents
scientifiques de niveau recherche, publiés ou non,
émanant des établissements d’enseignement et de
recherche français ou étrangers, des laboratoires
publics ou privés.
technique
R. Haudebourg, P. Fichet, F. Goutelard
To cite this version:
R. Haudebourg, P. Fichet, F. Goutelard. Radiological mapping of nuclear facilities under
dismantle-ment drawn up by Digital Autoradiography technique. GLOBAL 2015 - 21st International Conference
and Exhibition ”Nuclear Fuel Cycle for a Low-Carbon Future”, Sep 2015, Paris, France. �cea-02509184�
Radiological mapping of nuclear facilities under dismantlement
drawn up by Digital Autoradiography technique
R. Haudebourg, P. Fichet, F. Goutelard
CEA DEN DANS DPC SEARS LASE
CEA Saclay, CC171, 91191 Gif sur Yvette Cedex, France
Tel: +33 1 6908 1729, Fax: +33 1 6908 4323, Email: raphael.haudebourg@cea.fr
Abstract – Digital Autoradiography (DA) is a conventional technique for the detection and
quantification of radioactivity, commonly used in molecular biology research. It consists of the exposure of a radiosensitive flexible screen (a few hundred cm²) to β sources, such as mice sections with radioactive tracers (3H, 14C etc.) in it. After partial ionization, screens are scanned in a dedicated apparatus, which provides a quantitative image of the radioactivity distribution in the sample, in the form of black spots, shadows... Since 2011, this technique has been rerouted from molecular biology research to characterization of nuclear facilities to be dismantled. In this application, floors, walls, ceilings of the facility to investigate are fully or partially covered by batches of screens. After screen scanning and data processing, a radiological mapping of the facility can be obtained, in a reasonable time (roughly a few weeks for areas, often larger than 100 m²); moreover, the implementation of geostatistical tools can dramatically shorten this duration. This approach should systematically be inserted in the range of common methods of contamination detection and quantitation used in dismantlement projects, such as wipe tests, in-situ probe counting, and destructive laboratory analyses of samples from the facility. Indeed, DA is quantitative, sensitive to both labile and fixed contamination, and to both penetrating and non-penetrating radiations (α and low-energy β, such as 3H). Besides, it does not involve nuclear matter transportation, nor does it produce wastes (reusable screens), it requires neither power supply, nor operator presence during acquisition. Thanks to the accurate localization of potential contamination spots, it enables relevant and representative sampling for further destructive laboratory analyses of drilled cores, broken pieces and powders of facility construction material. Keywords: digital autoradiography, dismantlement, phosphor screen, tritium, alpha, beta
I. INTRODUCTION
At the end of its operating period, a nuclear installation must me shut down, decommissioned, and dismantled. This applies to all kinds of installations which hosted artificial nuclear activities, such as, first and foremost, power plants, but also radionuclides production and transformation units, research laboratories (including biomolecular research laboratories having used 3H or 14C as radioactive tracer), nuclear-powered ships, diagnosis sections in hospitals… The characterization of the radiological status of the installation is one of the key issues in decommissioning and dismantling. Indeed, related costs (operations, protection, radioactive wastes repository) are directly linked to activity level estimations. In order to operate decommissioning and to select waste stream in the most relevant way, measurements performed have to be representative and precise.
The first and most easy measurements performed during this characterization step aim at quantifying the
presence of γ (or X) emitters, using conventional instruments (Geiger Mueller counters, solid scintillators-based apparatus…). These measurements are, owing to their nature, able to provide both a fair estimation of γ/X activity levels with a fair representativeness (fast measurements in a dense screening).
α and β particles detection measurements are far more difficult to perform, due to the shorter length of their average path (excepted high energy β such as 36Cl or
90Sr/90Y, they cannot be remotely detected through
conventional counting techniques). Yet, the determination of the presence of such radionuclides is crucial in terms of environmental impact (most of them have a long decay period, β emitters such as 3H, 14C, 129I and 36Cl are highly
biocompatible, and α emitters have dramatic incidence on health when inhaled and/or ingested).
However, the representative and precise determination of nuclear installations potential contamination by these emitters at lowest costs remains to be technologically enabled. Indeed, every different approach chosen to reach
the values of their activities presents at least one inherent flaw:
conventional detection by contamination meters is irrelevant for non-penetrating particle detection (α, 3H, 14C); even in close contact (which implies apparatus
contamination hazards), 3H detection is difficult anyway (if not impossible);
recent developments on an α-camera is of highest interest but do not apply to β detection;
laboratory measurements performed by high-sensitivity liquid scintillation counting of wipes only refer to labile radioactivity (fixed radioactivity remains unknown);
direct sampling from facility floors and walls of drilled cores, broken pieces, or bush hammered powders, followed by laboratory processing (digestion and liquid scintillation counting, or pyrolysis) show, as well as for the above-mentioned wipe tests, a dramatic contradiction between representative sampling, requiring a dense screening of the facility, and diminution of study cost and duration, requiring the fewest amount of analyses possible.
In other words, there is, to our knowledge, neither apparatus nor method to simultaneously detect and selectively quantify α and low-energy β emitters (including
3H), whether it be labile or fixed, in a representative way,
with limited costs and terms.
One of the missions of the Laboratory of Analyses and Operators Support (LASE) of the French Atomic Energy Commission (CEA) is to provide accurate quantifications of activity levels in various nuclear wastes (nature, shape), and, more recently, in facilities under dismantling (floors, walls, furniture, piping etc.). Aware of the technological gap described above, the LASE has started developing a totally new approach, based on phosphor screen autoradiography, and presented in this paper.
II. GENERAL METHOD DESCRIPTION
II.A. Phosphor screen digital autoradiography
Autoradiography refers to any radiation detection method where a radiosensitive material (often a two-dimensional sheet) is exposed to the radiations (α, β, γ, X) of an active object, which rises the material to an electronically metastable state; after an arbitrary chosen exposition time, the sheet is exposed to a specific light, which brings back the material from the metastable to the ground electrical state (hence the qualification of phosphorescence for the mechanism, see figure 1). The material is chosen so that this de-excitation matches with the emission of visible light. Thus, the parts of the sheet which were exposed to radioactivity appear as spots on the image obtained after developing.
Fig. 1. Simplified phosphorescence mechanism used in autoradiography: exposition to a radioactive source induces electrical excitation of a radiosensitive material, and storage of a latent energy in metastable sites; this energy is extracted in the form of visible photon emission by an external stimulation by light, amplified, and detected
Digital autoradiography (DA) was developed in the late 80s as a substitute for conventional autoradiography, which was analogical, with disposable silver gel films as radiosensitive material. Those films were replaced by solid, flexible, reusable screens (see figure 2), scanned by a LASER to obtain a digital image (figure 3). The radiosensitive material consists of grains of BaF(Br,I):Eu2+
salt in a polymeric matrix. After exposure and scanning, a latent energy remains stored in the screen; the screen can be reset to its initial ground state by exposing it to an intense white light for a few minutes.
DA development was first and foremost intended to bio molecular research, which resorts to 3H and 14C (and,
to a lower extend, to 125I, 33P, and 35S) to label molecules, and locate their final location in animal bodies (mainly mouse). Therefore, screens composition was set to maximize sensibility to low-energy β (3H and 14C); their
micrometric structure and scanner device conception were chosen to refine resolution (pixel dimension is generally of a few 10 µm); their size was logically adapted to the dimensions of the samples to analyze (small animals sections), and usually range around 20 x 20 cm².
Most autoradiography scanners constructors are supplied by Fuji with phosphor screens (before possible reshaping); these screens are of 3 types: MS screens (for multi-sensitive) are general-purpose screens, SR screens (for super resolution) show a lower sensitivity but a better resolution, and TR screens (for tritium) are intended to the detection of 3H, and, to this end, are not coated with a thin
Fig. 2. Picture of a phosphor screen (type TR, Perkin Elmer): radiosensitive layer (blue) is around 100 µm thick,
backing layer (black) is around 350 µm thick
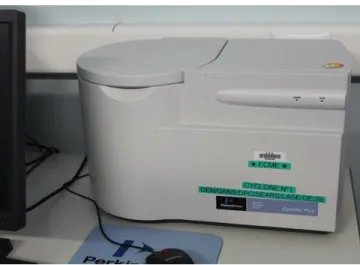
Fig. 3. Picture of the screen scanning device “Cyclone Plus” by Perkin Elmer;
scanning time at worst resolution (169 µm) is 4 minutes
II.B. First application to dismantling
The first studies carried out by the LASE aimed at detecting and localizing 3H contamination on concrete floors of neighboring installations at CEA Saclay. To this purpose, a phosphor screen scanning device (figure 3) was purchased at Perkin Elmer, with several batches of TR screens (12.5 x 25 cm²).
The method consisted of the following steps (see simplified diagram on figure 4):
1) initialization of a batch of screens (usually 20) by exposition to a white light for 5 minutes;
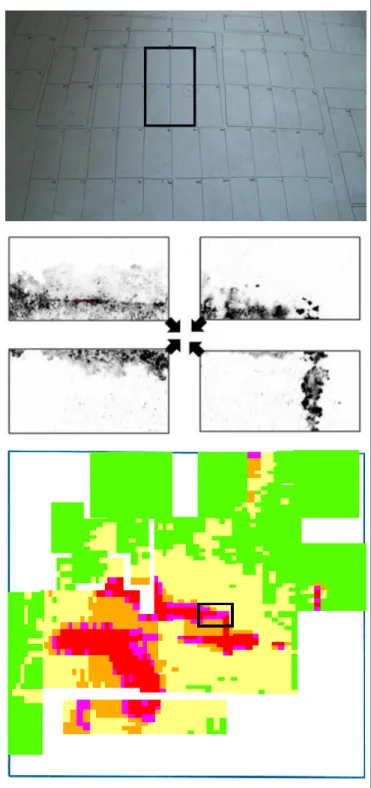
2) display of this batch of screens according to a precise grid previously drawn on the floor, as shown on figure 5 (top); screens were basically put radiosensitive face down, directly in contact with the ground; in this first development, the total area covered by one batch of screens was simply the number of screens in the batch multiplied by the area of one screen (0.03 m²);
3) exposition to the screens for an arbitrary chosen duration (usually one or two days);
4) withdrawal of the screens, and scanning (around 4 minutes per screen);
5) contamination spots could be located (figure 5, middle) during this step, and laboratory destructive analyses on targeted samples (pieces, powders, cores) could be immediately launched;
6) screens reset, and batch display in the following location; repetition of steps 2, 3, 4 and 5 until whole targeted area was investigated;
7) image processing, including binning, to reduce data size, standardization, to enable comparison of the different pixels (offset subtraction, conversion in raw data), and graphical presentation, for instant visualization of active areas (figure 5, bottom);
Fig. 4. Simplified proceeding diagram of the method; cycle period is usually one or two days
After laboratory analyses on targeted samples, contaminating radionuclide(s) and activity(ies) could be identified, thus back feeding the mapping with calibration. DA method accuracy concerning activities was estimated around 50%.
This method was applied for walls and ceilings investigations as well, with more cumbersomeness, due to the necessity to tape and untape the screens during the process.
Operators’ presence was not required during acquisition steps, which is a significant advantage in terms of radioprotection. The absence of nuclear waste production, and of nuclear matter transportation, and the fact that no power supply was necessary to operate, can be mentioned as practical advantages as well. The main drawback of the method remained the duration of its set up: less than a square meter could be investigated per batch and per cycle period with such an exhaustive screening, which was considered too small, compared to the area to analyze (often more than 100 m²). The next developments therefore consisted in implementing statistical methods to extract the same information with far fewer measurements.
Fig. 5. Earliest development of the method: top: picture of the concrete floor of the installation to investigate, with screen location; middle: example of four adjacent grey level images obtained after DA processing, revealing a 14C contamination spot;
bottom: radiological mapping after signal processing (raw data recovering, offset subtraction, and binning; confidential units)
III. CURRENT DEVELOPMENTS
A geostatistical method, based on variance analysis, was developed with Kartotrak© software. This allowed the statistical prediction of the signal that would be obtained with a screen, based on the actual signal obtained with neighboring screens; thus, only a fraction of the total area was directly investigated, while the rest was statistically deduced. Of course, the denser the screening remained, the more reliable the predictions were.
A nuclear installation (floor surface of around 200 m², figure 6, top) was recently investigated prior to decommissioning. Whereas it would have taken 320 cycles to investigate the whole surface with an exhaustive screening, such an installation could be analyzed by geostatistical DA within 46 cycles instead, for a comparable final result, as shown on figure 6 (bottom); this finally represented a characterization study of 2 months, which turned out to be a more reasonable duration in the context of dismantling.
Fig. 6. Latest development of the method: top: picture of the concrete floor of the installation to investigate (200 m²), zoned in 35; bottom: left: map of the installation, with the 35 zones; middle: results after DA processing (46 batches of 20 screens; white: non-directly-analyzed areas, green: below threshold areas, yellow/orange/red: signal levels, arbitrary units); right: results after calibration and geostatistical calculations (activity levels, confidential units)
IV. CONCLUSIONS
DA radiological mapping of nuclear installations to be dismantled appears to us as a relevant approach to locate potential contamination spots, with low cost (reusable screens), practical advantages (low operators’ exposure, no waste production, no nuclear matter transportation, no power supply, easy set up), reasonable duration (roughly one month per 100 square meters), exhaustiveness (in the limits of statistical predictions), and quantification ability.
Contrary to wipe tests, it is sensitive to both labile and fixed radioactivity, and contrary to contamination meters, it is sensitive to non-penetrating particles (including α, low-energy β such as 3H and 14C). Exhaustive mapping enables
representative sampling for further laboratory destructive analyses on drilled cores, broken pieces, bush hammered powders etc., which is of the highest necessity in this context.
Next developments will aim at the application of DA to the analyses of various nuclear wastes met in the context of dismantling, such as rubble, pieces of furniture, of piping, and of containers, and samples above mentioned. Another significant advance, under research, would be to be able to identify radionuclides without passing through a destructive analysis in the laboratory and a feedback, but rather directly with DA results: to this purpose, data obtained with a stacking of several screens, and appropriate algorithm, could provide useful information.