HAL Id: hal-01897931
https://hal.archives-ouvertes.fr/hal-01897931
Submitted on 18 Oct 2018
HAL is a multi-disciplinary open access
archive for the deposit and dissemination of
sci-entific research documents, whether they are
pub-lished or not. The documents may come from
teaching and research institutions in France or
abroad, or from public or private research centers.
L’archive ouverte pluridisciplinaire HAL, est
destinée au dépôt et à la diffusion de documents
scientifiques de niveau recherche, publiés ou non,
émanant des établissements d’enseignement et de
recherche français ou étrangers, des laboratoires
publics ou privés.
Expert System for topological remedial action discovery
in smart grids
A Marot, B Donnot, S. Tazi, P Panciatici
To cite this version:
A Marot, B Donnot, S. Tazi, P Panciatici. Expert System for topological remedial action discovery
in smart grids. MedPower, Nov 2018, Dubrovnik, Croatia. �hal-01897931�
Expert System for topological remedial action discovery in smart grids
A. Marot, B. Donnot, S. Tazi, P. Panciatici (RTE R&D)
Abstract— For power grid congestion management, lots of research have focused on using generation redispatching, load shedding or demand side management flexibilities. However, a less costly option would be grid topology reconfiguration. Branch switching has been previously explored, since it could be formulated as a linear programming optimization problem we can solve, and showed some benefits. This can further be extended to the broader class of non-linear nodal reconfigura-tions at substareconfigura-tions. In this paper, we present an expert system to automatically discover such topological remedial actions on congested grid states. It comes with a new adapted grid representation, conditional to the congestions of interest, which can be interpreted by operators. To test our expert system, we independently run it on thousands of realistic congested French grid states from 2012 to 2014 with a remedial action discovery success rate of 75%. Our exploration is quite efficient, since it is limited to single substation topological action and is usually successful on first try, even in the case of overloads above 30%.
I. INTRODUCTION
In the era of smart grids, new flexibilities are needed for congestion management to handle new power flow dy-namics without expanding the grid with heavy investments. Controlling injections seem the most intuitive way to deal with such congestions and has been widely explored [1], [2]. Nevertheless, it imposes some constraints on external actors such as producers to gain grid flexibility, which comes at a cost. But power flows are also determined and influenced by the grid topology. For TSOs who own and operate their grid, topology can be changed at negligible cost. But those changes are often highly non-linear and need more advanced algorithms to be controlled. Branch switching [3] is a first step in that direction. However it is only a percent of what could be done if considering a more general class of topology reconfiguration: nodal reconfiguration at substations. New remedial actions or more robust ones could be implemented. In communication networks, topology switching at high frequencies is a crucial aspect of information routing. In power grids however, we have been more cautious with such actions given the hazardous nature of electricity. Indeed there is an associated risk of short circuit that can be harmful or damaging for assets which has to be considered. Neverthe-less, some TSOs such as RTE, have been successfully using a fraction of possible topological remedial actions for years, thanks to operator studies and proper asset management.
In this paper, we are interested into curative topological actions. Our goal is to automatically offer our operators many efficient options to manage a stressed grid in a strategic manner, avoiding them the search of such options iteratively in a study as it is today. Our operators know some efficient ones by experience after many years of studies. But their breadth of search has been limited, and their understanding
is sometimes flawed by habits. Our expert system should assist them in understanding their problem under study in a specific context, and ultimately help them discover and use more strategical options. Indeed, it should :
- dynamically provide them on new situations a focused representation of the grid, conditioned on their problem.
- suggest them some initial solutions (single topological action) if they exist within that representation.
- allow them to go beyond the machine proposal and find more complex remedial actions based on this representation. Even in the case no toplogical remedial action is found, they can indeed interpret the visual representation to ap-prehend quickly the situation and the limits of this expert system, further guiding the search with more expertise.
This philosophy of collaborative human-machine interac-tions is actually a driver of a larger RTE R&D project, named Apogee, whose ambition is to build a personal assistant for our control room operators. Related to this work, previous work [4] have investigated labeling of historical operator preventive actions to learn from them. Unfortunately, few contingencies occur in reality. Hence not every curative actions can be observed. Currative actions that were not implemented cannot be learned in the same fashion, which justifies the need for this complementary avenue. Those two approaches however both rely on a same foundation: a counterfactual approach to replay realistic scenarios to learn from, which uses detailed power system simulators at our disposal on top of historical operational data.
The paper is organized as followed. Section II is dedi-cated to the method, where we describe our counterfactual approach coupled to some expert knowledge to rank a priori the most efficient topological actions. Section III illustrates our method on a didactic example: the IEEE14 case. Section IV further dives into the analysis of topological sensitivities. Section V eventually provides systematic results when run-ning our expert system on the French Power Grid, measuring its performance. Section VI gives conclusions.
II. METHOD A. Problem statement: Congested powerflow
In this section, we suppose that we have at our disposal a simulator Sim which, given injections vector and a reference topology (P bus, T opon), compute the power flows P fn on n lines in service, and detect k overloaded lines Ovn :
(Ovn, P fn) = Sim(P bus, T opon) (1) Those overloads create congestions that grid operators have to manage to ensure grid security. They indeed look
for topological actions t at substation b (atb ∈ AT opon),
changing the topology from its reference T opon, to relieve the k detected overloads such that Ovatb = 0:
(Ovatb, P fa t
b) = Sim(P bus, T opon at
b) (2)
In other words, we would like to route the flow of those congested paths towards other parallel electrical paths. In a meshed grid, we know they exist, since flows we observe are actually a superposition of flows, shared over multiple paths. But how can we detect them as we are only observing a resulting grid state of entangled flow superposition?
When interested in a specific variable, a proper way to discover what influences it is to directly intervene on it. Interventions have proven very useful in the field of causality [5]. In our case, ”what if” our overloaded line was not available? If power could not flow through it, where would it flow? This virtual flow distribution will actually unveil those latent mutually interacting parallel path with our power flows of interest, helping us identifying interesting topological spots to influence our congested flow. With a simulator at our disposal, let’s hence run this counterfactual reasoning through a topological sensitivity analysis by switching off our overloads Of f (Ovn) leading to n-k active lines:
(Ovn−k, P fn−k) = Sim(P bus, T opon Of f (Ovn
)) (3) (∆Ovn−k, ∆P fn−k) = (Ovn−k, P fn−k) − (Ovn, P fn)
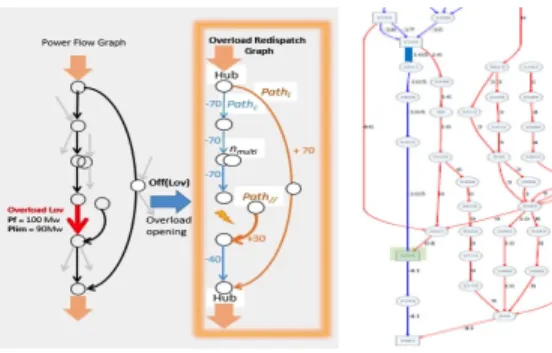
(4) B. Overload distribution Graph: a congested influence zone On top of this sensitivity results, we can now build a new representation of the grid, the ”Overload distribution Graph” (GOv). It is similar to the usual representation of
a directed power flow graph GP f over a grid, with the
same connectivity and directions, but whose edge weights are ∆P fn−k instead of P fn (see Figure 1). However it is
rather different as it is not a global graph over the grid, but it becomes a local influent zone when only considering sensitive flow distributions over a threshold th (th = 5% for French Power Grid), below which we truncate our GOv.
Fig. 1. On the left, two local grid representations around the overload: a zoomed GP f and the GOv. On GP f, grey flows are insensitive ones
to Of f (Ovn) and do not appear on G
Ov. On GOv, blue lines have
decreasing flow while red lines have increasing flow. Expert labels are represented. On the right, a real GOv example on case 6515rte. Congested
line l4815in dark blue and remedial substation Bus4225in green.
From our GOv, which defines a relevant influence zone to
explore, we want to identify topological spots to route our congested flow. To do so, we first extract some meaningful structure from the graph as on Figure 1 to reason on:
• the constrained P athc, that is the connected flow path
to the overload with negative distribution.
• upstream U a and downstream Da areas relative to the overload given the initial flow direction on GP f. • Parallel P ath// with positive distribution, paths that
supply similar loads downstream than P athc.
• Loop P athl, a P ath// also connected upstream to
P athc: flows are also supplied by similar productions. • local routing spots: Hub as nodes intersecting P athc
and P ath// or P athl, multi node substations nmulti
and Open circuit lines Loc.
Based on the detection of such structural elements, we can further identify 4 different GOv cases we can encounter:
• Looped GOv if we have at least one P athl • Parallel GOv if we have at least one P ath// • Multi Nodes GOv if we have at least one nmulti • Unmeshed GOv if there is no meshing option.
C. Expert knowledge: identifying routing buses
Let’s now introduce some expert knowledge to rank the topological actions that could help us route the flow differ-ently. It relies on two expert principles, that is modifying the relative impedance of electrical paths or creating a new injection pathway between 2 zones at different phase potentials. More specifically:
1) Hub are the most interesting spots because you can locally route flow by splitting nodes and pushing the incoming or outgoing injections towards P ath//,
connecting them together, while isolating from those injections our P athc, and as a result from our overload.
2) On P athc we would like to increase its impedance to
hinder the flow by node splitting or branch switching. 3) On P ath// we would like to decrease its impedance
to ease the flow. To do so we can merge nmulti or
switch on Loc.
4) Over Da on P athc, we might want to merge nmultior
switch on Loc as well but with the intent of bringing
power from elsewhere. Looking at nodal phase poten-tials, we can guess in which direction power will flow when merged. This tells us if it should be beneficial or not. Conversely for U a looking for loads.
D. Ranking topologies with Expert knowledge
We eventually assess by simulation topologies at sub-stations ranked along these categories 1 to 4. When two substations belong to the same category, we prioritize the one with the most ingoing or outgoing, negative or positive, flow distribution on GOv. In the case of Unmeshed GOv, topology
is inefficient, the only solution will be load shedding: we can hence detect infeasible cases.
Finally, for a given substation, we also rank topologies, as on Figure 2, since there are very often more than 20 possible
configurations with the same active lines. The main goal is to ”break” P athc, to increase this path impedance, setting
ingoing and outgoing P athc on 2 different nodes. Second,
you want to route as much flow as possible on P ath//.
Given those two principles, if you are on U a, you want to connect on one node outgoing P athc towards the overload
to non-sensitive ingoing and outgoing flows, plus local loads. On another node you connect the remaining sensitive flows, ingoing P athc, P ath//, and production. Conversely on Da.
Fig. 2. How to preferably reconfigure electrical nodes in U a or Da, given the related GOv elements for a given overload (bold blue), plus the local
productions and loads as well as the non-sensitive grey path.
Our overall expert system is finally depicted on Figure 3.
Fig. 3. Expert System Algorithm for topological curative action discovery.
III. ADIDACTIC EXAMPLE
A. The IEEE14 case
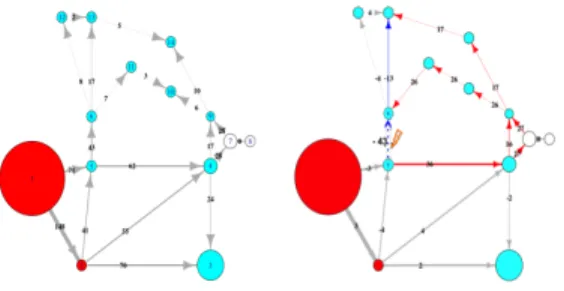
For illustration, we will consider the IEEE 14 power system and apply our algorithm to it. Considering line 10 connecting bus 5 to 6, an interconnection between the high voltage and low voltage grids, we can imagine it getting overloaded when load demand is high. We will hence study how to reroute part of this powerflow from our reference meshed topology as on Figure 4. While changing topology, we don’t want any line being turned off as it is often more robust to operate all of them to increase grid’s capacity. B. Overload Distribution Graph over linel5 → 6
From Figure 4, we can observe our influence graph after opening l5 → 6: this is a Looped GOv we computed through
Matpower [6]. The flow distribution highlights a zone of topological influence to consider, mainly the low voltage grid, while discarding the high voltage grid. More precisely, buses being discarded at this stage are: {1, 2, 3, 12}. In terms of structure on the graph, we identify several paths:
Fig. 4. IEEE14 system and its power flow on the left. Red nodes for production and blue for loads. On the right, our G10, the overload
distribution graph for our powerflow of P f5 → 6. Red edges for flow
increase, blue for flow decrease and grey for non-sensitive flows.
• P athc = 5 → 6 → 13 (U a = {5} and Da = {6, 13}) • P athl1= 5 → ... → 9 → ... → 6
• P athl2= 5 → ... → 9 → ... → 13 • Hubs = {5, 6, 13}
Over the P athl, we can further discard any substation that
is not a hub and whose topology is fully connected as a single electrical node, that are substations {4, 7, 8, 9, 10, 11, 14}. Indeed, as explained in Section II) C), while we would like to push more flow over such paths, we can only perform here a node splitting operation for those nodes, which will increase the path impedance and hence repel flows. Hence it will not ease the flow on l5 → 6 but load it even more.
C. Topology reconfiguration at Bus 5 and 6 as remedial actions
We are now left with buses on the constrained path here, especially our Hubs, to solve our problem. Bus6is the most
promising and ranked first as in section II) D), since it is a hub in the middle of P athc, which we can ”break” while
still supplying the loads from a parallel path, and it has a high ingoing distribution flow (45 MW). Being in Da, we perform the following node splitting on Bus6 (Figure 2) :
• connect the ingoing P athc to outgoing non sensitive
path and to local productions or ingoing flows, that is N ode1 = {10, 12}
• connect the ingoing P athlto outgoing P athc, and local
loads. that is N ode2 = {11, 13, load6}
This indeed results in a 15 MW decrease, corresponding to 30% of the initial power flow, which is quite effective. Of course, you should avoid making new congestions and monitor the powerflow on other loaded lines. load6 could
be switched to node 1 here as an alternative topology for a smoother flow distribution, resulting in a 4 MW decrease.
For the two remaining Hubs, Bus5 is better suited than
Bus13 since about 85% of our overload fictively got
redis-patched there based on GOv, compared to 40% at Bus13
after intervening on l5 → 6. Not to mention that Bus13cannot
be split into 2 nodes here while preserving a meshed grid, having only 3 lines and not a minimum of 4. Being in U a, we should perform the following node splitting on Bus5:
• connect the outgoing P athc to outgoing non influential
paths, that is N ode1 = {5, 10, load5}
• connect the outgoing P athlto local productions and to
maximum ingoing injection paths, so N ode2 = {2, 7} This indeed results in a 2.5 MW or 6% decrease. Another option could be connecting all outgoing paths on N ode1 = {5, 7, load5} and all ingoing paths on N ode2 = {2, 5}
resulting in a 6 MW decrease as on Figure 5 but it is more brutal as it changes the topology mesh and flow direction.
Fig. 5. Topology reconfiguration on IEEE14 at identified Hubs, Bus5and
Bus6. On the left, the flow distribution after Bus6 most promising node
splitting. On the left, the flow distribution after Bus5node splitting.
Topological reconfigurations at buses 5 and 6 happen to be potential remedial actions when line 10 gets overloaded. They are actually the only topological ones that keeps a meshed grid. We knew it a priori based on our expert system without any greedy search. Of course, this could be found by other methods on such a small example. But our method can hopefully scale to much larger grids, such as RTE French power grid with about 6000 buses, 500 of which having more than 7 connected power lines making the meshing more complex and the search space much bigger. If our method seems already effective, can we rank the topologies more formally, and interpret those results more globally?
IV. ANALYSIS OF TOPOLOGICAL SENSITIVITIES
A. From local expertise to global and formal analysis Beyond this expertize which helps prioritizing buses to look at qualitatively, we could investigate some theoretical foundation for it. Doing so, it could be possible to use more global quantitative measures to better rank the topologies.
We are interested into influencing power flows, which are mainly driven by active power. The DC approximation is often good enough to screen the space of flexibilities at our disposal with about 5% accuracy loss. Given Bbus, the Laplacian adjacency matrix, θ, the node potentials, and x, the line impedances, we have the following load flow equations: P bus = Bbus × θ + P busshif t (5)
P fij=
1 xij
(θi− θj− θshif t) (6)
Bbus being a Laplacian, we can compute its pseudo-inverse Bbus+(T opo) = [Fbus
1 | ... | Fmbus]. Bbus and
Bbus+ only depend on the topology T opo. Once computed,
we can actually get at every bus b the contribution factor Fbbus of every P bus to the potential θb.
θb = Fbbus× (P bus − P busshif t) (7)
Putting it into equation (6), and introducing P busshif ted = P bus − P busshif t, we have:
P fij=
1 xij
(Fibus− Fjbus) × P busshif ted
= P T DFij× P busshif ted
(8)
Here appears the well-known Power Transfer Distribution Factors (PTDF) used to study power flow sensitivity to injections. In our case, we are interested into Topology Dis-tribution Factors, an extension of Line Outage DisDis-tribution Factors (LODF). We can further get the contribution Cbus ij
of every P bus to each powerflow P fij on this grid state:
P fij = m X b=1 P T DFijb ∗ P busb shif ted= m X b=1 Cijb (9)
For a given topology T opon, we can hence detect the most influent P busk on P fij given their related contribution Cijb.
By selectively analyzing the evolution of those specific sen-sible influences (busb0 ∈ S(P fij)) under at
b, and discarding
others, we can get an estimate on how much our powerflow of interest changes, to anticipate at
b’s effectiveness a priori: S(P fij) = argminS0⊆Buses|S0| | |P fij−Pb0∈S0)C b0,n ij | P fij <= 10% (10) ∆P fa t b ij = m X b0=1 Cb 0,at b ij − m X b0=1 Cijb0,n ≈ X b0∈S(P f ij) (P T DFb 0,at b ij − P T DF b0,n ij )P bus b0 shif ted (11) Moreover, we can interpret more globally, and not only in terms of local flows, as we did based on our GOv, how
long distance injection influence evolves to explain a change in powerflow. This could be further understood as a relative change in effective resistance Req, between our overload and those influent injections, to highlight which path impedance really changed. Indeed Bbus+ and Req are closely related:
Reqij = Bbus+ii+ Bbus +
jj− 2Bbus +
ij (12)
In terms of computation, Bbus+(T opon at
b), and further
PTDF, coefficient can be computed efficiently, incrementally and with parallelism, from original Bbus+(T opon) under a topological change [7]. Authors in [8] give additional insights for interpretation by detecting flow cycles while defining a dual representation of the network.
B. IEEE14 case: topology sensitivity interpretation
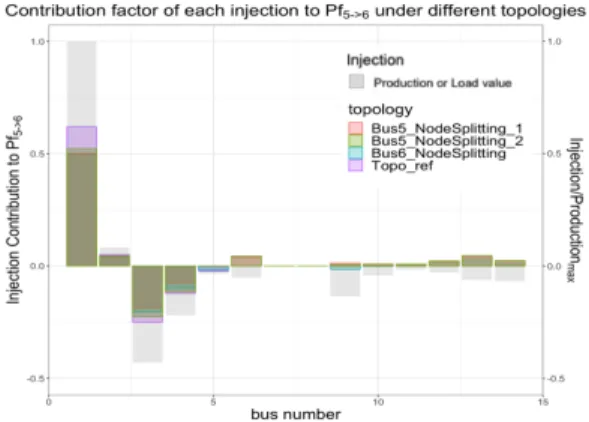
Based on this derivation, let’s compute our injection con-tributions on our IEEE14 example to interpret more deeply what happened under our influential topology changes. On Figure 6, one can see the contribution evolution of every
Fig. 6. Evolution of injection influence to P f56under different topologies
in colors, relatively to injection values in grey, to interpret topology impact.
injection to our powerflow P f56. P f56 is mostly driven by
the main production at bus 1, the loads at buses 6, 12,13,14 in the West consumption area. It also feels the loads at buses 3, 4 and 5 which rather pull the flow in the opposite direction, masking some of the influence of production 1. However, our powerflow does not feel the loads in the East Part of the grid because East and West are actually balanced, with similary meshed subgrids to supply them. In this case, we have S(P f56) = {1, 3, 4, 5, 6, 12, 13, 14}
When we change the topology at Bus6, the West Part
Load influence decreases and Bus9influence becomes
sensi-ble. Indeed, the electrical paths through Bus6became longer
with greater impedance, giving more importance to Bus9 to
now supply the loads all over the distribution grid, breaking the subtle subgrid balance. Contributions of production 1 and loads 3 and 4 diminishes consequently but proportionally. As a results we estimate ∆P fa1bus6
56 ≈ −10.8M W .
When we change topology at Bus5in the second
configu-ration, we make our line relatively closer to loads 3 and 4 and further from production 1 compared to previously. This pulls the flow in the opposite direction, hence decreasing it. This is even more true in the second node splitting configuration at bus 5 for which production 1 gets far away, leading to ∆P fa1bus5
56 ≈ −3.0M W and ∆P f a2
bus5
56 ≈ −5.6M W .
Even if our estimates are rough approximations on such a small grid, we can rank them a priori in the right order. Especially at Bus5where it was unclear which configuration
will be best a priori with only an understanding of interac-tions locally at this bus over our GOv on Figure 4.
V. RESULTS ONFRENCHPOWERGRID
We will now describe results on the larger grid of interest to us: the French Power Grid. We will present one more reproducible and relativeley difficult example over the Mat-power 6515rtecase. Finally, we will share systematic results of our expert system, after running it over thousands of situations, and discuss them.
A. One More Example: the 6515 RTE case
Four historical French Power Grid snapshots have been recently released [9]. Running through congested N-1
situ-ations over those cases, we looked for illustrative ones for our method. One was the following: on case 6515, after a contingency on l4816, l4815gets overloaded when setting the
thermal limit to its 95 MW value. The related Looped GOv
can be seen on Figure 1. The influence zone is quite large but we can extract from it our structural elements P athc,
P athl and Hub to guide our search: • P athl1= 2541 → ... → 3947 • P athl2= 2540 → ... → 3947 • Hubs = {2540, 2541, 3947}
Hub 3947 is the most promising, belonging to 2 looped paths. And indeed, there is a topological remedial action that has really been implemented on the grid in the past, with 2 electrical nodes leading to 12 MW decrease and resulting in a flow of 92 MW. Even if the bus is 3 hops away from our overload, and there can be many other buses to consider at this distance, it is the first choice of our expert system.It actually appears that is the only relevant one beside opening some lines. We here illustrated the expert system effectiveness at being selective even on a larger zone, proving to be really helpful in the remedial action search.
B. Systematic results on thousands of realistic cases To test our expert system systematically on a larger grid, we had to generate a realistic database of congested situations based on French historical snapshots between 2012 and 2014, given that we rarely observe any overloads on real snapshots. To be representative, we selected 9am, noon, 4pm, 7pm snapshots over the days, on which we run security analysis. We then studied the overloaded situations, with at least 2% overload, that could have occurred after a contingency. On average, there are 80 risky contingencies per snapshot to study, over 10.000 power lines.
To consider realistic topological actions, we restricted ourselves to the ones that have been applied at least once in a snapshot in the past. This makes 52.539 possible topologies over 6.091 substations. Our heuristic will only pick up to 20 topologies among these, up to 5 per substation, and try to find as many remedial actions as possible. We also tested up to 3 branch switching on P athc per congested situation.
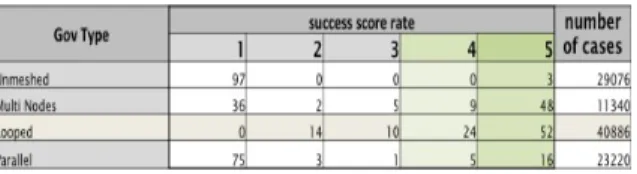
Scores from 1 to 5 are given to an action: 5 if every overloads disappeared, 4 if an overload disappeared without stressing the network, 3 if at least 30% of an overload was relieved, 2 if an overload was relieved but an other appeared or got worse, 1 as failed if no overloads were alleviated or if it resulted in some load shedding or production distribution. From the result table on Figure 7, we see that most of the feasible situations are Looped ones, meaning meshed local grids. In these situations, individual topological curative actions can be quite effective, with an overall success rate (score above 4) of 76% to relieve overloads.
Independently analyzing branch switching and nodal re-configuration, switching leads to a remedial action 55% of the time but if not, worsen the situation (score below 2) in 39%, while nodal reconfiguration helps in 64% cases with only 19% worsened situations from the result table on Figure 8. For Extra High Voltage overloaded lines (30% of
Fig. 7. Summary table of most efficient topological action found per congested situation (max 20 topologies explored over 5 substations) by our expert system on French Power Grid.
cases), success rate even reach 79% for nodal reconfiguration while branch switching remains at 57%. Finally, for VHV lines in cases of high overloads (above 30% of their thermal limit), we still manage to achieve a high success rate of 73% with nodal reconfiguration. This demonstrates that our expert system can be very effective at discovering single topological actions for meshed high voltage transmission grids. A control room operator can further implement such suggestions on a congested situation or compose more complex topology reconfiguration from those unitary results.
Fig. 8. Summary Table of most efficient topological action in Looped congested situations, depending on the type of topological action and the nature of the overload.
Finally, looking at the relevance of nodal topology recon-figuration ranking overall on Figure 9 bar plots, we notice that, when we find a solution for a meshed and complex situation (at least 10 actions tested on a congested situation), we can find a successful one for 70% of cases when testing up to 3 actions. The chances of success per action tested then decrease steadily with a deeper search. In terms of computation, it requires only 3 load-flows (which can be computed in parallel) to assess the relevance of these actions, in addition to a prior load-flow to build our GOv. The graph
analysis computation on GOv is negligible. When looking
closer at the substation ranking, we also notice a higher chance of success for the first chosen substation, above 50%, and a steady decrease to 20% chance for the 5th substation, when at least 3 substations have been explored. These results indicates that our expert system properly ranks the remedial actions a priori. Hence this demonstrates a good explo-ration strategy. This ranking could be further improved when coupled with distribution factor computations as defined in section IV) A), or with an existing remedial action database. C. Building knowledge on grid topology flexibility
Our expert system when run over many historical situa-tions can automatically initialize a database of topological remedial actions. In our systematic study, it discovered 29208 different remedial actions (different efficient action for each overloaded lines), over 2098 overloaded lines with
Fig. 9. On the left, histograms of the minimum load flow required to find a topological solution in congested situations in red, and of the number of successes per topology ranking in blue. On the right, success rate at a substation according to its ranking a priori, when at least 3 substations have been explored, summing to 14546 situations. Grey histogram showing the sample proportions of situations for a given substation exploration depth
a median of 8 remedial actions per line. These numbers could be further increased if considering actions that have not been implemented. It could hence highlight interesting nodal reconfiguration that were not considered, pushing forward the need for studying such flexibilities and maybe upgrading substation assets to enable its implementation.
VI. CONCLUSIONS
Our expert knowledge system proved to be successful by discovering topological remedial actions a priori, beyond branch switching, in a selective manner, relying on a simple local counterfactual reasoning and few load-flow computa-tions. The underlying ”distribution graph” can further be interpreted by a control room operator to discover more complex remedial actions. This successful counterfactual reasoning can also be jointly applied to the whole grid to represent overall zonal segmentation of it [10]. In terms of applications, our expert system can be used in real time to make remedial action suggestions or can help initialize a re-medial action database given historical snapshots. Systematic results on RTE’s French Transmission grid when applying our method highlighted the potential of topological actions to make smarter grids, making the point that such flexibilities deserve more research and studies in the future.
REFERENCES
[1] Kothari D. Pillay A., Karthikeyan S. Congestion management in power systems a review. International Journal of Electrical Power and Energy Systems, 2015.
[2] Djokic S. Gunda J., Harrison G. Remedial actions for security con-straint management of overstressed power systems. IEEE Transactions on Power Systems, 2018.
[3] Ferris M. Fisher E., O’Neill R. Optimal branch switching. IEEE Transactions on Power Systems, 2008.
[4] I. Guyon B. Donnot, A. Marot and al. Introducing machine learning for power system operation support. IEEE IREP conference, 2017. [5] J. Pearl. Causality. Cambridge university press, 2009.
[6] Matpower:steady-state operations, planning, and analysis tools for power systems research and education.
[7] Zhang Z.-L. Ranjan G. and Boley D. Incremental computation of pseudo-inverse of laplacian. Combinatorial Optimization and Applications, Springer, 2014.
[8] A dual method for computing power transfer distribution factors. [9] J. Maeght C. Josz, S. Fliscounakis and P. Panciatici. Ac power flow
data in matpower and qcqp format: itesla, rte snapshots, and pegase. ArXiv e-printsarXiv:1603.01533, 2016.
[10] A. Marot, S. Tazi, B. Donnot, and P. Panciatici. Guided machine learning for power grid segmentation. IEEE ISGT Europe, 2018.