HAL Id: hal-01480996
https://hal.laas.fr/hal-01480996
Submitted on 2 Mar 2017
HAL is a multi-disciplinary open access
archive for the deposit and dissemination of
sci-entific research documents, whether they are
pub-lished or not. The documents may come from
teaching and research institutions in France or
abroad, or from public or private research centers.
L’archive ouverte pluridisciplinaire HAL, est
destinée au dépôt et à la diffusion de documents
scientifiques de niveau recherche, publiés ou non,
émanant des établissements d’enseignement et de
recherche français ou étrangers, des laboratoires
publics ou privés.
Investigation of Al/CuO multilayered thermite ignition
Andréa Nicollet, Guillaume Lahiner, Andres Belisario, Sandrine
Assié-Souleille, Mehdi Djafari-Rouhani, Alain Estève, Carole Rossi
To cite this version:
Andréa Nicollet, Guillaume Lahiner, Andres Belisario, Sandrine Assié-Souleille, Mehdi
Djafari-Rouhani, et al.. Investigation of Al/CuO multilayered thermite ignition. Journal of Applied Physics,
American Institute of Physics, 2017, 121 (3), pp.34503 - 34503. �10.1063/1.4974288�. �hal-01480996�
1
Investigation of Al/CuO multilayered thermite ignition
Andréa Nicollet, Guillaume Lahiner, Andres Belisario, Sandrine
Souleille, Mehdi Djafari-Rouhani, Alain Estève, Carole Rossi
2
Abstract
The ignition of Al/CuO multilayered material is studied experimentally to explore the effect of heating surface area, layering and film thickness on the ignition characteristics and reaction performances. After the description of the micro-initiator devices and ignition conditions, we show that the heating surface area has to be properly calibrated to optimize the nanothermite ignition performances. We demonstrated experimentally that a heating surface area of 0.25 mm2 is sufficient to ignite a multilayered thermite film of 1.6 mm wide by a few cm long, with a success rate of 100%. A new analytical and phenomenological ignition model based on atomic diffusion across layers and thermal exchange is also proposed. This model considers that CuO first decomposes into Cu2O, the oxygen diffusing across Cu2O and Al2O3 layers before reaching the Al layer where it reacts to form Al2O3. The theoretical results in terms of ignition response times confirm the experimental observation. The increase of the heating surface area leads to an increase of the ignition response time and ignition power threshold (go/no go condition). We also evidence that for any heating surface area, the ignition time rapidly decreases when the electrical power density increases until an asymptotic value, named minimum response ignition time, which is a characteristic of the multilayered thermite itself. At the stoichiometric ratio (Al thickness is half of CuO one), the minimum ignition response time can be easily tuned from 59 µs to 418 ms by tuning the heating surface area. The minimum ignition response time increases when the bilayer thickness increases. Not only this work gives a set of micro-initiator design rules to obtain the best ignition conditions and reaction performances but it also details a reliable and robust MEMS process to fabricate igniters and it brings new understanding of phenomena governing the ignition process of Al/CuO multilayers.
I. INTRODUCTION
Nanothermite materials capable of long-term chemical energy storage are beginning to play an important role as heat-producing materials. Thermites undergo oxidation-reduction reactions in which a fuel reduces a metallic oxide, producing molten metal, oxidized fuel and heat release, following the general equation:
𝐴 + 𝑀𝑀 → 𝐴𝑀 + 𝑀 + ∆𝐻𝑟. (1)
where A is the fuel, in most cases aluminum, M is the reduced metal, and ∆ 𝐻𝑟 is the heat of reaction.
Due to their highly exothermic nature, thermite reactions can also generate substantial amount of gas (metal and oxide molecules 1–3). Over the last two decades, the majority of nanothermites have consisted in powder mixtures 4–8 made of aluminum nanopowder mixed with various oxidizers (MoO3, CuO, WO3, Fe2O3, I3O4, Bi2O3)and multilayeredinto two dimensional structures 9–12. These multilayeredstructures are produced mostly by sputter-deposition of aluminum and metal oxide layers (mostly CuO) and constitute a promising alternative to nanopowders for on-chip integration. They are amenable to lithographic patterning and integration with other microelectronic fabrication processes. Al/CuO multilayers, in specific structure and chemical conditions, can exhibit tunable fast high temperature reaction zones making them good candidates as heat sources for many application areas including micro-actuators 13, brazing 12 as well as those normally associated with conventional energetic substances as rapid fuses and micro-initiators 14,15. Whatever applications, harvesting the heat of multilayered thermite reactions entails the film ignition in an efficient and reliable manner. Given its high reaction rate as well as its high reaction temperature (2000 - 2800 K), only a small fraction of the thermite film surface has to be heated to its ignition temperature to trigger the self-sustained combustion reaction. Micro-scale electro-thermal heaters 14,16 are a simple way to ignite thermite thin films. A current passing through a thin metallic resistance produces a local heating by Joule effect that can ignite the thermite within a fraction of ms depending on the electrical power. Once ignited, the thin thermite film reacts, produces intense light (also called flame) ejecting hot particles over several millimeters. Note that once ignited, the reaction is self-sustained and the flame propagates without the need of external energy. . Using simple hot wire initiator, our team demonstrated the possibility to ignite Al/CuO thermite with a success rate of 100 % with only 80 µJ firing energies and ignition response times less than 70 µs 14. Using a bridge wire initiator, Staley et al.15 demonstrated the ignition of Al/Bi2O3nanothermite with a success rate of 100 % over a 30 to 80 μJ range of firing energies and ignition response times ranging from 4 μs to 100 µs.
Whereas the initial quantity of nanothermite material heated to its ignition temperature as well as the heating ramp and layering (bilayer spacing) should influence the ignition time, firing energies and reaction performances, these have never been quantified, neither experimentally nor theoretically. In this work, the ignition of Al/CuO multilayered nanothermite is analyzed experimentally to quantify the effect of heating surface area, heating rate (electrical power) and layering on the ignition characteristics and reaction
3
performances (flame intensity and energy release). The objective of this paper is therefore twofold. Considering ignition through a simple hot wire, we aim at: 1) rationalizing the impact of heating conditions (heating surface area and rate) and layering on Al/CuO multilayers ignition characteristics, 2) providing and analyzing the main parameters (nanothermite film thickness, bilayer spacing, heating surface area) affecting the ignition regime and providing optimized condition to guide the micro-initiator designers.
A first topic of this paper is a brief review of the ignition chip fabrication and ignition conditions. Then, the Al/CuO multilayered nanothermite ignition time and reaction characteristics (flame intensity and rate of energy release) are evaluated by characterizing the ignition point and measuring the emitted visible light intensity as a function of the heating surface area, electrical power/heating rate and layering. Finally, an analytical and phenomenological 1D ignition model based on the heat equation coupled with mass transport equations inside the multilayer film is introduced to rationalize the experimental results and discuss the main influencing parameters.
II. EXPERIMENTAL DETAILS A. Fabrication of micro-initiators
This part describes the process flow for the fabrication of a 2 × 2.6 mm² micro-initiator integrating Al/CuO multilayers. A 500 µm thick 4-inch glass substrate is cleaned with oxygen plasma at 800 W during 5 min to remove surface contaminations. Then a 50 µm thick adhesive transfer tape from 3M VHB Corporation and a 127 µm thick DuPont Kapton HN polyimide film (Dupont Corporation) are laminated onto the substrate. Negative nLof photoresist (AZ nLof 2035, MicroChem Corporation, USA) is then spin coated and patterned using photolithography. 350 nm thick titanium and 300 nm thick gold layers are evaporated onto the surface and patterned to define the Ti electrical resistance and Au electrical pads. Finally, 1.6 × 1.6 mm² Al/CuO multilayer films are sputter deposited, as described in 14, on the micro-initiator directly in contact with the Ti electrical resistance. Multilayer deposition always begins with CuO and finishes with Al.
Figure 1 summarizes the main process steps.
FIG. 1. 3D schematic views of main process steps.
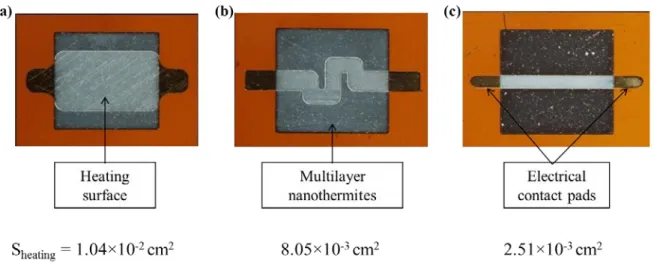
As shown in Figure 2, three shapes of heater are considered to study the influence of the heating surface area (Sheating) on Al/CuO ignition and reaction intensity. The heaters 1, 2 and 3 feature heating surface areas of 1.04 mm², 0.805 mm² and 0.25 mm², representing 62 %, 31 % and 10 % of the nanothermite surface area, respectively. Photos in Figure 2 clearly show the Ti resistance (clear grey), the gold electrical pads, and square Al/CuO film on top.
4
FIG. 2. Photos of the different heating resistance designs with their surface areas (a) heater 1, (b) heater 2 and (c) heater 3. Photos are taken after the deposition of Al/CuO nanothermite film. The resistance is clearly seen due to the transparency of the thin Al/CuO multilayers.
Note that heater 2 has a different shape than heater 1 and 3 that are directly comparable, with a rectangular model shape. Indeed, we found appropriate to consider the different heater shape standard to many applications and exhibiting an intermediate surface area.
B. Experimental setup
A micro-positioner (Karl Süss PA200) is used to connect each micro-heater resistance pad to be fired. A photodiode (VISHAY photodiode, reference BPV10) polarized at 3.3 V placed in front of the thermite at 4 cm is used to analyze the light intensity from the Al/CuO film reaction. A constant current from 0.1 to 1.75 A (with a compliance of 20 V) is applied through the electrical pads for 10 s. The resulting current for each fired nanothermite initiator is measured by a current probe (Tektronix TCP 0020) connected to a digital oscilloscope (Tektronix DPO 4054). The current emitted by the photodiode illuminated by the Al/CuO thermite reaction is measured through a dummy resistance of 1 kΩ. The current follows an exponential law with the irradiance. It reaches a maximum of 70 µA under 1 mW/cm2 at 950 nm. Figure 3 gives a schematic view of the experimental setup.
FIG. 3. (a) Schematic view of the electrical setup used to characterize the micro-initiators and (b) photo of the micro-initiator during one measurement.
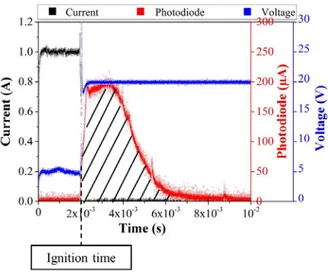
For each electrical input current, the voltage and photodiode current are recorded as a function of time. Importantly, we define ignition response time (ignition time) as the delay between the beginning of the current pulse and the apparition of the photodiode signal as shown in Figure 4. For each input current, measurements are repeated 5 times and the average value is plotted.
5
III. RESULTS
When a current pulse is supplied to the thin film micro-heater, locally, the nanothermite film heats up locally by Joule effect until its ignition temperature. Then the chemical reaction Al/CuO takes place producing intense light and hot particles spread to a distance of several millimeters. The heating rate is tuned by varying the level of electrical current supplied to the heating resistance to obtain electrical powers ranging from 600 mW to 20 W. The reaction of the nanothermite film is then observed using a photodiode to detect the light emission.
Traces in Figure 4 are raw electrical curves recorded for heater 1 during the ignition tests, together with the the visible light emission intensity versus time. Switching the input power, the preset current (black curve) flows through the heating resistance, the voltage is stabilized to 5 V (blue curve) and the photodiode signal (red curve) is null. At the ignition point, the current rapidly drops to zero, the voltage reaches 20 V (compliance) and the photodiode intensity increases. This photodiode intensity plot is typical of experiments in O2 atmosphere exhibiting a sharp rise shortly after the ignition followed by a gradual decay to the background intensity level. For the particular test in Figure 4, the photodiode signal rising time is ~ 0.4 ms and the width of the signal is ~ 6 ms.
FIG. 4. Raw electrical curves (current, voltage and photodiode signal) recorded for heater 1 supplied with a fixed current of 1 A. Hatched area represents the integration area.
The Al/CuO nanothermite ignition characteristic is then analyzed by measuring the ignition response time and the light intensity signal which gives an image of the instantaneous energy release and flame temperature. Then, the integral of the photodiode signal normalized with respect to the thermite mass gives information about the total energy liberated during the thermite reaction. Therefore, the photodiode intensity signal is integrated against time, normalized with respect to the thermite film mass.
A. Influence of the heating surface area on the ignition time and reaction intensity
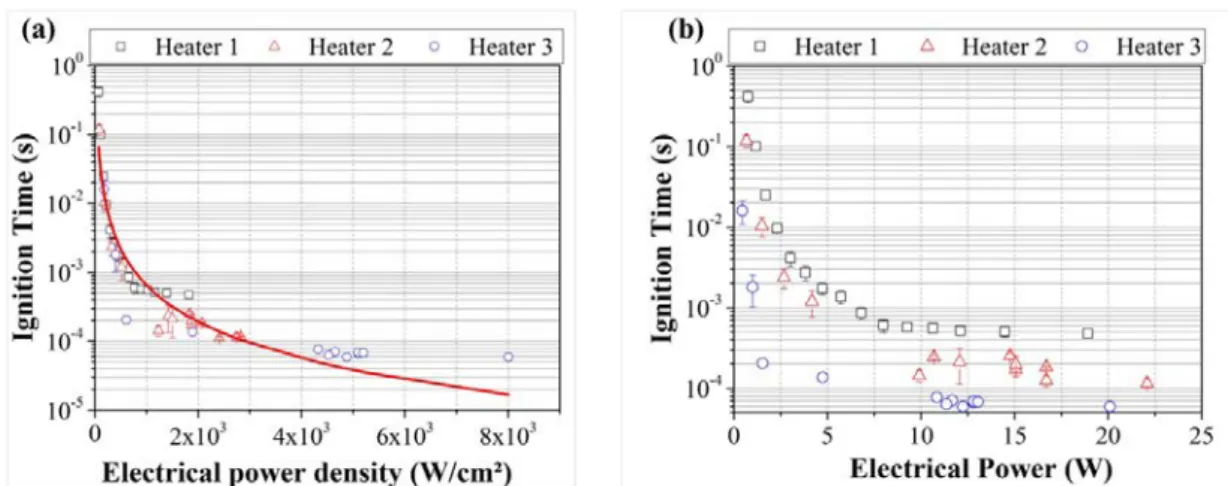
Here the nanothermite film is made of 5 bilayers of Al and CuO being 100 nm and 200 nm thick, respectively. In Figure 5, the ignition response time (𝑡𝑖𝑖𝑖𝑖𝑖𝑖𝑖𝑖) is plotted against the electrical power, P (current multiplied by voltage), and the electrical power density (𝑃 𝑆⁄ ℎ𝑒𝑒𝑖𝑖𝑖𝑖) for the three different heating surface areas.
6
FIG. 5. Ignition times as a function of (a) the electrical power density and, (b) the electrical power for the three different heaters. The red curve corresponds to power law fitted curve.
All curves show similar trend: the ignition response time decreases with increasing electrical power (or electrical power density), following a power law, and reaches an asymptotic value corresponding to the minimum ignition response time. Fitting the experimental data by a power law (red curve in Figure 5 (a)), we find : 𝑡𝑖𝑖𝑖𝑖𝑖𝑖𝑖𝑖 = 124 � 𝑃
𝑆ℎ𝑒𝑒𝑒𝑒𝑒𝑒�
−1.76
. The firing energy density (𝐸𝑖𝑖𝑖𝑖𝑖𝑖𝑖𝑖) calculated by 𝑡𝑖𝑖𝑖𝑖𝑖𝑖𝑖𝑖× 𝑃 𝑆ℎ𝑒𝑒𝑒𝑒𝑒𝑒 is therefore = 124 � 𝑃
𝑆ℎ𝑒𝑒𝑒𝑒𝑒𝑒�
−0.76
. In our Al/CuO multilayered system, the minimum firing energy density is obtained for the maximal electrical power the resistance can sustain.
From Figure 5 (b), we observe that the minimum ignition response time greatly depends on the heating surface area. It is 474 ± 46 µs, 115 ± 14 µs and 59 ± 3 µs for the heaters 1, 2 and 3, respectively. The minimum ignition response times varied from 418 ± 67 ms at 757 mW to 474 ± 46 µs at 19 W for heater 1, from 118 ± 19 ms at 668 mW to 115 ± 14 µs at 22 W for heater 2 and from 16 ± 5 ms at 449 mW to 59 ± 3 µs at 20W, for heater 3. Note also, that below a minimum electrical power, called the ignition power threshold or no fire condition, no ignition occurs whatever the duration of the applied electrical energy. This is simply explained by the fact that, below this ignition power threshold, the electrical firing energy supplied to the micro-heater is not sufficient to compensate the energy lost by conduction through the substrate, radiation from the exposed surface and convection in the air, in order to heat the Al/CuO thin film up to its ignition temperature. The threshold greatly depends on thermal environment
The ignition power threshold is also affected by the heating surface area: it is of 757 mW, 668 mW and 449 mW for the heaters 1, 2, and 3, respectively. The ignition power threshold is reduced by 41% when the heating surface area is divided by 4.
Finally, the firing energy to ignite the nanothermite is equal to 8.97 mJ (18.92 W, 474 µs), 2.54 mJ (22.09 W, 115 µs) and 1.19 mJ (20.10 W, 59 µs), for the heaters 1, 2, and 3, respectively.
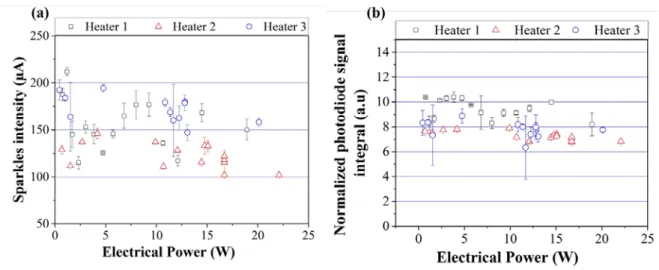
Figure 6 gives the emitted visible light photocurrents and the integrated photodiode signal normalized with respect to the nanothermite mass, as a function of the electrical power for the three different heaters and heating surface areas.
7
FIG. 6. (a) Visible light emission intensity and (b) integrated photodiode signal (in arbitrary unit) as a function of the electrical power and for the three different heating surface areas.
The visible light emission intensity generated by the reaction of the 5 Al/CuO bilayers (Figure 6 (a)) does not vary with the electrical power and is not so much affected by the heater surface area. Measurements give 154 ± 54 µA, 123 ± 26 µA and 189 ± 41 µA respectively for heaters 1, 2 and 3.
The same observation holds for the integrated photodiode signal, which is not affected by the heating surface area. The integrated values are equal to 9.37 ± 1.8 a.u, 7.3 ± 0.7 a.u and 7.8 ± 3.1 a.u for heaters 1, 2 and 3, respectively. The 27 % variations of the integrated values are attributed to the measurement dispersion and not the influence of heating surface area.
B. Influence of the number of bilayers and layering on the ignition time and reaction intensity
In this section, we only consider the chip with the heater 1, on which nanothermite films of different thicknesses are deposited. For all samples, the stoichiometric ratio is respected, i.e. the CuO thickness is twice that of the Al thickness.
1. Number of bilayers
Nanothermites with three different thicknesses are deposited on heater 1: 5, 10 and 15 bilayers of Al and CuO being 100 nm and 200 nm thick, respectively.
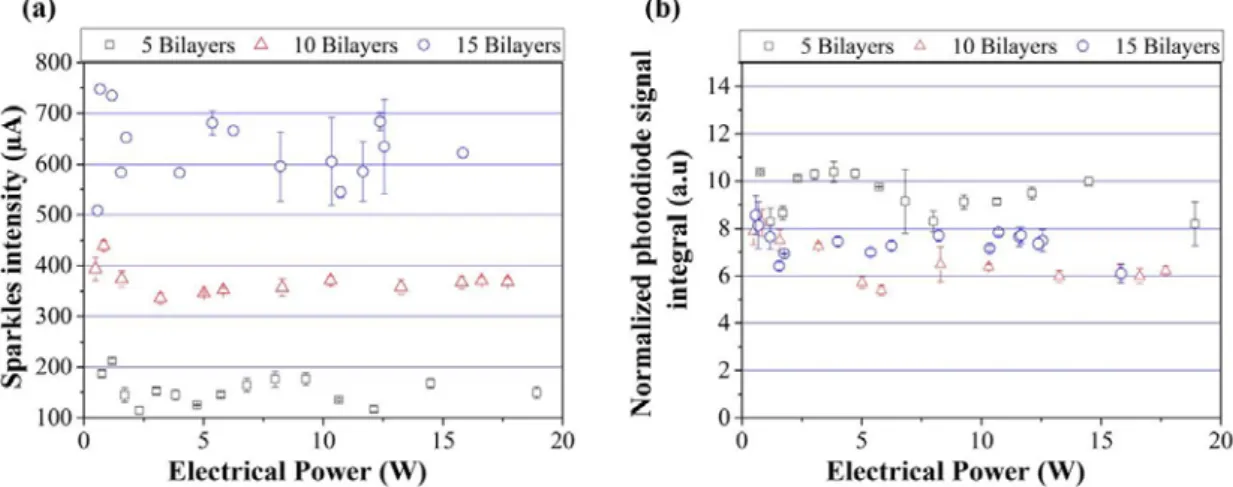
Figure 7 shows the ignition time as a function of the electrical power and Figure 8 (a) and (b) give the visible light emission intensity and integrated photodiode signal for 5, 10 and 15 bilayers. Note that, for comparison, curves in Figure 8 (b) are normalized with respect to the nanothermite mass.
8
FIG. 7. Ignition times as a function of the electrical power considering nanothermite films with 5, 10 and 15 bilayers. The bilayer thickness is 300 nm.
The ignition time decreases with increasing electrical power down to asymptotic values of 474 ± 46 µs, 294 ± 16 µs and 20 ± 5 µs for 5, 10 and 15 bilayers, respectively. The measured ignition power thresholds are measured at 756 mW, 575 mW and 483 mW for 5, 10 and 15 bilayers, respectively. For a given input electrical power, the ignition time is the smallest for 15 bilayers. At 10 W, the ignition response time is equal to 556 ± 28 µs, 438 ± 32 µs and 283 ± 10 µs for the 5, 10 and 15 bilayers, respectively. We note a decrease of 21 % when the bilayers number is doubled (from 5 to 10 bilayers) and of 49 % when the bilayers number is tripled (from 5 to 15 bilayers).
FIG. 8. (a) Visible light emission intensity and (b) integrated photodiode signal as a function of the electrical power for 5, 10 and 15 bilayers. The bilayer thickness is 300 nm.
As expected, stacking more bilayers increases the visible light emission intensity but does not affect the overall reaction performances since the photodiode intensity normalized with respect to the nanothermite mass, is almost constant (see Figure 8(b)). When the bilayers numbers varies from 5 to 15, the emitted visible light photocurrent varies from 217 ± 40 µA to 629 ± 121 µA, whereas the normalized integrated photodiode signal ranges from 10 ± 1 a.u to 7 ± 3 a.u. We note a slight decrease of the visible light emission intensity for 15 bilayers. This could be explained by considering the contribution of radiative losses which increase with flame temperature. The raw photodiode intensity, not normalized to the thermite film mass, is 2.35 times greater for the 15 bilayer films than those measured for 5 bilayers. A hotter flame, increasing the radiative losses and penalizing the generated heat per unit of mass could explain this result.
2. Layering
Here, we consider heater 1 on which three different nanothermite films, with a total thickness of 1.2 µm, are deposited. The first sample is made of two 600 nm thick bilayers (600 nm). The second one is composed of four 300 nm thick bilayers (300 nm) and the last one is constituted of eight 150 nm thick bilayers (150 nm).
9
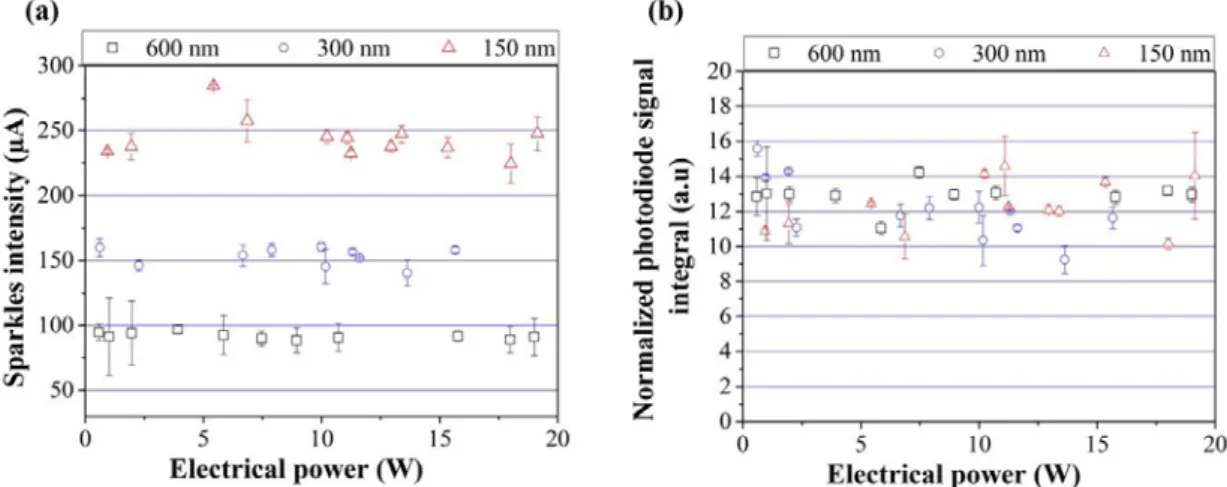
Figure 9 gives the ignition time as a function of the electrical power and Figure 10 (a) and (b) give the visible light emission intensity and integrated photodiode signal for bilayer thicknesses of 150, 300 and 600 nm.
FIG. 9. Ignition times as a function of electrical power for the different bilayer thicknesses. The total film thickness is held constant at 1.2 µm.
The experimental ignition time decreases when the bilayer thickness decreases: it is of 182 ± 2 µs and 972 ± 60 µs for bilayers being 150 and 600 nm thick, respectively. This corresponds to an increase of 186 % when the bilayer thickness is doubled from 150 nm to 300 nm and an increase of 87 % when it is doubled again from 300 nm to 600 nm. For a fixed power, the ignition time is the smallest for the thinnest bilayer.
The ignition power thresholds are measured at 700 mW, 966 mW and 1000 mW for the bilayer thicknesses of 150, 300 and 600 nm.
FIG. 10. (a) Visible light emission intensity and (b) integrated photodiode signal as a function of electrical power for the different layerings. The total film thickness is constant at 1.2 µm.
Increasing the bilayer thickness affects the visible light emission intensity but does not affect the integrated photodiode signal. The visible light emission intensity is equal to 244 ± 38 µA, 130 ± 88 µA and 92 ± 20 µA for the bilayers thicknesses of 150, 300 and 600 nm. The visible light emission intensity is divided by almost 2 when the bilayer thickness varies from 150 to 300 nm and is divided by 1.4 when the bilayer thickness varies from 300 to 600 nm. The normalized integrated photodiode signals values are equal to 12 ± 4 a.u, 12 ± 4 a.u and 13 ± 3 a.u for the bilayer thicknesses of 150, 300 and 600 nm.
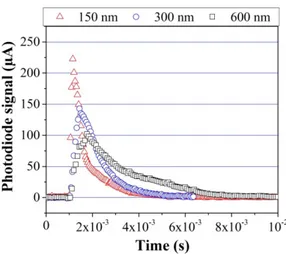
As illustrated in Figure 11, the bilayer thickness affects the rate of energy release but it does not affect the total heat of reaction, which only depends on the thermite mass. When bilayer thickness decreases, the visible light emission intensity increases but the photodiode signal duration diminishes.
10
FIG. 11. Comparison of the photodiode signals obtained for the different bilayer thicknesses (150, 300 and 600 nm).
IV. DISCUSSION
We have investigated the main parameters influencing ignition time and Al/CuO reaction as the heating surface area, the number of reactant bilayers and their thicknesses. At a given electrical power, we show that the minimum ignition response time (𝑡𝑖𝑖𝑖𝑖𝑖𝑖𝑖𝑖𝑚𝑖𝑖𝑖𝑚𝑚𝑖 ) is affected by both the heating surface area defined through the resistance design and nanothermites film layering. 𝑡𝑖𝑖𝑖𝑖𝑖𝑖𝑖𝑖𝑚𝑖𝑖𝑖𝑚𝑚𝑖 decreases rapidly with the heating surface area and bilayer thickness. 𝑡𝑖𝑖𝑖𝑖𝑖𝑖𝑖𝑖𝑚𝑖𝑖𝑖𝑚𝑚𝑖 decreases slightly when the nanothermite film thickness increases.
The Al/CuO reaction, characterized herein by the integrated photodiode signal, is not affected by the heating surface area and bilayer thickness but, as expected, it increases rapidly with the thickening of the nanothermite film. The energy released by the reaction is only fixed by the nanothermite mass and is not influenced by the heating surface area. In order to rationalize these findings, we propose a new 1D model taking into account both thermal exchange and species diffusions/reactions into the thermite layers inspired from a famous approach from the mid 1960’s (so-called Deal and Grove model) initially used to treat thermal oxidation of silicon 17. In the literature, modeling effort associated to multilayered systems concerned essentially bimetallic systems (mostly Al/Ni), in which only a few papers focused on ignition18–21 among a majority of investigations related to propagation phenomena22–27. However, dealing with oxido-reduction thermite reactions imposes major changes mostly due to the non-trivial role of chemical reactions.
The model is based on atomic diffusion between layers (mass transport equation) and thermal diffusion (heat equation) along the film made of stacks of Al, CuO and alumina interfaces which are formed during the deposition process (see Figure 12). In this approach, we assume that CuO first decomposes into Cu2O, the oxygen diffusing across Cu2O and Al2O3 layers before reaching the Al layer where it reacts increasing the Al2O3 thickness. Figure 12 (c) shows the variation of oxygen concentration across the layers.
11
FIG. 12. Schematic representation of (a) 5 Al/CuO bilayers; zoom on half bilayer before heating and ignition and, (b)(c) during ignition process. The white dash line in the (c) image corresponds to the oxygen concentration in the layers.
Other model’s assumptions are as follows :
1. The temperature variations across the multilayer are ignored because the thermite film is thin ( ~µm). The time to reach thermal equilibrium ( ρt×ct×wt²
λt ) is always much lower than the ignition times. ρt, ct, λt and wt are the density, heat capacity, thermal conductivity and thickness of the nanothermite film. For example, for a 1.2 µm thick nanothermite, the thermal equilibrium time (3.8 µs) is more than 2 decades smaller than the experimental minimum ignition time (~500 µs).
2. The thermal conductivity, density, and heat capacity are independent of temperature and composition of the multilayer film. The average density, heat capacity and thermal conductivity are therefore calculated as:
𝜌𝑖=𝜌𝐶𝐶𝐶×𝑤𝑤𝐶𝐶𝐶𝐶𝐶𝐶+𝑤+𝜌𝐴𝐴𝐴𝐴×𝑤𝐴𝐴, (2) 𝑐𝑖=𝑐𝐶𝐶𝐶×𝑤𝑤𝐶𝐶𝐶𝐶𝐶𝐶+𝑤+𝑐𝐴𝐴𝐴𝐴×𝑤𝐴𝐴, (3) 𝑤𝐴𝐴+𝑤𝐶𝐶𝐶 𝜆𝑒 = 𝑤𝐴𝐴 𝜆𝐴𝐴+ 𝑤𝐶𝐶𝐶 𝜆𝐶𝐶𝐶. (4)
With 𝜌𝑖, 𝑐𝑖, 𝜆𝑖 and 𝑤𝑖 the density, heat capacity, thermal conductivity and thickness of the 𝑖 species, Al and CuO.
3. The diffusion coefficients are temperature dependent with activation energies and the values are reported in supplementary files SI-1.
4. The ignition is simulated by imposing a rectangular temperature profile of 1150 +/- 100 K at the end of the thermite. Although the theoretical ignition temperature strictly depends on the structure of the multilayers, only three initial temperatures, namely of 1050, 1150 and 1250 K, have been modelled. Ignition temperature of 1150 +/- 100 K has been determined experimentally from the Titanium resistance against time profile (See SI-2). A negative peak prior the ignition is seen and corresponds to the Ti phase transition from (hcp) phase to (bcc) phase occurring at T = 1150 K 28. This initial profile has a width equal to the heater dimension to represent the different heating surface area conditions. The initial volume held at 1150 K is Sheater × 𝑤𝑖. The rest of the multilayer is initially at ambient temperature.
12
1. Mass transport
The mass transport (Eq. (5).) is calculated using the oxygen flux across CuO, Cu2O and Al2O3. The flux approximation is frequently used in the literature for oxidation modeling purposes 37.
𝜙 =𝐷𝐶𝐶2𝐶�𝐶𝐶𝐶𝐶/𝐶𝐶2𝐶−𝐶𝐶𝐶2𝐶/𝐴𝐴2𝐶3�
𝑤𝐶𝐶2𝐶 =
𝐷𝐴𝐴2𝐶3�𝐶𝐶𝐶2𝐶/𝐴𝐴2𝐶3−𝐶𝐴𝐴2𝐶3/𝐴𝐴�
𝑤𝐴𝐴2𝐶3 = 𝜐𝐶𝐴𝐴2𝑂3/𝐴𝐴. (5)
𝐶𝑖/𝑗 are atomic concentrations (in %) of atomic O at interfaces i/j, 𝐷𝑖 are the diffusion coefficients of oxygen in species i and 𝑤𝑖 is the layers i thickness. 𝜐 is the Al oxidation reaction rate. The concentrations 𝐶𝑖/𝑗 are limited by the oxygen solubilities into i and j. Although this solubility limit is very low in perfect crystals, it can become important in polycrystalline sputter deposited layers containing many defects and grain boundaries. Therefore, an atomic solubility limit of 10 % has been used in the calculations. We have further shown that higher solubility limits (up to 100 %) in Cu and copper oxides do not influence the results. The rapid mixing at high temperatures may induce non equilibrium phases that are not well known today. In our model, we have taken all physical phase changes into account and neglected all structural and chemical phase changes Mass transport is only computed in half of a bilayer, as shown in Figure 12, and identically reported in the whole film by symmetry considerations.
2. Thermal equation
The heat equation (Eq. (6).) considers three main phenomena (i) the external heating by Joule effect ( 𝑃 𝑆ℎ𝑒𝑒𝑒𝑒𝑒𝑒) in W/cm², (ii) the exothermic nanothermite reaction 𝑄 in J/cm3 per Al resulting from atomic intermixing and, (iii) the heat losses mostly by radiation 𝜎 × 𝑇4 in W/cm². All other losses are negligible with respect to the high electrical powers supplied by the titanium resistance and good insulation of the nanothermite film.
(𝜌𝑖× 𝑐𝑖× 𝑤𝑖+ 𝜌𝑅× 𝑐𝑅× 𝑤𝑅)𝑑𝑑𝑑𝑖 =𝑆 𝑃
ℎ𝑒𝑒𝑒𝑒𝑒𝑒+ 𝑛 × 𝑄
𝑑𝑤𝐴𝐴2𝐶3
𝑑𝑖 − 𝜎(𝑇4− 𝑇𝑒4). (6)
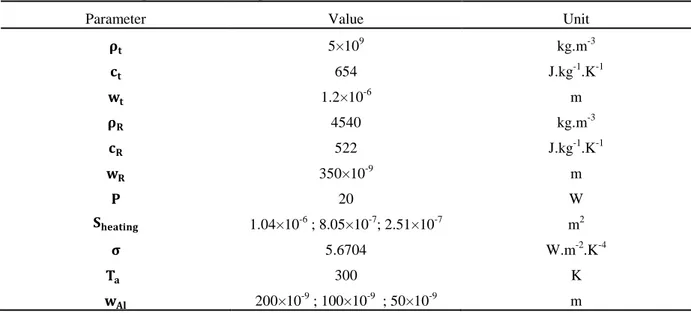
𝜌𝑖, 𝑐𝑖 and 𝑤𝑖 are the density, thermal capacity and total thickness of the thermite, respectively. 𝜌𝑅, 𝑐𝑅 and 𝑤𝑅 are the density, thermal capacity and thickness of the resistance. σ is the Stefan Boltzmann constant, 𝑛 is the number of bilayers and 𝑇𝑒 is the ambient temperature taken at 300 K. Q is 3 times the usual heat of reaction found in the literature, namely 63 kJ/cm3, since here, it is normalized to the Al volume and not thermite one. Table I gives the values for each parameter taken for the calculations.
TABLE I. Values of the parameters used in Eq. (6).
Parameter Value Unit
𝛒𝐭 5×10⁹ kg.m-3 𝐜𝐭 654 J.kg-1.K-1 𝐰𝐭 1.2×10⁻⁶ m 𝛒𝐑 4540 kg.m-3 𝐜𝐑 522 J.kg-1.K-1 𝐰𝐑 350×10-9 m 𝐏 20 W 𝐒𝐡𝐡𝐡𝐭𝐡𝐡𝐡 1.04×10⁻⁶ ; 8.05×10⁻⁷; 2.51×10⁻⁷ m2 𝛔 5.6704 W.m-2.K-4 𝐓𝐡 300 K 𝐰𝐀𝐀 200×10-9 ; 100×10-9 ; 50×10-9 m
Next, we chose to distinguish the heating time (𝑡ℎ𝑒𝑒𝑖 ) that corresponds to the delay to heat the nanothermite to its ignition temperature (1150 K) and the reaction time (𝑡𝑟𝑒𝑒𝑐𝑖 ) that corresponds to the time the material takes to react after being heated at its ignition temperature.
13
As the overlap between the two phenomena can be neglected, we determine independently, 𝑡ℎ𝑒𝑒𝑖 and 𝑡𝑟𝑒𝑒𝑐𝑖 from Eq. (6). solved in two steps, removing successively Q and 𝑆 𝑃
ℎ𝑒𝑒𝑒𝑒𝑒𝑒 . Removing Q in Eq. (6). leads to the following analytical solution of 𝑡ℎ𝑒𝑒𝑖 :
𝑡ℎ𝑒𝑒𝑖 + 𝑡0 = 4×𝑒×𝑏1 �ln �1+𝑒×𝑑1−𝑒×𝑑𝑒𝑒𝑒𝑒𝑒 𝑒𝑒𝑒𝑒𝑒� + 2 tan −1(𝑎 × 𝑇 𝑖𝑖𝑖𝑖𝑖)�. (7) With 𝑎 = � 𝑃 2×𝜎 𝑆ℎ𝑒𝑒𝑒𝑒𝑒𝑒+2×𝜎𝑑𝑒4� 1/4 , (8) 𝑏 = 𝑃 𝑆ℎ𝑒𝑒𝑒𝑒𝑒𝑒+𝜎𝑑𝑒4 𝜌𝑒×𝑐𝑒×𝑤𝑒+𝜌𝑅×𝑐𝑅×𝑤𝑅, (9) 𝑇𝑖𝑖𝑖𝑖𝑖= 1150 ± 100 𝐾, (10) 𝑡0 =4×𝑒×𝑏1 �ln �1+𝑒×𝑑1−𝑒×𝑑𝑒𝑒� + 2 tan−1(𝑎 × 𝑇𝑒)�. (11) The reaction time is computed as follows. For each nanothermite total thicknesses (𝑤𝑖) and bilayer thickness, Eq. (6). is solved removing the Joule effect ( 𝑃
𝑆ℎ𝑒𝑒𝑒𝑒𝑒𝑒) and searching the inflexion point where the temperature increases rapidly indicating the onset of self-sustained reaction. The equation (6) is solved using a finite difference scheme which relies on the discretization of the domain with a uniform Cartesian grid of mesh size 3 µm along the lateral dimension over 3 mm. The discretized equation is then integrated using the Euler method with a variable time step ranging 10-10 and 10-13 s. To illustrate the method, we consider a nanothermite film made of eight 150 nm thick bilayers. The application of 1150 +/-100 K to the nanothermite film, activates the atomic interdiffusion thus producing heat, leading to an increase of the temperature coupled with a thickening of alumina layer. Figure 13 gives the temperature against time and alumina thickness against time evolution in the nanothermite for two heating surface areas: 1.04 mm2 (heater 1) and 0.25 mm² (heater 3). We clearly observe that both the temperature and alumina thickness remain almost constant until a certain time, called reaction time, and then increase very rapidly after this point : the ignition is achieved since the reaction is self-sustained.
FIG. 13. Time dependence of the alumina thickness and temperature at the bottom of the thermite for a thermite composed of 8 bilayers of thickness 150 nm (a) deposited on heater 1 (heating surface area of 1.04×10⁻² cm2). (b) deposited on heater 3 (heating surface area of 2.51×10⁻³ cm2).
14
3. Numerical results and comparison with experiments
𝑡𝑟𝑒𝑒𝑐𝑖 is a function of the bilayer thicknesses (see Table II) and their composition as shown in graph of Figure 14.
FIG. 14. Reaction time as a function of stoichiometry (layering). The bilayer and total thickness are fixed at 150 nm and 1.2 µm, respectively. The stoichiometry is calculated as 2 × 𝑤𝐴𝐴�𝑤𝐶𝑚𝑂 .
At this point, to compare these data with experimental results, we need to combine the two calculated times, 𝑡ℎ𝑒𝑒𝑖and 𝑡𝑟𝑒𝑒𝑐𝑖. Neglecting the overlap between the two phenomena, the ignition time can be considered as the sum of the two above delay times:
𝑡𝑖𝑖𝑖𝑖𝑖𝑖𝑖𝑖≈ 𝑡ℎ𝑒𝑒𝑖+ 𝑡𝑟𝑒𝑒𝑐𝑖. , (12)
Table II reports the calculated and experimental values of the ignition time for 3 bilayer thicknesses (150 nm, 300 nm and 600 nm).
TABLE II. Theoretical and experimental values of the ignition time for three bilayer thicknesses (150 nm, 300 nm and 600 nm). Ignition temperature is taken at 1150 K. Al thickness is half of the CuO one and the total film thickness is 1.2 µm. Heating surface area is 1.04 mm² (heater 1).
Bilayer thickness (nm) Experimental ignition time (µs) Theoretical times (µs)
theat treact tignition
150 182 ± 2
214
13 228
300 520 ± 13 190 404
600 972 ± 60 310 524
The theoretical ignition time increases when the bilayer thicknesses increase. This tendency follows the experimental measurement shown in the section B.2 and reported in the second column of Table II.
For bilayer thicker than 300 nm, the ignition response time is mostly governed by species diffusion through layers (𝑡ℎ𝑒𝑒𝑖 < 𝑡𝑟𝑒𝑒𝑐𝑖 ). Whereas ignition response time is governed by the heating rate and surface area for very thin bilayer (𝑡ℎ𝑒𝑒𝑖 ≫ 𝑡𝑟𝑒𝑒𝑐𝑖).
The discrepancies between experimental and theoretical values can be easily explained by the theoretical approximation. Firstly, the nanothermite heat of reaction 𝑄(𝑇) depends not only on the temperature, but also on the history of the layers after the sputtering process. Thermal cycles and annealing processes even at low temperature definitely alter the structure of the layer and the heat of reaction. In particular, structural changes occur during first heating step, which is not considered in the model. Secondly, we only consider in this model oxygen diffusion. In the reality, the ignition mechanism should be more complex and a couple effect of O and Al diffusion through the layers. And, thirdly, the thermite parameters are supposed homogeneous and are calculated following several assumptions as no temperature dependence, which also adds possible errors in
15
comparison with real material.
V. CONCLUSIONS
Standard MEMS technology and magnetron sputtering technology were used to prepare micro-heaters with Al/CuO multlayered film. When current is supplied to the heating resistance, the Al/CuO nanothermite ignites and a violent exothermic reaction produces intense light. The methods of fabrication are scalable to different sizes of devices and could therefore find many useful applications in future energetic micro-actuation systems. As a conclusion of this study, we showed that the minimization of the heater surface area is one solution to optimize micro-igniter performances and electrical-chemical conversion yield. Only a small surface of the multilayered thermite has to be heated to its ignition temperature determined at 1150 +/- 100 K to trigger the self-sustained combustion reaction. We demonstrated that a heating surface area of 0.25 mm2 is enough to ignite a multilayered thermite being 1.6 cm in width and of any length since once ignited at one extremity, the reaction is self-sustained and the flame propagates without the need of external energy. For an imposed electrical power above the ignition threshold point, the increase of the heating region leads to an increase of the ignition time. The minimum experimental ignition time is 59 ± 3 µs for heating surface area of 0.25 mm2 and increases up to 474 ± 46 µs (×7) when the heating surface is multiplied by 4. The ignition threshold power also increases with the heating surface area: it is 757 mW for the 1 mm² heating resistance and decreases to 449 mW for 0.25 mm² heating resistance. For any heating surface areas, the experimental ignition response time rapidly decreases when the heating rate increases until an asymptotic value, named minimum ignition time, which is a characteristic of the multilayered thermite structure. The layering greatly influences the minimum ignition time: increasing the bilayer thickness results in an increase of the minimum ignition time. This latter is equal to ~1 ms for a bilayer thickness of 600 nm, whereas it is less than 200 µs for the same mass of thermite having a bilayer thickness of 150 nm. Also, the threshold ignition power is measured at 700 mW and 1000 mW for the bilayer thickness of 150 and 600 nm, respectively.
A new 1D analytical and phenomenological ignition model based on atomic diffusion across layers and thermal exchange has been proposed considering that CuO first decomposes into Cu2O, the oxygen diffusing across Cu2O and Al2O3 layers before reaching the Al layer where it reacts to form Al2O3. The theoretical results confirm the experimental data but discrepancies exist due to the simplicity of the model.
SUPPLEMENTARY MATERIAL
See supplementary material for the values of the diffusion coefficients used in the mass transport model and for Ti resistance-time profile.
ACKNOWLEDGEMENTS
This study is supported by ANR grant IMPYACT (132497-LabCom2015). We would like to thank the French Technological Network namely RENATECH that has partially funded micro-initiator manufacturing.
REFERENCES
1 L. Glavier, G. Taton, J.-M. Ducéré, V. Baijot, S. Pinon, T. Calais, A. Estève, M. Djafari Rouhani, and C. Rossi, Combust. Flame 162, 1813 (2015).
2 K.S. Martirosyan, J. Mater. Chem. 21, 9400 (2011).
3 G. Jian, S. Chowdhury, K. Sullivan, and M.R. Zachariah, Combust. Flame 160, 432 (2013). 4
R.R. Nellums, B.C. Terry, B.C. Tappan, S.F. Son, and L.J. Groven, Propellants, Explos. Pyrotech. 38, 605 (2013).
5
R.H.B. Bouma, D. Meuken, R. Verbeek, M.M. Pacheco, and L. Katgerman, Propellants, Explos. Pyrotech. 32, 447 (2007).
6
C.D. Yarrington, S.F. Son, T.J. Foley, S.J. Obrey, and A.N. Pacheco, Propellants, Explos. Pyrotech. 36, 551 (2011).
7
S.G. Hosseini, A. Sheikhpour, M.H. Keshavarz, and S. Tavangar, Thermochim. Acta 626, 1 (2016). 8 J. a. Puszynski, J. Therm. Anal. Calorim. 96, 677 (2009).
16
9 M. Bahrami, G. Taton, V. Conédéra, L. Salvagnac, C. Tenailleau, P. Alphonse, and C. Rossi, Propellants, Explos. Pyrotech. 39, 365 (2014).
10 L. Marín, C.E. Nanayakkara, J.F. Veyan, B. Warot-Fonrose, S. Joulie, A. Esteìve, C. Tenailleau, Y.J. Chabal, and C. Rossi, ACS Appl. Mater. Interfaces 7, 11713 (2015).
11 D.P. Adams, Thin Solid Films 576, 98 (2015).
12 A.H. Kinsey, K. Slusarski, K. Woll, D. Gibbins, and T.P. Weihs, J. Mater. Sci. 51, 5738 (2016).
13 M. Korampally, S.J. Apperson, C.S. Staley, J. a. Castorena, R. Thiruvengadathan, K. Gangopadhyay, R.R. Mohan, A. Ghosh, L. Polo-Parada, and S. Gangopadhyay, Sensors Actuators, B Chem. 171–172, 1292 (2012). 14 G. Taton, D. Lagrange, V. Conedera, L. Renaud, and C. Rossi, J. Micromechanics Microengineering 23, 105009 (2013).
15
C.S. Staley, C.J. Morris, R. Thiruvengadathan, S.J. Apperson, K. Gangopadhyay, and S. Gangopadhyay, J. Micromechanics Microengineering 21, 115015 (2011).
16 A. Abraham, N.W. Piekiel, C.J. Morris, and E.L. Dreizin, Propellants, Explos. Pyrotech. 41, 179 (2016). 17
B.E. Deal and A.S. Grove, J. Appl. Phys. 36, 3770 (1965).
18 A. Hemeryck, J.-M. Ducéré, C. Lanthony, A. Estève, C. Rossi, M. Djafari-Rouhani, and D. Estève, J. Appl. Phys. 113, 204301 (2013).
19 G.M. Fritz, J.A. Grzyb, O.M. Knio, M.D. Grapes, and T.P. Weihs, J. Appl. Phys. 118, 135101 (2015).
20 A.B. Mann, A.J. Gavens, M.E. Reiss, D. Van Heerden, G. Bao, T.P. Weihs, A.B. Mann, A.J. Gavens, M.E. Reiss, D. Van Heerden, G. Bao, and T.P. Weihs, 1178, (2009).
21 M. Salloum and O.M. Knio, Combust. Flame 157, 1154 (2010). 22
R. Knepper, M.R. Snyder, G. Fritz, K. Fisher, O.M. Knio, and T.P. Weihs, J. Appl. Phys. 105, 1 (2009). 23
M.D. Grapes and T.P. Weihs, Combust. Flame 172, 105 (2016).
24 S. Jayaraman, O.M. Knio, A.B. Mann, and T.P. Weihs, J. Appl. Phys. 86, 800 (1999). 25 E. Besnoin, S. Cerutti, O.M. Knio, and T.P. Weihs, J. Appl. Phys. 92, 5474 (2002). 26
C. Yin and J. Yan, Appl. Energy 162, 742 (2016). 27
N. Amini-Manesh, S. Basu, and R. Kumar, Energy 36, 1688 (2011). 28 E. A. Bel’skaya and E.Y. Kulyamina, High Temp. 45, 785 (2007).