HAL Id: halshs-00409243
https://halshs.archives-ouvertes.fr/halshs-00409243
Submitted on 8 Jun 2020
HAL is a multi-disciplinary open access
archive for the deposit and dissemination of
sci-entific research documents, whether they are
pub-lished or not. The documents may come from
teaching and research institutions in France or
abroad, or from public or private research centers.
L’archive ouverte pluridisciplinaire HAL, est
destinée au dépôt et à la diffusion de documents
scientifiques de niveau recherche, publiés ou non,
émanant des établissements d’enseignement et de
recherche français ou étrangers, des laboratoires
publics ou privés.
Milovice (area G excepted)
Alexis Brugère, Laure Fontana
To cite this version:
Alexis Brugère, Laure Fontana. Origin and exploitation patterns of mammoth at Milovice (area
G excepted). Martin Oliva. Milovice: site of the mammoth people below the Pavlov hills : the
question of mammoth bone structures, 27, Moravské Zemské Muzeum, pp.51-105, 2009, Anthropos,
9788070283332. �halshs-00409243�
Objevem předmosteckého sídliště na konci 19. století vyvstala otázka původu akumulací mamutích kostí, jíž se po dlouhou dobu nepodařilo zodpovědět. K dosud prezentovaným vysvětlením (lov, mrchožroutství, sběr) může rozhodující měrou přispět studium nálezů z gravettienského sídliště u Milovic. Počtem 62 694 zbytků (NR) však tato lokalita mírně zaostává za ostatními (Předmostí, Dolní Věstonice a Pavlov), a to i když se jejich počet započtením sektoru G (Péan 2001b) zvýší na 65 tisíc (obr. 1 a 2). To je ovšem způsobeno tím, že v Milovicích chyběly rozsáhlé sídlištní plochy s převládající menší (nemamu-tovou) faunou. Způsob výzkumu však slibuje, že vzorek z Milo-vic je bližší původní situaci než rozsáhlerší kolekce z výše zmí-něných lokalit (tab. 1).
Překrytí vrstvou sedimentu po krátké době působení suché-ho prostředí a „efekt skořápky“ zabránily vážnějšímu narušení kostí, které by na stanici pod širým nebem bylo možno očeká-vat (obr. 5). Postdepoziční faktory tedy jen málo zkreslily vyvá-ženost vzorku co do zvířecích druhů a zastoupených tělesných částí. Ty jsou v obou hlavních akumulacích (A+B, K) podobné a homogenní je i poměr zastoupení pravých a levých kostí (obr. 3 a 4). Podreprezentované jsou pouze pozůstatky malých zvířat. Žádná dochovaná kost lišky nebo zajíce není menší než 2 cm, jsou však zastoupeny takto malé zbytky mamutů, ponejvíce zlomky slonoviny (obr. 6). Každý sektor se zdá být nezávislý na ostatních. Akumulace kostí nepostihly žádné výrazné změny (srov. kosti v primární vodorovné pozici v sektoru K), dislokace svahovými pohyby se výrazněji projevují pouze v sektorech na vrcholu svahu (C,D,L,R). Konečně, izolovanost každé akumula-ce prokazuje i absenakumula-ce skládanek a reartikulací nebo párů kostí mezi sektory (projevují se nanejvýš v rámci jedné plochy, tab. 2–3 a obr. 7). Druhy asociované s mamuty poskytují jen málo doplňkových informací: tři hlavní býložravci (sob, kůň, los) byli využíváni zejména na maso a morek. Loveni mohli být i vlci a lvi, původ jiných druhů neznáme (obr. 8).
Jaký je původ akumulací mamutích kostí ? Milovice jsou jed-ním z mála sídlišť, jež neleží nad řekou. Navíc se tu nenachází žádné jezírko, stálý pramen či zdroj minerálních látek, zkrátka nic, co by mohlo mamuty přitahovat, ani je ohrožovat jako např. nebezpečný sráz. Tím můžeme vyloučit hypotézu o přirozeném úhynu mamutů na místě samém. Nepřítomnost říčních sedimen-tů a mohutných svahových perturbací vylučuje i existenci dru-hotné nahromaděniny pozůstatků. Mamuti tudíž nezahynuli při-rozenou cestou. Demografický rozbor bere v úvahu věkové profily, z nichž dva nejdůležitější vycházejí z rozboru dolních (celkem 159) a pro sektor K i horních stoliček. Věkové třídy (podle Law 1966) jsou prezentovány po 12letých intervalech, navržených G. Haynesem (1991). V obou hlavních akumulacích jsou zastoupeny všechny věkové třídy s výjimkou té poslední (obr. 9–11). Nejlépe zastoupení jsou dospělí jedinci (adultus),
zejména v sektoru A+B. Mladí jedinci jsou v A+B početnější na úkor subadultních, jež jsou dobře zastoupeni v sektoru K Tyto profily neodpovídají přirozené mortalitě, takže zde musíme uva-žovat o činnosti nějakého predátotra. Přítomnost dospělých a nedostatek mladých zvířat neukazují na aktivitu hyen. Ostatně jen 0,1% kostí vykazuje ohryzy od masožravců, zhusta na čás-tech přístupných až po rozpadu mršiny (obr. 12 ; tab. 4). Zdá se tedy, že akumulace jsou dílem člověka. Výčet typů kostí navíc prokázal relativní nedostatek klů a stoliček : jak ukazuje obr. 13, chybí 90% mamutoviny, a to i když uvažujeme jen jedince starší 12 let, tj. s pořádnými kly. Gravettienci tedy mamutovinu asi odebírali a odnášeli. Sběr kostí čerstvých, suchých nebo fosil-ních je asi vyloučen, neboť zastoupení tělfosil-ních částí je vyrovnané (sběr by měl totiž probíhat selektivněji), a nenasvědčuje mu ani homogenní stav povrchu kostí. Lov dokládá selektivní struktura věkových tříd s vyšším zastoupením dospělých a adolescentních jedinců na úkor mláďat a starých zvířat. Z demografických a eto-logických pozorování u současných afrických slonů vyplývá, že jsou to hlavně samice z matriarchálních stád (jež tvoří 15 až 30 jedinců), na něž se soustřeďuje pozornost lovců. Pět mamutů v Milovicích zahynulo na jaře, jak dokládají dva ještě nepoužívané dp2, více kostí embryí a novorozenců (tab. 5) a tibie ročního mlá-děte (Maschenko 2006). Jestliže doklady o sezonalitě poskytlo jen 10 zbytků ze 7% jedinců, týkají se min. tří sektorů (A+B, K a R). Akumulace mamutích kostí v Milovicích je tedy výsledkem lovecké aktivity skupin lidí během (minimálně) jara kdy se rodi-la mláďata.
Maso bylo odřezáváno, jak svědčí jediná kost s dekarnizač-ními řezy (obr. 14). Dle nedostatku jiných taxonů lze předpoklá-dat, že chobotnatci gravettiencům poskytovali důležitou složku stravy. Využíván byl rovněž morek, ale s ohledem na omezenou fragmentaci kostí (obr. 15) asi jen příležitostně (srov. kriteria in Biberson – Aguirre 1965). Jiní býložravci byli na maso a morek. využíváni systematičtěji.
Asi stovka žeber svědčí o otevírání hrudníku ohýbáním. Kosti bývají vskutku lámány podobným způsobem, a to spirálo-vitě, někdy s jazýčkem naznačujícím ohybání směrem ven (obr. 16). Kosti se rovněž využívaly k technickým účelům. Dva femu-ry byly oštípány, snad kvůli odbití úštěpů (obr. 17). Podobně opracované kosti jsou známé z i jiných jihomoravských a sou-sedních lokalit. Dvě žebra se používala jako „hladidla“, jiné žebro, dlouhé 60 cm, nese dvě rýhy provedené několikanásob-nými hlubokými řezy (obr. 18). Jestliže jsou rýhovaná žebra známá i z jiných sídlišť (Grub-Kranawetberg a Krakow-Spadzis-ta), patří tam k jinému typu předmětů a mají odlišný význam (Antl – Fladerer 2004; Wojtal – Sobczyk 2005). Kly jsou v Milo-vicích (kromě G) fragmentované přirozeně, neboť se nenašel se žádný výrobní odpad. Lebky jsou sice zcela zničené, nikoli však údery lidskou rukou. Nemůžeme určit, zda mamutovina byla
VII.
ZPŮSOBY VYUŽÍVÁNÍ MAMUTŮ A PŮVOD JEJICH KOSTÍ
V MILOVICÍCH (KROMĚ SEKTORU G)
odebírána ve stavu čerstvém (řezáním, lámáním, žlábkováním surového bloku, štípáním) nebo suchém (Khlopatchev 2006 ; Christensen 1999). Chybí i mnoho stoliček, patrně rovněž odne-sených (obr. 20). Zájem gravettienců o moláry je doložen v Dol-ních Věstonicích („drasadla/škrabadla“, Klíma 1963) a zpraco-vávány byly i kořeny stoliček (Oliva 1991; Valoch 2003 ; Antl – Fladerer 2004). Odebírání mamutích zubů mohlo tudíž v Milo-vicích představovat jednu z nejdůležitějších činností. Základem
potravy bylo mamutí maso, což doložil S. Péan (2001b) pro sek-tor G. Tyto dva faksek-tory asi vysvětlují přeferenční lov dospělých mamutů. Milovice (vyjma G) se tak jeví jako místo získávání mamutoviny, zatím co exploatace a konzumace produktů se odehrávala jinde (obr. 21). Tomu by nasvědčovalo malé množ-ství štípané industrie, absence umění a nedostatek kostěných nástrojů. Konečně, jarní lov v podpálavském regionu lze vysvět-lit tím, že zde byla přiváděna na svět mamutí mláďata.
VII.1 Introduction
In the Moravian area, many Gravettian-Pavlovian sites delivered mammoth bone accumulation. Since the discovery of Předmostí in the late XIXthcentury, the question of the origin of proboscidian remains is discussed. If human groups have worked mammoth bones and ivory, their way of procurement is still not solved. Twenty years ago, O. Soffer brought up the question when working on the “Epigravettian” of the Central Russian Plain and the numerous sites containing mammoth bones remains. She suggested that big and heavy mammoth bones, exploited as raw material for dwelling construction on open-air sites, were used dry in situ or collected not far away and brought back to the sites (Soffer 1985; 1993). She also proposed the same for Central European mammoth sites despite many differences. Several Russian scientists accept this idea of exploitation of natural death site by human groups, especially for mammoth bone accumulations found on riverbanks associated with a scarce industry (Soffer 1985; 1993). However, different situations are documented: in North America Clovis culture, mammoth procurement and exploitation never affected dozens of animals but only one or two, and hunting was the main way of procurement (Frison – Todd 2001). According to S. C. Münzel (2001; 2004), the Aurignacian and Gravettian sites of the Souabian Jura (Germany) that delivered numerous mammoth’s remains, result from hunting episodes. F. Fladerer proposed the same for the Austrian Gravettian settlements that never delivered more than few individuals (Antl – Fladerer 2004; Fladerer 2001a; Fladerer – Salcher 2004).
Concerning the Moravian area and the Gravettian-Pavlovian culture, the procurement pattern is still discussed. Central European scientists proposed mammoths have been hunted, even if it has never been demonstrated (Klima 2000; Musil 1994; 1997; 2000; Oliva 1997b; 2000b; 2000c; 2003a; Svoboda et al. 1996). Some others disagree and proposed an exploitation of dead animals (Péan 2001b), not excluding a human involvement (see Svoboda et al. 2005). Finally, some authors also plead for hunting and scavenging could have coexisted at a same site, like at Krakow-Spadzista (Wojtal 2001; Wojtal – Sobczyk 2005).
Studying Milovice faunal sample was absolutely necessary to document this question. We focused on two main questions: the origin of mammoth bone accumulations and mammoth exploitation pattern. We tried to compare all the results to the scarce data of other Gravettian sites that deliver a lot of mammoth remains, to identify possible distinctive characteristics of Milovice.
VII.2 Characterization of the collection and questions A. Characteristics of the faunal collection
1. Sample size
The 12 areas yielded 62 694 faunal remains (NISP). Even including remains from area G (Péan 2001b), there are few remains comparing to other Moravian sites, Předmostí, Dolní Věstonice (I and II) and Pavlov (Figure 1).1On the contrary, the other sites (the Polish site of Krakow-Spadzista street B and the Austrian sites of Krems-Hundssteig and Krems-Wachtberg) delivered only less than 10 000 remains (Antl – Fladerer 2004; Fladerer – Salcher 2004; Wojtal – Sobczyk 2005).
Is it meaningful to compare collections without knowing preservation conditions, digging practices and counting methods that may have been very different from one site to another? If we can evaluate these different parameters for every site, we will be able to know if some assemblages are under represented. Then it will be possible to compare the assemblages’ size, to know if it is related to the digging area. Figure 2 demonstrates that there is no obvious connection between the excavated area and the number of faunal remains. Indeed, at Milovice, 64 000 faunal remains have been excavated out of nearly 700 square meters, whereas at Pavlov and Dolní Věstonice, out of only 300–400 square meters, at least twice as many remains were found out.
Moreover, considering data related to preservation conditions, sieving and counting methods, it appears that Pavlov and Dolní Věstonice are highly under represented whereas Milovice faunal assemblage seems to be the most representative of the original deposit. That implies the difference between Milovice and the other Moravian sites is more important than the first view indicates. Does it necessarily mean that Milovice sample is totally representative of the original deposit, considering the excavated area, the bone preservation and the methodology used?
2. Sample’s representativeness
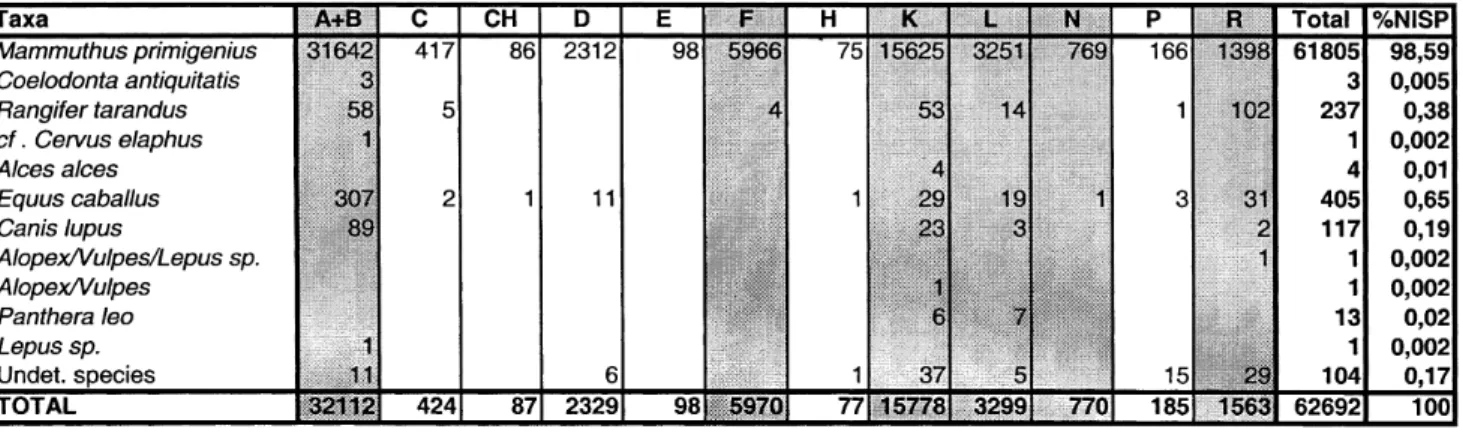
Are the faunal remains representative of the species and the skeletal parts originally present at the whole site? Only a part of the site has been excavated (M. Oliva, this volume) and even if the 500 square meters represent around 80% of the original site, 20% have been destroyed. What is the consequence of this missing part in terms of sample’s representativeness? Considering the identified species, as the mammoth remains represents 98,58%, it is very difficult to analyze the spatial distribution of the other species (Table 1). We just notice that reindeer (0,38%) and horse (0,65%) remains distribution is not
VII.
ORIGIN AND EXPLOITATION PATTERNS OF MAMMOTH
AT MILOVICE (AREA G EXCEPTED)
Alexis Brugère – Laure Fontana
related to the sample size of each area. That means that it is not possible to be sure that any other species was originally present in the truncated areas, specially if we consider that some species
are, in some totally excavated areas, represented by a few remains (as horse in area D) or in a single area (as the rhinoceros). So, even if some species originally present at the Figure 1 Real or estimated NISP of the main mammoth sites of the “Pavlovian-Gravettian area”.
Figure 2 Correlation between the NISP and the excavated area of different sites. (Quality of preservation of the faunal remains: ?: good; +: good enough; ?: not so good; ?: bad; s: sieving).
Figure 3 Body part distribution in areas A+B (MNE=2267) and K (MNE=1054).
site are now missing because of the truncated areas, it is highly unlikely that it would have represent a lot of remains.
Considering skeletal parts representation, can we be quite sure that the actual data of each area are representative of the original deposit? If assemblages from entire areas have been more important, we could have compared the data from truncated and entire areas, to see if the skeletal parts distribution was the same. As these areas delivered a few remains (cf. table 1), we only compared the data from the four main truncated areas (A+B, K, L, R). Figure 3 proves that the anatomical parts distribution is very similar between areas A+B and K, as in the areas L and R (Appendix I). This homogeneity appears also clearly in the ratio right/left of the main areas as area K (Figure 4 & Appendix Ia).
The overall homogeneity of anatomical parts distribution inside the truncated areas permits to conclude that the 20% missing parts did not hold a different distribution. That means the whole faunal sample of the 12 areas is representative of the original deposit.
The sample representativeness also depends on the preservation conditions that could have affected strongly the faunal remains and so modified the NISP. That is why we have to know if the remains were preserved in the same way in every area and how the preservation conditions have affected bones and teeth. Even if among the identified bones, there are a few bones of small species (fox, hare) and some fragile bones of horse and mammoth (sternum, very small foetal bones of mammoth), that is not enough to conclude that the preservation is rather good. More precisely, which types of alteration have affected the bones and what were the consequences on the faunal remains preservation from each area?
Figure 5 presents the most important types of alteration. Among the destructive agents, the root attack, pointing out a slight overlaying of sediment above bones, is the dominant damage. The withering indicates that some bones were exposed for a long time under dry conditions before being covered. These two values are rather low in a context of open-air site related to the site extension and the mammoth bones size. Moreover, we noticed different degrees of alteration and a lot of bones bear only slight modifications. All these elements could be the result of a “shell effect” (bones can produce when piled up) but the lack of a precise spatial three-dimensional recording does not allow us to conclude. Smoothing and dissolution are two other superficial damages. Smoothing seems to be the consequence of loess dirts strikes under windy conditions (undisturbed areas) and doubled with sediment movements as the rate is high in the disturbed slope areas. Smoothing had an impact before and after the remains have been buried. The dissolution is a consequence of underground water presence, occurring after the covering period and during a more humid episode. Confirming this post-covering presence of humidity, iron and manganese oxidation rates are very high. So it is clear that none of the recorded natural alterations have been highly destructive for the faunal remains. All of these taphonomical agents acted softly: bones and teeth have not been deeply affected, especially the largest remains. If remains from areas R,
N, H and L look more deteriorated than the others (cf. Appendix II & Appendix III), preservation conditions were nevertheless rather good and did not affect bone representativeness (species and skeletal parts). All of these observations indicate that bones have been accumulated in a short enough time-span whatever the area, and that the representativeness of species and skeletal parts is rather similar on each area.
The excavation methods can modify the sample’s represen-tativeness: as described above (and Oliva, this volume), some parts of the site have been destroyed in the context of a rescue excavation and the floated sieving has been practiced only for area G. That implies a lower representation of small remains. As we do not know the precise data related to area G bones size, we compared the data of the 12 areas, specially the part of the smallest remains (< 2 cm). As we can notice on Fig. 6, there are some small remains (< 2 cm) and their representation reaches 22%, which indicate that the smallest bones (all species included) have been collected. If we cannot know in which proportion, this size class is in second position in four areas. So it is likely that the great part of the smallest remains has been collected. Concerning species representativeness, we notice that the remains of the smallest species (hare, fox) are longer than 2 cm (Appendix IV), so it is likely that the smallest bones have not been collected: the bones of small species are less representative than the mammoth one’s. 3. Separate areas?
We have concluded that the faunal assemblage was representative of the original deposit in terms of mammoth skeletal parts and species. Now we have to know if the identified areas were different parts of a same (or many) occupation(s) or if they were separate from each other (distinct occupations)? First we need to know if the entire site has not been affected by many movements that could have modified spatial “organization” of the site. Stratigraphic data and some bones localization indicate that a part of the slope slided down2, affecting areas R, L, C, D. These
field movements were soft and did not mix up the remains of the different areas. In the most disturbed areas of this part of the site, sediments overlapped the subjacent ones (Oliva and Havlíček, this volume) but the layers’ homogeneity has been preserved the best-preserved area (K) even delivered faunal remains in horizontal position. So we can conclude that and each area was originally separate from each other, as they were discovered. Were some areas connected with other ones? To answer this question we have looked for direct evidence: anatomical associations (noticed during the excavation), bone and teeth refitting3and symmetrical association.
The biggest samples (areas A+B, K, L) delivered the highest number of refittings and symmetrical associations inside a same area (Table 2) and some have been realized even between remains remote from several meters. But we did not succeed in any refitting between areas (Figure 7). As observed in Table 3, refits have been realized on mammoth many skeletal parts and some bones of some other species (horse, lion, woolly rhinoceros, wolf). So we can conclude the absence of any refitting between bones and teeth of distinct areas indicates each area was separate from each other.
2) Only half of the area R moved down.
B. The main problematic
1. Origin of the assemblage: bone-accumulating agents and processes
The numerous Gravettian-Pavlovian sites that delivered a lot of mammoth bones set the question of the origin of these accumulations. Hunting is directly attested only in Siberia where a piece of flint was found inside a vertebra (Zenin et al. 2003). Actually, a part of the prehistorian community stands up
for “active scavenging” or/and fresh bone collecting (Péan 2001b; Soffer 1985; 1993; West 2001a) while another part is rather in favour of hunting (Antl – Fladerer 2004; Münzel 2001; Fladerer – Salcher 2004; Frison 1989; Frison – Todd, 2001; Klima, 1995; 2000; Oliva 1989b; 2000a; 2000c; Svoboda et al., 1996), maybe with a concomitant scavenging (Wojtal 2001; Wojtal – Sobczyk 2005). Nevertheless, these ideas are rarely documented by precise data (only for Aurignacian and Gravettian Souabian Jura sites – Münzel 2001 – and Austrian Gravettian settlements – Antl – Fladerer 2004; Fladerer 2001a; Fladerer – Salcher 2004). No age profile is known for Dolní Věstonice I and Předmostí, as Pavlov profiles need to be adjusted with actual methods. In the same way, no detailed account of mammoth skeletal parts is published for the same sites. Moreover, some available “arguments” in the literature are not always real arguments, as the local environment described as “favourable” or not to mammoth hunting. Concerning the Pavlovian sites, mammoth hunting is admitted (Maška 1889; 1894a; Křiž 1891; 1896; and Soergel 1922, all cited in Oliva 1997a; 1997b; Klima 2000; Musil 1994; 1997; 2000; Oliva 2003a; Svoboda et al. 1996). It is based on many ideas, the great quantity of remains, the great number of young individuals, the bone deposits, which would reflect several short and repeated occupations and an in situ hunting, and the similar location of wide Gravettian Moravia sites (between 200 and 300 meters (a.s.l) near river valleys (Kozłowski et al. 1974; Svoboda et al. 1996; Oliva 1998a).
Have the mammoth from Milovice been hunted by gravettian groups? We consider Milovice faunal remains as a good sample for the zooarchaeological study, so we tried to identify the data that could be considered as real arguments. Some researchers
0 10 20 30 40 50 60 70 80 90
Cranium Lower teeth Ribs Humerus Ulna Metacarpals Femur Tibia Tarsals Phalanx I
%M N E m odi fi e d ( M N E = 750 Right Left
Figure 4 Right and left ratio of mammoth skeletal parts at Milovice K (black: right, grey: left).
Figure 5 Bone modification – for detailed numbers see Appendix II. Legend: Longitudinal cracking (L.G.); Perpendicular cracking
consider that the only data that can document the origin of the assemblage are demographic data; e.g. sex ratio data and age profiles (Haynes 1987b; 1991; Louguet Lefebvre 2005; Speth 1991) as some others use these data with skeletal parts analysis (Münzel 2001; 2004; Fladerer – Salcher 2004). Then for some others, the diversity of profiles makes it difficult at present to unambiguously infer human predation from age profiles alone.” (Soffer 1993, 35). To identify the origin of Milovice mammoth accumulation, we analysed in detail demographic data, skeletal parts representation and seasonality data, all these information being interpreted in the light of taphonomic data.
What about the origin of the ten other identified species? Reindeer and horse, the main species (Figure 8), have probably been killed not far from the site, as almost all the skeletal parts are represented (cf. Appendix IV). More over, some long bones of elk, horse and reindeer have been broken for marrow extraction as spiral breakage pattern and impact point witness. Then, a few waste products indicate that reindeer shed and unshed antlers have been worked. If we are sure these species have been hunted, it is maybe also the case of the wolf (and the lion), which is represented by many different skeletal parts and in a great number, as in the neighboured sites. On the contrary, it is not possible to conclude concerning the three remains of woolly rhinoceros and the two bones of fox and hare, all species usually discovered in other sites. We only can be sure that the shed antler of red deer has been collected (or exchanged). So, at least four species have probably been hunted but the scarcity of their remains does not allow us to study their exploitation pattern. 2. Mammoth exploitation pattern
The numerous bone and ivory artefacts, the use of bones in dwelling reinforcement or its association with burials indicate this proboscidian was deeply involved in the Gravettian-Pavlovian everyday life and economic system. But we do not really know
what the precise part of the mammoth was, because we do not know if all the mammoth settlements are representative of the whole Gravettian subsistence economy. Indeed, as we do not have any seasonal data on mammoth, we do not know when the sites were occupied: we do not know if mammoth was or not a seasonal resource and if its products were exploited all year round. So we will have to know which were products required and consumed and when in the course of the year. Zooarchaeological study of Milovice will try to answer three main questions. Was the mammoth first exploited for the meaty products or for technical ones? If we can suggest that the meaty products came from mammoth, as there is just a few number of reindeers and horses remains, we tried to identify the part of ivory procurement and exploitation. Which were the consequences of this choice on the procurement strategy (in terms of individuals)? Finally, have Gravettian groups exploited mammoths at Milovice at the same season or at different moments in the year? This question is also important because Milovice differs from Dolní Věstonice and Pavlov, and seems, for now, to look like more a kill or butchering site than a residential site.
VII. 3 Origin of the faunal remains
Milovice is an open-air site with “independent” areas that, moreover, delivered different radiocarbon dates. So, we considered all the faunal remains as many assemblages (areas) that we have studied in a separate way.
A. Bone-accumulating agents
Bone accumulations may result from two agents: the “natural” processes (geological or not) and the biological processes (humans and carnivores). Two kinds of natural processes can produce a bone accumulation of dozens of mammoths in a delimited area. The first one is a catastrophic Figure 6 Class size proportion of bones (in cm).
event (like drowning or getting stuck in a bog, at swallow hole, waterhole, or due to lightning): the death of many individuals at the same moment, at the same place (considered as “aggregating points” like water place or mineral resource place, Soffer 1993), or the natural death at the same place for a longer time span and related to an environmental stress. If accumulations are not disturbed, we should expect to a non-selective skeletal parts representation. But we cannot expect any typical age profile, which depends of the social group(s) where the individuals come from (isolated individuals, small bands of adult, familial groups): it could be a catastrophic mortality profile as a selective profile representing the age structure of the dead group. And as the kind of the social group whose individuals died at this place depends on the season, it is imperative to identify the season of death to analyse the mortality profiles. Natural death could produce special bone dispersal: amount of bones in a swallow hole, individuals with vertical skeletal elements when animals died in a bog. The most important idea is that scattering occurred from the central point – the full skeleton – at the death place (Lyman 1994). Then the body position of several individuals at site is also indicative. The presence of articulated skeletal elements is also a good clue for getting information about the natural death pattern. The second type of natural bone accumulation is a secondary deposit due to a fluvial transport or sediment movements. In the first case, the site is located on riverbanks, dried bones have been
moved by flotation and, because of the bone and teeth density difference, the representation of skeletal parts is selective. In the second case, carcasses or dried bones are disturbed but accumulated because of a sediment movement. This process can occur several times, affecting a same assemblage until the complete stability point is reached. Spatial records, when existing, are useful, like the vertical position of bones or some specific carrion damages on axial skeletal part of individuals who died in a swampy spot (Weigelt 1989). In the case of a fluviatile dispersal of remains, the bones are sometimes in a unidirectional deposition that corresponds to the river current (Brugal 1994).
Can carnivores accumulate such bone assemblages? Actually, hyena is the only carnivore that accumulates large animals bones, at open-air places as well as into caverns. Hyena that lived 25 000 ago, could have accumulated some young mammoth skeletal bones, as Lister demonstrated for a middle Palaeolithic English site (Lister, 2001). In the same way, G. Haynes (1987b) indicates actual african hyena and lion accumulate elephants bones. Nevertheless, several hyena open-air dens sites existed during upper Pleistocene, delivering bone accumulation. But usually these sites are situated along rivers (Morava River and Vltava River in Czech Republic) and hyena carcasses belong to the faunal sample (Diedrich 2006). rhinoceros is sometimes indicated. In the case of carnivore Figure 7 Map of the successful refits in the concerned areas.
accumulation, skeletal parts representation is very selective (uncompleted skeletons) and age profiles are selective in favour of individuals under 12 years old (Haynes 1987b).
Bone accumulations can also result from different human procurement pattern: collecting of dried bones of animals that died many years ago (natural death or not), scavenging on fresh carcasses, hunting. It is very difficult to get evidence of a human origin only from an age profile because it depends on the procurement pattern. It is first necessary to be sure it is not a natural accumulation and we need many kinds of data to argue. In the same way, skeletal parts representation is different, according to procurement and exploitation pattern. Then the dispersal of remains, associated with human artefacts can reveal different human behaviour and site specificities: bone accumulation can reflect butchering activity, ritual deposits, dwelling construction or consolidation, or raw material exploitation area. In many cases, the bone dispersal reveals a human behaviour, different of a natural scattering process, as describe above.
The different criteria do not have the same importance and efficiency. Some criteria permit to rule out hypothesis but are still not sufficient used alone (site location, skeletal parts distribution). On the contrary, some criteria, in special case, can immediately answer the origin of the bone accumulation (age profile).
B. The Milovice data
Does the mammoth bones assemblages result of a natural death origin? As described above (cf. supra) natural causes of mortality are related to special geomorphological, geological context and/or resources distribution, in other words to peculiar places. Milovice is one of the only sites that is not located in such special place. Indeed, Milovice bone accumulation is situated about one and half kilometres from the Dyje River, in a dry and blind small valley. Geomorphological study indicates the Dyje River was (27 000 years ago) at the same level and almost in the same position than today (Oliva, pers. com.). Moreover, on this slope of the Pavlov hills, no cliff, no waterhole, no spring water and no mineral resource did not
exist. So, we can exclude the hypothesis of a natural death pattern (primary deposit) related to a dangerous aggregating point. The absence of surface water also allows us to exclude the hypothesis of a secondary bone deposit. This is confirmed by the geomorphologic study that indicated the main part of the site did not moved, a unique original deposit.
There is no doubt concerning the origin of Milovice mammoth bone accumulation: it is not due to natural causes.
Does the demographic data analysis confirm this conclusion? In case of an origin that is not due to natural factors, the age profiles should not look like living profile (also named “catastrophic”) that represents the whole living proboscidian population in terms of age and sex (Figure 9, Haynes 1987b; 1991).
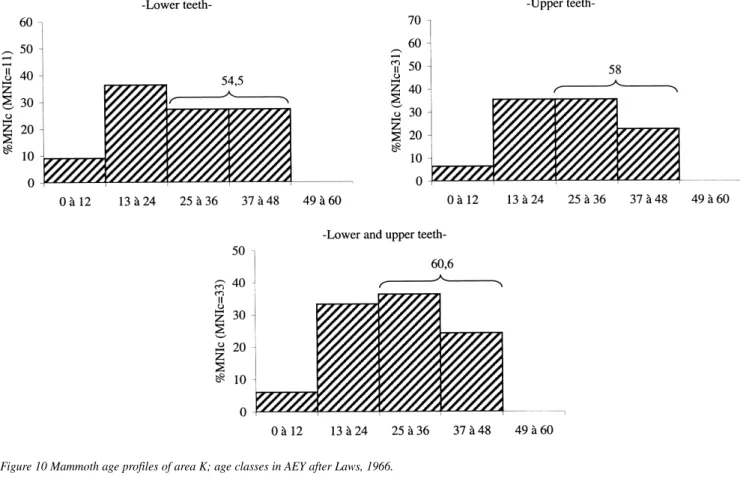
The Milovice mammoth age profiles were realised thanks to the 159 identified molars and based on lower teeth (74). We established age profiles for the two largest areas (A+B and K) that delivered the largest number of teeth and individuals. We used the minimum number of individuals (MNI) for a better comparative data with ever published age profiles, specially the MNIc because it is the closest of the real number of individuals of the preserved dead population (Poplin 1976). We first used the Law’s classes (1966) in African Elephant Years (AEY) for age determination and we established the age profiles following the G. Haynes (1991) 12 years age interval. As area K delivered a great number of upper teeth, the age profile we analysed is based on lower and upper teeth.
In the profiles of area K, all age classes are represented, the 49–60 excepted (Figure 10). 60% of individuals are adults, 30% are subadult, and there are only two young (10%) individuals: the youngest animal is a newborn or a foetus identified thanks to a bone remain. The area A+B profile is similar: the oldest individuals are missing and adults account for more than 70% (Figure 11). There are also some differences: subadults are less represented and young individuals are more numerous (considering two early newborns identified on upper teeth). We can conclude that Milovice age profiles clearly do not correspond to the “catastrophic” living structure: that confirms Figure 8 Species representation at Milovice, mammoth excepted.
the death was not natural. Now raises the question of the predator that is responsible for such a bone accumulation.
As any carnivore is able to kill and remove an adult mammoth, it is clear that Milovice mammoth bone accumulation is not due to a carnivore. Adults are the most represented in the age profile that is very different from a hyena accumulation (young only: see Chap. ?II.A.). Moreover, all the skeletal parts are represented at the site, even the biggest and the heaviest ones, and no bone has been selected up (see Appendix I, V & VI and cf. Figure 3 & 4). Then, bone accumulation reaches up to 40cm thick, which is absolutely not characteristic of hyenas’ accumulations. All these data exclude hyena as responsible for Milovice bone accumulation. Nevertheless, some marks indicate a gnawing activity related to carnivores Figure 9 Proboscidian living age profile, after Haynes, 1991; age classes in
AEY after Laws, 1966.
Figure 10 Mammoth age profiles of area K; age classes in AEY after Laws, 1966.
(mainly wolf), but even if some bones may have been completely consumed or removed by carnivores, the gnawing activity was very limited, affecting 0,1% of the faunal remains (Table 4). The carrion activity practiced by carnivores is very low face to the abundant attractive meat and bone remains, even if we consider some bones have disappeared (completely consumed or removed). How to explain it? Looking at the detailed bone parts gnawed, we noticed the long bone epiphysis were the most concerned and always chewed by their internal part (cf. Table 4 and Figure 12). That demonstrates the greatest part of the epiphysis sample was not fused and that carnivore action took place after meat has disappeared and bones were slacked.
A gnawed and chewed femur’s head confirms it. Indeed, as the femur has to be out of the acetabulum, it means that all the muscles and tendons were altered and slack enough to be separated. These data confirm carnivores were not involved in Milovice bone accumulation process.
Now we demonstrated neither a natural death nor a carnivore was responsible for the mammoth bone accumulation, we have to confirm that it is related to human groups. The most striking point we have to emphasize is the very low proportion of upper teeth (one of the most resistant body parts), specially the tusks. Thought thousands of pieces have been collected, we know it represents only a few tusks broken in situ. If we consider the 48 mammoths (at least) older than 12 years old (wearing the heaviest and longest tusks) and identified thanks to the molars coming from areas K (MNIc=31) and A+B (MNIc=17) only, we should expect to find at least 96 tusks. As only 9 have been identified, it means 90,7% of ivory is missing. This lack of ivory is too important to be due to a natural cause and we know that in natural sites, tusks are represented following the MNI (Maschenko et al. 2006).
As it is clear that human groups are responsible for Milovice mammoth bone accumulation, we have to identify the procurement pattern: collecting or hunting?
C. Procurement pattern 1. Collectors or hunters?
To identify the two main ways to get bones, collecting and hunting, it is necessary to use taphonomic data, age profiles and skeletal parts representation. Indeed, as we demonstrated that the mammoth accumulation is not due to natural causes, scavenging hypothesis is conceivable. In the case of collecting, a heterogeneous body part representation would be expected, human groups selecting some skeletal parts. Moreover, if bones collected came from several individuals, dead at different places and moments, bones that form the heaps should not be altered in the same way. The hypothesis of collecting can easily be rejected for Milovice thanks to the homogeneity of bone preservation and skeletal parts representation (cf. ????????Chapter I) that indicates an in situ death: bones have not been collected on dried or fossilized mammoth carcasses.
Do the data confirm the last hypothesis of mammoth hunting? The age profiles clearly indicate that individuals have been selected, (at least for area A+B): the great part of adults and subadults, as the scarcity of young, does not correspond to
natural profiles and the absence of the oldest ones cannot be explained in another way. Considering the actual demographic data (sex ratio and age profile) of elephant, we can get some information related to hunting strategies. The matriarchal herds (15 to 30 individuals) are composed of old, adult and subadult females and young of both sex. Males leave the herds when they reach sexual maturity, from 12 years old and live alone or in small bands all year round, mustering females only during mating period.4At least one bull younger than 29 years old has
been identified in area A+B thanks to an unfused distal epiphysis of femur. It indicates at least one individual, isolated or coming from a small male band, has been killed. In the two main areas, six females have been identified (Sedláčková, this volume) and the presence of very young (foetus close to birth or/and newborns) also indicates matriarchal herds have been hunted.
Considering these results, it seems that human groups have hunted adults coming from matriarchal herds and at least, one adult male. The cultural remains do not contradict the hunting procurement pattern: presence of lithic points, sometimes fractured, corresponds to used weapon. The quantity of weapons and their size is not related to success in hunting mammoths as shown with actual proboscidian experimental or at Clovis sites (Frison 1989; Frison – Todd 2001).
2. Season of hunting
Is there any indication about season of mammoth hunting? Was mammoth hunting a seasonal activity, or was it practiced all year round? Direct seasonal data on mammoth are scarce. There are very few indicators compared to other species: teeth are useless, the first one excepted (dp2 or M1), and it is difficult to use tusks growth (Fischer 2001). The best indicator of season is the presence of newborns. Indeed, in periglaciar environment, it is admitted that herbivores give birth at the beginning of the warm season to increase the survey chances of their young (Guthrie 1990). Thus, the published seasonal data often concern only faunal remains associated with mammoth (Péan 2001b; Musil 1994; West 2001a) or other analysis like anthracology (Opravil 1994) or micro-usewear analysis (Tomášková 1994). Only F. A Fladerer (Gravettian of Lower-Austria) and S.C.
4) In arctic context and for Palaeolithic times, it is admitted mating period occurred in summer time, as the birth period occurred in spring (Guthrie 1990).
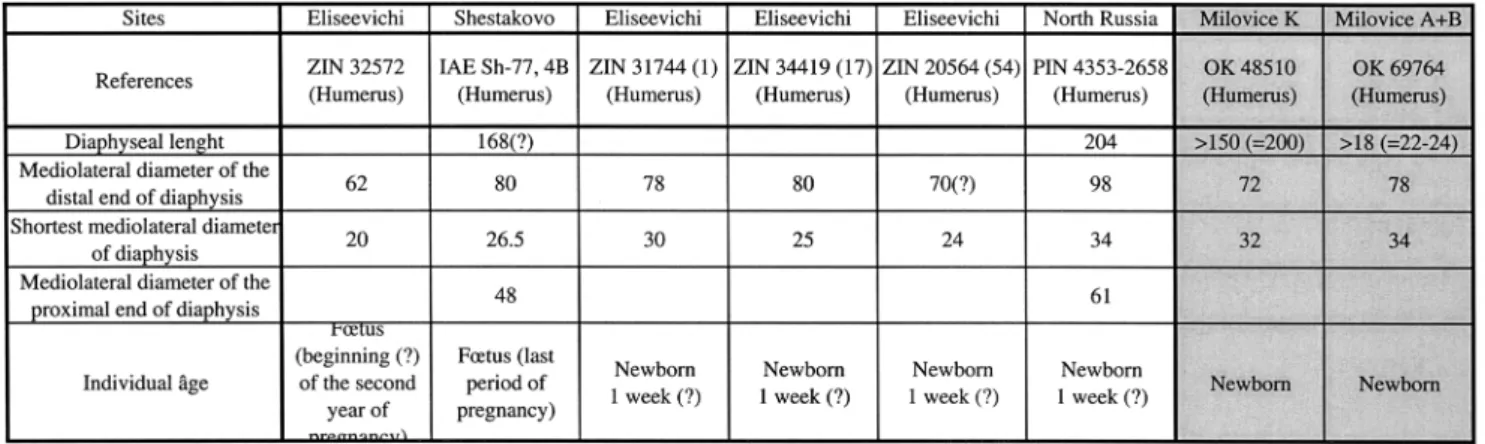
Münzel (Aurignacian and Gravettian of Souabian Jura) identified seasons of mammoth hunting from suckling mammoths’ study (Fladerer – Salcher 2004; Münzel 2001). Milovice faunal collection (G excepted) contains at least one foetus and three early newborns: two teeth (unused dp2), a femur (A+B), a half part of an axis (A+B), two humerus (K and A+B), two ulna (R and K), a zygomatic (A+B) and a pelvis (A+B). We compared the two humerus size with the data published by E. Maschenko (2006), (Table 5): mammoths were very close to the birth date or very recently newborn. A humerus of 245 mm length (A+B) also indicates this individual is a little bit older. Still in area A+B, one calf is one year old according to a tibia diaphysis length of 190mm. If we consider the size variation of individuals at a same age and a time span of birth for mammoth, the death period of these six individuals would be at the beginning of “warm” season (spring). So we propose a death period (at least for some mammoths) at the beginning of spring, at least for pregnant females and some newborns. The presence of a one-year-old calf also indicates this individual and its mother (not pregnant) were also in the area at this period. So at least six individuals have been killed in the early spring/beginning of the warm season. If this seasonal indication is fragile because of the few individuals involved (accounting for 7% of the total MNIc based on teeth and bones), we notice it concerns three different areas (A+B, K and R).
So, at least some of the mammoths coming from family herds have been killed around the birth period at Milovice. If this season cannot be extended to other individuals, the fact that it is the same for at least in three different areas indicates a recurrent hunting pattern.
It is clear that Milovice bone accumulation is related to human groups who hunted mammoth, at least during the spring when females gave birth in the area.
VII.4 Mammoth exploitation A. Butchering activities and meat procurement
mammoth died at Milovice, as demonstrated by complete carcasses and the homogeneity of the right/left ratio (cf. figure 4). To understand how the carcasses have been exploited, skeletal parts distribution have been analysed in detail. In areas K and A+B (Figure 13), all the bones were identified and their rates are not very similar. Are only bone density and size responsible for this representation? Pelvis and mandible are the best represented in area A+B (100%) as the femur in area K, like in natural death sites where pelvis, femur and scapula are the best preserved (Haynes 1991). For every body part, a bone is always represented between 60 and 80 % (Femur, Scapula, Thoracic vertebras or ribs) and the representation of the bones inside every body part is homogeneous. Finally, leg extremities and other vertebras are the less represented, especially phalanxes and metacarpal V that are the smallest bones. The size of cervical, caudal and lumbar vertebras also explains its low representation compared to large thoracic ones (that are more numerous in a skeleton). Density of these bones is also the lowest, as for patella, sternum, and metapodials. So the only parts whose low representation cannot be explained by size or density criteria are molars and tusks. It means human groups could have selected these teeth and taken it away, as we have no evidence of such a behaviour for bones. This lack of teeth, tusk especially, concerns the whole site of Milovice, as it has also been demonstrated by S. Péan (2001b) but not for any other Moravian sites. So the natural processes is responsible for a great part of bone destruction and human groups only removed ivory. If carnivores and carrion crow removed and gnawed some parts (axis in area A+B), it affected very few bones.
Mammoth kill offers a great amount of meat and marrow immediately available for the human groups. Have the Milovice mammoths been exploited for their nutritive contribution? To identify the butchering activity, classical clues are accidental cut-marks let on bones, or the breakage pattern related to Figure 15 Fragmentation types recorded at Milovice.
marrow removal. Whatever the Palaeolithic period, it has been noticed that when proboscidian carcasses exploitation have been identified, cut-marks were always scarce (Gaudzinski et al. 2005). It has also been noticed on actual elephant butchering practice by African societies who do not leave any or very few cut-marks, even using metallic knives and tools (Crader 1983). Cut-marks may have been scarce or may have disappeared because of their superficial position: thickness of tissues rises, as the cutting tools’ sizes are not. Experimental studies demonstrated that it is easily possible to butcher a proboscidian without leaving any cut-mark, even for dismembering operation (Frison 1989; Frison – Todd 2001). And, as known in some Palaeolithic sites, the use of bone tools as knives can also reduce the cut-marks frequency (Hannus 1997). Considering these points, whatever the quantity of cut-marks, even none, it is not conceivable to evaluate the importance of meat removal. Difficulties for identifying butchering pattern also concerns marrow exploitation. Breaking a mammoth bone is not so easy as for a middle size mammal. The bone fragments produced by a human breakage pattern look different and have been detailed by Biberson and Aguirre (1965). Because of the size, used as hammer less efficiency and much more difficult than throwing a bone over an anvil (Louguet – Lefebvre 2005).
Did some indications about meat and marrow removal exist at Milovice? Over the thousands of bone remains, only one rib (area K) clearly wears parallel butchering cut-marks (Figure 14).5 Face to the low number of other species’ individuals associated with the proboscidian ones, we nevertheless suggest meat exploitation was one of the main procurement. Butchering clues also exist in area G, with more evidence (Péan 2001b).
Concerning marrow removal, indications are also scarce: the spiral fragmentation is the less frequent one, among the four type recorded (Figure 15). But added to the fragment types described by Biberson and Aguirre (1965), it can be distinguished from the natural fresh state natural fragmentation. It also indicates marrow removal had been practiced very occasionally, which is different to the reindeer and horse long bones, systematically broken on the same areas. Finally, another kind of object has been recognized. One hundred ribs coming from areas A+B, K and L, are systematically broken affecting the middle thoracic cage section only at 17–23 cm away from the head. These longest ribs are freshly fractured by flexion, sometimes producing a “languette/sifflet” on their spiral edges (Figure 16). This pattern could be the result of a human butchering process while trying to reach the viscera or to open the thoracic cage. The fracture would result from a flexion movement, which is coherent with the occasional strips observed. These ribs could also have been used, as a technical support that remains unclear, as no analogous rib exist. Ribs have always been useful for human groups like in the German Gravettian of Geiâenklösterle (Münzel 2004), or in older sites like in Salzgitter-Lebenstedt (Gaudzinski 1999).
So we suggest meat removal has been one of the main goals of mammoth procurement.
B. Raw material exploitation
Mammoth exploitation was not only focused on nutritive products. The Gravettian-Pavlovian of Moravia is famous for its mammoth bone industry and Milovice is also concerned: we identified for the first time several mammoths worked bones. No ivory items or wastes fragments have been identified, as area G delivered a single worked piece of ivory wearing grooves (Péan 2001b). What was the part of this organic exploitation in the 12 areas? What was the contribution of Milovice mammoths to the bone industry of the human groups of Moravia?
1. Bone use (see also Oliva – Zelinková?????, this volume) The technical use of mammoth bones is for now demonstrated at Milovice. Two femurs (area A+B, Figure 17) are notched longitudinally by a linear series of eight to eleven impact points. These impacts concern the anterior face of two femur. The opposite face presents a full longitudinal spiral breaking pattern running for 90% of the diaphysis length. The distal end of the diaphysis thus presents a pointed morphology. This part has not been active (as a stake – to be confirm with microscope study), no more for saw-toothed diaphysis resulting from the notches series (as a big knife). That is why we think these bones were used for bone flake production. But such bone flakes have not been recognized in the collection. Some splinters do exist in area K but do not result from femur exploitation no more than any other. Bone flakes are known in Palaeolithic sites from Middle and Upper Palaeolithic and some of them may have been used as knives (Hannus 1997; Antl – Fladerer 2004; Gaudzinski et al., 2005). This exploitation is not isolated in the Gravettian area: a similar femur is known at Krems-Wachtberg (Austria), and a similar technique was applied on an ulna at Krems-Hundssteig (Austria), (Fladerer 2001a; Fladerer – Salcher 2004). At Dolní Věstonice, the long bone notched seems to be the final object and its morphology is different with a long flat part of the bone remaining.
Other bones have been worked. Indeed, ribs may have been used as smoother. One (in area R) is very smoothed on its distal end and all over the diaphysis section. This extremity is very similar to the “lissoir” made with reindeer bones and antlers in other Palaeolithic sites. Another one (area K) has to be confirmed. At last, the high potential of heavy bones was not so exploited at the site by the human groups: only one circular structure is known in area G (Oliva 1989b; this volume) while none have been identified in other areas. The spatial analysis does not show any clear spatial organization of the mammoth deposits. M. Oliva noticed some possible long bones intentional disposition in few areas (see this volume) but this is still unclear.
Finally, some of the worked bones are more problematic. In area A+B, a nearly complete rib (60 cm) wears intentional grooves (Figure 18) made of several deep incisions on the anterior and posterior sides. Unfortunately, the edge is broken and we do not know if these incisions are peripheral or not. Two “incised ribs” are known at other sites but present a wider area of transversal incisions resulting from a longer utilisation or a multiple utilisation; they probably belonged to another type of object. One is known at Grub/Kranawetberg (Antl – Fladerer,
5) Among the numerous bones wearing “excavating tools cut-marks”, we checked with a binocular some of the most problematical ones: all were rejec-ted. Also this rib is the only remain of the 12 areas wearing cut-marks, all species considered.
2004), and one at Krakow-Spadzista (Wojtal – Sobcyzk 2005). These marks are more relevant of a technical or symbolic behaviour than butchering activities. The rib may have been used as a cutting board. But in this case, many bones present a better flat surface even other ribs closer to the first one model. The cutting area is narrow and intentional production of these grooves is more conceivable.
2. Missing ivory
In the Gravettian-Pavlovian society of Moravia, mammoth ivory was one of the greatest requested raw materials, with mammoth bones and reindeer antlers. This commodity makes mammoth very attractive as well as reindeer antlers or the fur of small games. What was Milovice ivory procured for? We noticed (?????????? cf. Chap. II) ivory was missing when compared the expected number of tusks to the effective one. Considering the whole areas6, ivory is still missing. Among the 54 individuals older than 12 years old, only 19 tusks (at least) have been counted, which only represent 17,5% of the total ivory (Figure 19). This lack is not due to natural preservation (as demonstrated in Chap. I) but to a human procurement. Tusks’ removing is possible following two different techniques (Khlopatchev 2006; Christensen 1999). First, by sawing, grooving or breaking fresh ivory, but it directly affects the raw material. Another operation consists in cutting around the incisive bone then to destroy it that preserves the raw material. Finally, an easier possibility is to
remove dry tusks. At Milovice, any of the 12 areas delivered worked ivory and three middle-sized tusks were naturally broken (Christensen, pers. com.). If most of the skulls are crushed into pieces, we did not recognize any impact point, so smashing maxillaries and incisive bone to get ivory is not proved. There is also a deficit of tusks in area G (Péan 2001b) that can be explained by the importance of young animals in the assemblage. It seems clear that the major part of Milovice mammoths’ tusks have been removed, carried away maybe in a fresh state.
Is tusk ivory the only one to have been exploited? Some lower molars are missing in area K and upper molars are missing on area A+B (Figure 20). Once again, considering the good enough preservation of the remains, the only human exploitation can be responsible for this deficit. We noticed less than ten mandibles worn their molars, which indicates the removal of teeth was not systematic and nothing argue for a fresh or a dry extraction. Some molars were used as scraper at Dolní Věstonice and they are numerous at Předmostí (close to 1000). Roots have been also worked in Lower Austria (Antl – Fladerer 2004).
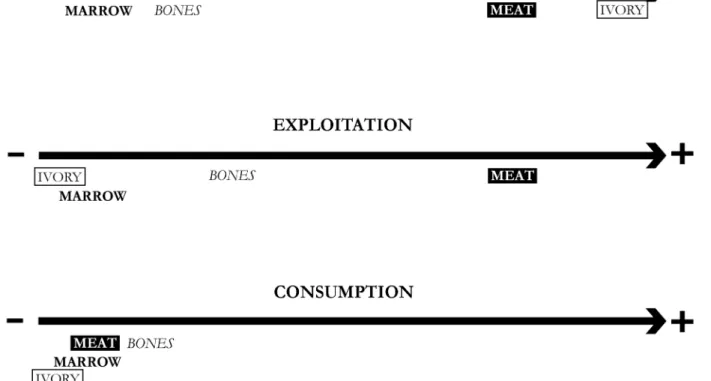
Ivory exploitation at Milovice was undoubtedly one of the main activities at the site. Most of the tusks was removed and taken away. Finally, even if mammoth was the main food resource at Milovice, it is highly probable that the preferential hunt of the biggest animals of matriarchal herds could have been directly related to ivory exploitation.
6) Other areas delivered isolated teeth or mandibles allowing to establish MNIc: H=2 (13-24 y.= 1, 25-36 y.=1); C=2 (13-24 y.= 1, 25-36 y.=1); N=1 (37-48 y.); D=1 (13-24 y.); L=1 (0-12y.)
Figure 19 Mammoth tusk deficit at Milovice.
At Milovice, meat and ivory looked to be the most attractive commodities (Figure 21). We suggest part of the meat removal was important and part of marrow was occasional. We got more evidence for ivory removal (more than 80% of deficit), affecting tusks of adult mammoths. A few bones were slightly used at the site in a technical goal. We also note the absence of any burnt mammoth bone, a rib fragment excepted (in area R). The lack of sieving (area G excepted) does not explain such an absence: human groups did not use bone as a combustible.
VII. 5 Conclusions
Milovice mammoth bone accumulations are the result of hunting episodes. The Gravettian-Pavlovian groups hunted mammoth, selecting adults and subadults among family herds. It seems mammoth procurement was motivated at least by ivory, meat, and, a lower part, marrow. The main evident exploitation is ivory: the high deficit of tusks, and in smaller part, molars, indicates this raw material was lusted after. Ivory was procured and removed but not worked or used at Milovice. As S. Péan (2001b) concluded in the same way for area G, it appears Milovice was a killing and a butchering place. The low density of lithic remains, the absence of art and the scarcity of bone industry suggest Milovice was a short-time occupation place (Oliva, this volume), that our study confirms and makes Milovice an atypical Moravian site (Musil 1997; Oliva 1989b). Finally, if mammoths were in Milovice area during springtime,
it means it could have been a part of a birthplace area that could maybe explain the choice of such a place by human groups. It could be reported as a “complementary” site related to the Pavlovian culture but the lack of data about subsistence patterns in Pavlovian sites is cruelly missing. Moreover, as we do not know if we have a selected or a complete view of the Gravettian cultural complex of the wide Moravia, it is not possible to characterise the Pavlovian economy, especially if some kinds of sites are missing. Jarošov II-Podvršťa is maybe such a kind of different site, where mammoth is missing, the great majority of game being small animals (Musil 2005). The lack of seasonal data also prevents to conclude and characterise mammoth exploitation over a complete annual cycle. We just know mammoths were killed in winter at Krems-Wachtberg (Fladerer – Salcher 2004) and at the end of winter/beginning of spring at Grub-Kranawetberg (Antl – Fladerer 2004).
In the same way, even though the mammoth bone (and lithic) industry from Milovice shares some characteristics with sites in Lower Austria, more evidence is necessary to understand the cultural links between Moravia and its border areas.
Acknowledgment
We are grateful to Dr. Oliva for his confidence and his help to make the work easier at Brno and Budisov. We also thank M. Christensen for her help and discussion about tusk ivory breakage pattern.
Table 2 Detail of the different bones and teeth refitting at Milovice.
Table 3 Detail of the successful refitting.F Table 4 Number remains gnawed by carnivores. Table 1 Species representation at Milovice.
Table 5 Compared measurements of foetus and calves mammoth humerus of Milovice to E. Maschenko’s data (2006).
APPENDIX I
Detail of body parts distribution (areas A+B, K, L & R).
A+B (MNIf=29) R L A Total IS %OE K (MNIf=18) R L A Total IS %OE
Head 30 34 13 69 12 19.83 Head 28 31 4 63 12 29.17 Hyoide and Vertebras 4 4 2 827 53 53.81 Hyoide and Vertebras 208 53 21.80 Ribs and sternum 160 147 57 361 39 31.92 Ribs and sternum 88 77 61 226 39 32.19 Foreleg 70 69 14 146 8 62.93 Foreleg 37 39 1 77 8 53.47 Carpals and metacarpals 100 115 3 211 26 27.98 Carpals and metacarpals 61 70 131 26 27.99 Hindleg 82 88 20 177 10 61.03 Hindleg 49 49 4 102 10 56.67 Tarsals and metatarsals 113 104 7 224 22 35.11 Tarsals and metatarsals 58 53 1 112 22 28.28 Phalanx and sesamoids 29 18 104 215 80 9.27 Phalanx and sesamoids 112 80 7.78
Total 588 579 220 2230 Total 321 319 71 1031
L (MNIf=4) R L A Total IS %OE R (MNIf=2) R L A Total IS %OE
Head 3 1 4 6 12 12.50 Head 2 2 12 8.33 Hyoide and Vertebras 24 53 11.32 Hyoide and Vertebras 11 53 10.38 Ribs and sternum 8 7 33 48 39 30.77 Ribs and sternum 6 3 9 18 39 23.08 Foreleg 8 6 1 15 8 46.88 Foreleg 3 4 1 7 8 43.75 Carpals and metacarpals 13 9 22 26 21.15 Carpals and metacarpals 3 3 6 26 11.54 Hindleg 8 7 3 16 10 40.00 Hindleg 1 2 1 4 10 20.00 Tarsals and metatarsals 4 3 7 22 7.95 Tarsals and metatarsals 2 3 5 22 11.36 Phalanx and sesamoids 2 3 80 0.94 Phalanx and sesamoids 6 6 80 3.75
Skeletal part R L A Total R L A Total R L Total R L Cranium 7 10 1675 1695 5 5 5 5 5 10 50 50 Upper teeth 26 29 975 1030 18 20 1 39 19 20 39 48.7 51.3 Lower teeth 6 8 3 17 4 4 8 4 4 8 50 50 Mandible 3 4 280 287 3 4 3 10 4 6 10 40 60 Ribs 92 95 1537 1724 88 77 56 221 121 100 221 54.8 45.2 Scapula 16 17 46 79 10 11 21 10 11 21 47.6 52.4 Humerus 31 25 33 89 13 11 24 13 11 24 54.2 45.8 Radius 11 12 2 25 7 8 1 16 8 8 16 50 50 Ulna 13 15 8 36 7 9 16 7 9 16 43.8 56.3 Carpals 37 48 1 86 37 47 84 37 47 84 44 56 Metacarpals 22 21 1 44 22 21 43 22 21 43 51.2 48.8 Pelvis 10 13 7 30 7 9 3 19 8 11 19 42.1 57.9 Femur 28 50 35 113 18 18 36 18 18 36 50 50 Patella 2 3 1 6 2 3 1 6 3 3 6 50 50 Tibia 21 29 11 61 12 11 23 12 11 23 52.2 47.8 Fibula 16 14 3 33 10 8 18 10 8 18 55.6 44.4 Tarsals 39 29 2 70 33 29 62 33 29 62 53.2 46.8 Metatarsals 25 24 49 25 24 49 25 24 49 51 49 Phalanx I 1 4 42 47 1 4 41 46 11 34 45 24 76 Total 406 450 4662 5521 322 323 106 746 370 380 750 49.3 50.7
NISP MNE Total after distribution %MNE
APPENDIX Ia Left/right ratio (area K).
APPENDIX II Left/right ratio (area K).
Area (NISP)
A+B (27210)
1280
1207
7134
4602
434
245
1625
22780
25392
C (334)
63
7
187
6
79
206
96
215
314
CH (87)
13
10
44
17
3
3
22
15
87
D (163)
35
16
52
25
45
59
28
63
65
E (13)
9
1
13
2
9
3
11
13
F (37)
10
2
21
3
8
5
10
14
23
H (74)
36
8
63
30
48
35
4
58
69
K (12876)
839
139
1386
2571
801
474
2341
11878
12468
L (1485)
229
20
626
52
137
662
348
890
1373
N (768)
106
11
501
373
112
479
6
44
715
P (185)
11
1
141
6
12
108
10
106
164
R (702)
49
3
374
86
30
143
82
341
643
TOTAL (43934)
2680
1425
10542
7771
1711
2428
4575
36415
41326
Destructive agents
No destructive
L
o
ng
it
udi
na
l
cra
ck
in
g
P
erp
en
d
icu
la
r
cra
ck
in
g
R
o
o
t et
ch
es
W
it
h
eri
n
g
E
x
fo
li
a
ti
o
n
D
isso
lu
ti
o
n
Sm
o
o
the
d bo
ne
s
Ir
on
oxi
d
e
Ma
n
g
a
n
es
e
oxi
d
e
Area A+B 0 20 40 60 80 100
L.C P.C. R.E. W. E. D. S. I.O. M.O.
%N IS P tot a l ( N IS P = 27210)
APPENDIX III Recorded alterations and intensity.
Area C 0 10 20 30 40 50 60 70 80 90 100
L.C P.C. R.E. W. E. D. S. I.O. M.O.
% N IS P tot a l ( N IS P = 334) Area D 0 10 20 30 40 50 60 70 80 90 100
L.C P.C. R.E. W. E. D. S. I.O. M.O.
%N IS P tot a l ( N IS P = 163) Area K 0 20 40 60 80 100
L.C P.C. R.E. W. E. D. S. I.O. M.O.
%N IS P tot a l ( N IS P = 12876) Area L 0 10 20 30 40 50 60 70 80 90 100
L.C P.C. R.E. W. E. D. S. I.O. M.O.
%N IS P tot a l ( N IS P = 1485) Area N 0 10 20 30 40 50 60 70 80 90 100
L.C P.C. R.E. W. E. D. S. I.O. M.O.
%N IS P tot a l ( N IS P = 768) Area P 0 10 20 30 40 50 60 70 80 90 100
L.C P.C. R.E. W. E. D. S. I.O. M.O.
%N IS P tot a l ( N IS P = 185) Area R 0 10 20 30 40 50 60 70 80 90 100
L.C P.C. R.E. W. E. D. S. I.O. M.O.
%N IS P tot a l ( N IS P = 702)
Areas
NISPTotal
Low
High
Total
Low
High
Total
E
13
2
7
9
15.38
53.85
69.23
0.02
H
74
23
13
36
31.08
17.57
48.65
0.08
F
37
7
3
10
18.92
8.11
27.03
0.02
D
163
29
6
35
18.47
3.82
22.29
0.08
C
334
46
17
63
13.77
5.09
18.86
0.14
L
1485
154
75
229
10.36
5.05
15.41
0.52
CH
87
5
8
13
5.75
9.20
14.94
0.03
N
768
101
5
106
13.15
0.65
13.80
0.24
R
702
31
18
49
4.42
2.56
6.98
0.11
K
12876
527
312
839
4.09
2.42
6.52
1.91
P
185
8
3
11
4.32
1.62
5.95
0.03
A+B
27210
728
552
1280
2.68
2.03
4.71
2.92
TOTAL
43934
1661
1019
2680
3.79
2.32
6.11
6.11
Longitudinal fissuration
%NISP Long. fissuration
%NISP area
total
Longitudinal crackings 0 10 20 30 40 50 60 70 80 90 100 E H F D C L CH N R K P A+B % N IS P f o r each ar ea Low High TotalAreas
NISPTotal
Low
High
Total
Low
High
Total
CH
87
8
2
10
9.20
2.30
11.49
0.02
H
74
5
3
8
6.76
4.05
10.81
0.02
D
163
8
8
16
5.10
5.10
10.19
0.04
E
13
1
1
7.69
7.69
0.00
F
37
2
2
5.41
5.41
0.00
A+B
27210
741
466
1207
2.73
1.72
4.45
2.75
C
334
7
7
2.10
2.10
0.02
N
768
11
11
1.43
1.43
0.03
L
1485
20
20
1.35
1.35
0.05
K
12876
112
27
139
0.87
0.21
1.08
0.32
P
185
1
1
0.54
0.54
0.00
R
702
1
2
3
0.14
0.28
0.43
0.01
TOTAL
43934
917
508
1425
2.09
1.16
3.25
3.25
Longitudinal fissuration
%NISP Long. fissuration
%NISP
Perpendicular crackings 0 10 20 30 40 50 60 70 80 90 100 CH H D E F A+B C N L K P R % N IS P f o r each ar ea Low High Total
Areas NISP Total Low Middle High Total Low Middle High Total
E 13 5 8 13 38.48 61.54 100.00 0.03 H 74 15 27 21 63 20.27 36.49 28.38 85.14 0.14 P 185 15 44 82 141 8.11 23.78 44.32 76.22 0.32 N 768 83 219 199 501 10.81 28.52 25.91 65.23 1.14 F 37 9 1 11 21 24.32 2.70 29.73 56.76 0.05 C 334 50 100 37 187 14.97 29.94 11.08 55.99 0.43 R 702 10 74 290 374 1.42 10.54 41.31 53.28 0.85 CH 87 4 22 18 44 4.60 25.29 20.69 50.57 0.10 L 1485 142 253 231 626 9.56 17.04 15.56 42.15 1.42 D 163 23 11 18 52 14.11 6.75 11.04 31.90 0.12 A+B 27210 2602 2520 2012 7134 9.56 9.26 7.39 26.22 16.24 K 12876 777 381 228 1386 6.03 2.96 1.77 10.76 3.15 TOTAL 43934 3735 3652 3155 10542 8.50 8.31 7.18 24.00 24.00 %NRTotal %NR area total Root action Root etches 0 10 20 30 40 50 60 70 80 90 100 E H P N F C R CH L D A+B K % N IS P f o r each ar ea Low Middle High Total