HAL Id: hal-02901400
https://hal.archives-ouvertes.fr/hal-02901400
Submitted on 17 Jul 2020
HAL is a multi-disciplinary open access
archive for the deposit and dissemination of
sci-entific research documents, whether they are
pub-lished or not. The documents may come from
teaching and research institutions in France or
abroad, or from public or private research centers.
L’archive ouverte pluridisciplinaire HAL, est
destinée au dépôt et à la diffusion de documents
scientifiques de niveau recherche, publiés ou non,
émanant des établissements d’enseignement et de
recherche français ou étrangers, des laboratoires
publics ou privés.
An attempt to explain recent trends in European
snowfall extremes
Davide Faranda
To cite this version:
Davide Faranda. An attempt to explain recent trends in European snowfall extremes. Weather and
Climate Dynamics, Copernicus, 2020, 1, pp.445-458. �10.5194/wcd-1-445-2020�. �hal-02901400�
An attempt to explain recent changes in European snowfall extremes
Davide Faranda
1,2,31Laboratoire des Sciences du Climat et de l’Environnement, UMR 8212 CEA-CNRS-UVSQ, Université Paris-Saclay, IPSL,
91191 Gif-sur-Yvette, France
2London Mathematical Laboratory, 8 Margravine Gardens London, W6 8RH, UK 3LMD/IPSL, Ecole Normale Superieure, PSL research University, Paris, France
Correspondence: Davide Faranda ([email protected])
Abstract. The goal of this work is to investigate and explain recent changes in total and maximum yearly snowfall from daily data in light of the current global warming or the interdecadal variability of the atmospheric circulation. We focus on the period 1979-2018 and compare two different data-sets: the ERA5 reanalysis data and the E-OBSv20.0e data, where snowfall is identified from rainfall by applying a threshold on temperature. We compute changes as differences from quantities computed for the periods 1999-2018 and 1979-1998. On one hand, we show that the decline in average snowfall observed in almost
5
all European regions is coherent with previous findings and can be linked to global warming. On the other hand, we observe contrasting changes in maxima and sometimes disagreement in the sign of changes in the two data-sets. Coherent positive trends are found for few countries in the Balkans. These have been investigated in details by looking at modifications in the atmospheric weather patterns as well as local thermodynamic factors concurring to large snowfall events. We link these changes to the stronger prevalence of Atlantic ridge or Blocking patterns associated with deeper cyclonic structure over the Adriatic or
10
the Tyrrhenian sea. These cyclones find warmer surfaces and large availability of humidity and CAPE, thus producing large snowfall amounts, enhanced by Stau effect on the Balkans topography.
Copyright statement. TEXT
1 Introduction
Heavy snowfalls can have a great impact on economy and society. In January 2017, a cold spell affected most of Eastern and
15
Central Europe and part of southern Europe, causing the death of at least 60 people: The combination of snowfalls with a series of earthquake in Central Italy caused a disastrous avalanche that hit the town of Rigopiano in Abruzzo where a landslide swept and destroyed a hotel, causing several casualties (Frigo et al., 2018). On January 8th, accumulations of 22-23 cm have been measured in some points on the beach of Porto Cesareo, in Apulia. Inland, snow reached and exceeded 2 meters in height on the Apennines. Two further recent examples of snowfalls affecting large populated areas are the February/March 2012 snowstorm
20
in northern Italy with up to 50 cm of snowfall measured in Bologna (Bisci et al., 2012), and the winter 2018 snowstorm Emma, which affected UK with up to 40cm snowfall in Wales and the disruption of air and rail transportation in London, Manchester
and Liverpool areas (Tonks, 2018).
Besides their cost in terms of societal and economical impacts, these extreme events are often invoked by climate change
25
denial groups to mystify the public opinion (Revkin, 2008) and it is therefore important to understand why, in an undeniable context of climate change, we do not observe a sharp decrease of their frequency/intensity. Indeed, although global temperature rise has driven an overall decrease of average snowfall in past decades (Déry and Brown, 2007) and this decreasing trend is expected to continue in future “business-as-usual” emission scenarios (Brutel-Vuilmet et al., 2013), it is not clear whether the same conclusions hold for extreme snowfall events. Atmospheric extreme weather events do not always have a trivial relation
30
with average global warming (Murray and Ebi, 2012). The goal of this paper is to shed a light on recent changes in the dy-namics of extreme snowfalls, by projecting the recent changes in frequency/intensity of extreme snowfalls on the large scale (synoptic) dynamical drivers and identifying possible small scale convective thermodynamic feedback.
The focus of this study is to understand changes in daily heavy snowfalls at the scale of European regions and countries.
35
Daily extreme snowfalls result from the interplay of both dynamical and thermodynamic factors, acting at different spatial and time scales: at local (few kms, few hours) scales, geographical features and convection may enhance snowfall precipitations. Persistence of convective snowfalls for several hours on the same region can provide large snowfall amounts detectable at daily time-scales. At synoptic scales, snowfalls are driven by extratropical cyclones ( ∼1000 km, 2-6 days) traveling south-wards in jet-stream meanders formed by the disruption of the normal westerly flow (Tibaldi and Buzzi, 1983; Barnes et al.,
40
2014; Lehmann and Coumou, 2015). Oscillations of the jet stream are associated with low-frequency variability of weather patterns that can modulate daily synoptic fields and snowfall events. (Wallace and Hobbs, 2006). These conditions create a dipole consisting of high pressure structures over some regions and low pressure systems (extratropical cyclones) travelling southward in other regions. The most common way to link low frequency variability to weather phenomena is the computation of daily weather regimes (Vautard, 1990; Michelangeli et al., 1995). In Nakamura et al. (1997)and Yiou and Nogaj (2004), first
45
connections between extreme weather events and weather regimes have been established. Madonna et al. (2017) found a clear link between eddy-driven jet variability and weather regimes in the North Atlantic-European sector. In winter, if blocking high pressure becomes established close to Greenland, cold air from polar latitudes can be advected towards western Europe (North Atlantic Oscillation negative phase (Cattiaux et al., 2010)). When this weather pattern is associated with extratropical cyclones travelling southward from northern latitudes extreme snowfalls over UK, France, Benelux and the Iberian Peninsula are
ex-50
pected. If a high pressure ridge (Atlantic Ridge) extends from the Azores Islands towards the Icelandic region or the British isles, cold air coming from Russia or Scandinavia flows in the Mediterranean Sea. This can cause cyclogenesis in the Tyrrhe-nian (Genoa lows) or in the Adriatic seas triggering extreme snowfalls over Italy, the Balkans, Greece and Turkey (Buehler et al., 2011).
55
When looking at long-term decadal trends in snowfalls, the analysis of weather patterns can provide important information to assess whether the changes in frequency and intensity are due to long term variability of the atmospheric circulation or
induced by antrhopogenic forcing (Strong et al., 2009; Overland and Wang, 2010; Woollings et al., 2010; Wu and Zhang, 2010; Deser et al., 2017). So far, it has been very difficult to prove any significant shift in the dynamical patterns observed at mid-latitudes (Shepherd, 2014). On one side, Cohen et al. (2014) and Kim et al. (2014) showed that the recent increase of
tem-60
peratures in the Arctic is associated with an amplification of planetary waves, affecting storm tracks and leading to enhanced winter conditions. On the other hand, several authors found a zonalization of the mid-latitude flow (Lorenz and DeWeaver, 2007; Chen et al., 2016; Screen et al., 2014; Faranda et al., 2019) and a minimal or even undetectable effect of the Arctic sea-ice on the meandering of the jet at mid-latitudes (Blackport et al., 2019; Screen, 2017; Screen et al., 2018).
65
Although heavy snowfalls are driven by the large scale atmospheric circulation, their effects can be greatly enhanced by local geographic constraints and thermodynamic feedbacks (Lüthi et al., 2019; Bartolini, 2019). Local features like the Alps in Europe the Great Lakes in USA or the topography of Japanese islands may increase precipitation and provide relevant feed-back to extreme snowfalls (Niziol et al., 1995). For Japan, Kawase et al. (2016) have shown that thermodynamic feedfeed-backs from anthropogenic forcing may enhance extreme snowfalls in future climate via the interaction of the Japan Sea polar air
70
mass convergence zone with the topography. A similar mechanisms exist also for the Mediterranean sea, as recently detailed in D’Errico et al. (2019). The mid-tropospheric cold winter air advection associated with the synoptic patterns flows over the relatively warmer waters of the Mediterranean sea picks up water vapor from the water surface. This warmer and wetter air rises and cools as it moves away from the sea towards land areas forming convective clouds that transform moisture into snow. In the mountainous topography of the European continent, this phenomenon can be extremely powerful in triggering heavy
75
snowfalls (Beniston et al., 2018; Bartolini, 2019) even in future climate warming scenarios (D’Errico et al., 2019). We will also consider this effect in driving convection via the analysis of convective available potential energy patterns during extreme events.
The paper is organized as follows. In section 2, we describe the data-sets used in this study and the difficulties arising in
80
assessing the quality of snow data. In section 3 we compute the changes in snowfall extremes and discuss their consistency among the data-sets. In section 4 we focus on those countries showing an increase of maximum snowfall and explain these changes in light of the thermodynamics and the dynamics of the atmosphere at daily scales. Conclusions and limitations of this study are presented in section 5.
2 Data and Methods
85
Good quality snow data at synoptic or regional scales are difficult to obtain (Rasmussen et al., 2012). From an observational point of view, quality observational data-sets exist only at high mountains sites and in regions where snowfalls are recurrent phenomena. Excellent snow data-sets exist for Scandinavian countries as well as for the Alpine regions (Auer et al., 2005; Scherrer and Appenzeller, 2006; Isotta et al., 2014). Our goal is however to study changes in snowfall at a European level, not limiting our analysis to mountain areas but also to those regions where these phenomena are rare. We have therefore to rely on
reanalyses as well as on gridded observational data. In this study we analyse the period 1979-2018 and use a reanalysis product (European Centre for Medium-Range Weather Forecast (ECMWF) Reanalysis 5th Generation product ERA5) as well as grid-ded observations data-set (European Climate Assesment Data E-OBSv20.0e). The reference data-set will be ERA5 (C3S), a very recent product by the ECMWF with high resolution (0.25◦horizontal resolution) and accurate physical parametrizations. For the observations, we use E-OBSv20.0e (0.25◦horizontal resolution) which contains gridded temperatures and
precipita-95
tions observations (Cornes et al., 2018).
Another problem in comparing snow data issued from different sources is the choice of the variable associated with pre-cipitating snow (Nitu and Wong, 2010). Snow precipitations can both be measured as snowfall (SF), or from snow-depth on the ground. Both the measurements have pros and cons. Snowfall is obtained by melting snow falling inside a heated rain
100
gauge and it is expressed in Kg/m2or cm. An advantage of using this variable is the accuracy of the measurement. For obvious
reasons, SF is mostly used by hydrologists as it has a direct connection with runoff and rivers discharge. Since the snow is immediately transformed into water, SF does not distinguish between snowfalls which produce accumulations on the ground or not. Snow depth is a measure of the snow height on the ground and it can be affected by several problems due to gravitational settling, wind packing, melting and re-crystallization. In this paper we will therefore use daily SF and express it in cm. We now
105
explain how to get this quantity from the different data-sets considered in this study.
– For ERA5, we use the accumulated total snowfall that has fallen to the Earth’s surface. This quantity consists of both snow due to the large-scale atmospheric flow and convective precipitations. It measures the total amount of water accu-mulated from the beginning of the forecast time to the end of the forecast step. The units given measure the depth the water would have if the snow melted and was spread evenly over the grid box. We get the snowfall from hourly data and
110
construct the daily SF by summing up the snowfall in intervals of 24 hours. We chose ERA5 data-set as the preferential one for our study because of its physical consistency and the use of advanced assimilation techniques for its compilation.
– For E-OBSv20.0e [40.375W-50E,25.375N-75.375N] only land points, we do not dispose directly of snowfall data. We have to infer them from daily total precipitation and daily mean temperature data. We apply a simple algorithm which consists of considering as SF all precipitations occurred in days where the average temperature is below 2◦ C. Of course
115
with this method we can have false positive as well as false negative events, but we have verified (not shown) that results do not depend qualitatively from the threshold providing that it is chosen between 0◦ C and 2.5◦ C. Since we use a threshold of 2◦C, some of the precipitation would not be snowfall.
We now present the climatology for the two data-sets used in this study and focus on two quantities: yearly total snowfall SF (average 1979-2018) in Figure 1 and the maximum yearly snowfall SF from daily data (average 1979-2018) in Figure 2.
120
We show results at two different levels, taken from the 2016 nomenclature of territorial units for statistics (NUTS) of the European union at regional (NUTS-2) and national (NUTS-0) level Commission (2016). These subdivisions are commonly used by stake-holders to assess impacts of climate variables on economy and society and are the reference adopted by several climate services such as Copernicus for its products (see, e.g. (Brandmueller et al., 2017)). Averaging from the grid-cell size to
regional or national scales give us the possibility of both exploring the robustness of our study to coarse-grain and it also allows
125
to remove part of the variability encountered for precipitation data at grid-level scales caused by model or data issues (Li et al., 2011; Tabari et al., 2016; Herold et al., 2017). In Figures 1-2, NUTS-2 results are represented in panels a,c) and NUTS-0 results in panels b,d). The agreement between the ERA5 and the E-OBSv20.0e data-set largely depends on the regions considered. Overall, the climatologies of snowfall provided by the two datasets have similar ranges although ERA5 tends to overestimate EOBSv20.0e. This confirms that converting precipitation to snowfall using a temperature threshold of 2◦C is a good option to
130
retrieve snowfall data from EOBSv20.0e. By analysing the climatology we remark that, at southern latitudes and on the plains, mean and max statistics tend to coincide because the number of snow days per year is limited, i.e. all snowfall is concentrated in one or few events. We can also observe from Figure 2 that coarse graining from NUTS-2 to NUTS-0 level heavily reduces the magnitude of yearly maximum SF.
3 Changes in snowfall
135
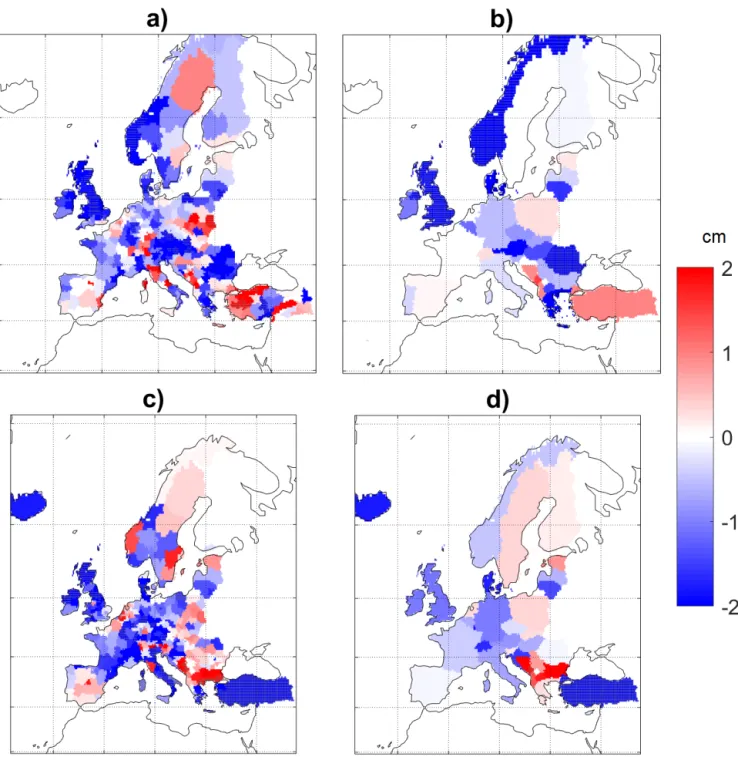
We now identify changes in snowfall as differences between average values of both yearly total SF and the maximum yearly SF for two different periods: 1979-1998 and 1999-2018. We subtract the first period from the second, so that positive changes correspond to an increase in snowfall and negative values to a decrease. To check statistical significance of changes, we perform a two sided T-test with confidence level 0.05 (Rushton, 1952). For the yearly total SF of ERA5 (Figure 3a,b) changes are neg-ative for most of Northern, Central and Eastern Europe, whereas near-zero changes are observed in Western Europe. Largest
140
negative changes are found in correspondence of mountain ranges such as the Alps, the Balkans and Scandinavian Mountains. This decrease in snowfall is significant (green shading) over most of the Northern countries and the British Isles. When coarse grain from NUTS-2 to NUTS-0 level is applied, we can observe that positive changes tend to be averaged out, and significance of negative changes extend to almost all Northern Europe. The picture is similar for the EOBSv20.0e dataset (Figure 3c,d), with mountain regions and Northern countries showing a large decrease of yearly total SF. Positive changes are found in the
145
Balkans at the NUTS-2 scale, but they are partially averaged out when coarse graining data to the NUTS-0 level (panel d). As for ERA5, negative trends are significant for Iceland, the United Kingdom, Finland, Latvia, Denmark, Italy, France and Turkey.
For the maximum yearly SF, differences observed are generally milder and positive and negative changes are spatially scat-tered at the NUTS-2 level (Figure 4a,c) for both the datasets. There is however a certain agreement in maximum snowfall
150
increase over eastern Europe and decrease over western Europe (excluding Spain) among the two data-sets. The NUTS-0 level (Figure 4b,d) provides a more coherent picture with Western Europe characterised by a decrease in maximum snowfall and Eastern Europe where some countries show increasing maximum SF. Significance of changes is low and scattered spatially without a clear geographical coherence. Large differences between the two datasets are found for Switzerland, Greece and Turkey. In ERA5 trends are positive Switzerland and Turkey (negative for Greece) and yield the opposite sign in EOBSv20.0e
155
dataset. We can justify this difference for Greece and Switzerland using the data at the NUTS-2 level (Figure 4a,c) as they show for regions within those two countries positive and negative differences. At NUTS-0 level (Figure 4b,d) the averaging
proce-dure can therefore provide trends of different signs in EOBSv20.0e and ERA5 datasets, depending on the magnitude of local SF maxima. The positive trend in ERA5 for Switzerland is in contradiction with several other studies based on snow stations (see e.g. Scherrer et al. (2013); Marty and Blanchet (2012)). For Turkey, the differences between datasets are evident already at the
160
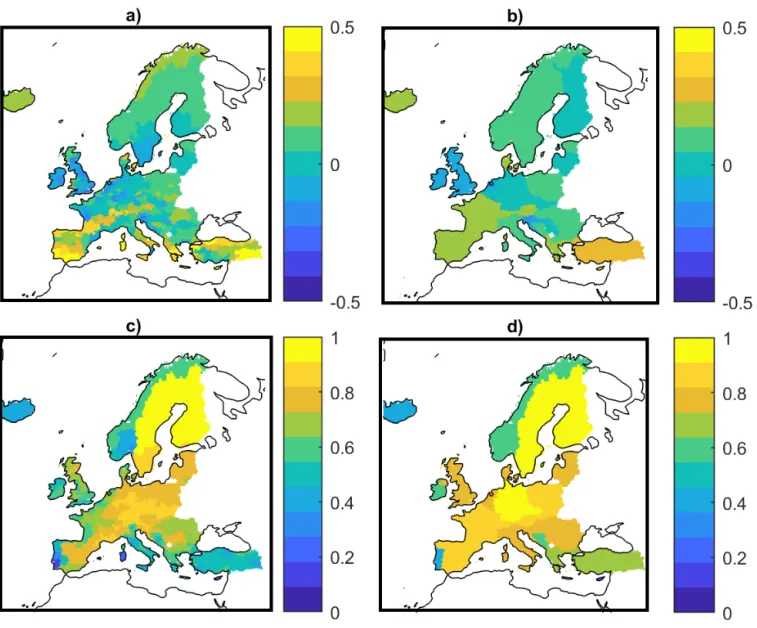
NUTS-2 level and cannot be explained with the spatial averaging. A possible justification comes from the low coherence of the two datasets. This can be checked by computing the symmetric percentage error ς = (xERA5− xEOBS)/(xERA5+ xEOBS),
where x is the total average snowfall for each region and ς ∈ [−1 1] (Figure 5a,b) and the correlation coefficient R2between the daily time series of accumulated snowfall of the two datasets (Figure 5c,d). ς shows that ERA5 tends to overestimate snowfall with respect to EOBS over Southern Europe and underestimate over Central Europe and the UK. Entire regions of Turkey,
165
Portugal and Southern Italy show a weak correlation R2∼ 0.3 between the two datasets, pointing to some problems in the data assimilation possibly due to scarce availability of good quality meteorological data over those regions. Indeed correlation coefficient is larger for Northern European countries that dispose of high spatio-temporal data cover. The error ς reduces and the correlation coefficient R2increase when considering the NUTS-0 level, since local differences are averaged out.
170
The ensemble of these analyses suggest that whereas larger confidence can be attributed to a decrease in yearly snowfall over Northern Europe, changes are more uncertain for maximum snowfall. For the maxima, some coherence appears at coun-try scale: negative changes over Western Europe and positive ones in Eastern Europe, specifically for some countries in the Balkans. The difference in the changes for average and maxima suggest a non-trivial relation between the occurrence of ex-treme snowfalls and global mean warming. In order to explain such changes, we will investigate the role of the atmospheric
175
circulation for the countries in the Baking showing large positive maximum SF changes and with coherent trends between the two data-sets considered.
4 Thermodynamic and dynamical analysis for countries with increasing maximum snowfall
The analysis of Figures 2-3 suggests that changes for maximum snowfall are very scattered and even adjacent regions can show changes of different signs. This makes the single region analysis of trends almost meaningless as robust links between SF and
180
large scale fields are likely to be very weak. We therefore focus on the NUTS-0 positive trends of ERA5. We decide to use ERA5 because snowfalls are produced by the model underlying the reanalysis and naturally associated with coherent circulation patterns. We discard the E-OBSv20.0e data-set as it does not contain other atmospheric variables that could help in tracking the atmospheric thermodynamics or the large-scale atmospheric circulation. We identify the 3 countries showing coherent positive changes for both datasets, namely Albania (AL), Montenegro (ME), Bosnia (BA). The countries selected in the Balkans are
185
interesting because they also show positive or zero trends for total yearly SF in the ERA5 data-set. In this section we focus on the intensity of positive changes regardless of their significance. As pointed out by Altman and Krzywinski (2017), statistical testing based on pvalues presents several limitations, and can produce misleading results even in designed experiments. Here, we privilege the physical complexity of the phenomenon, as information about pure statistical significance has already been discussed in the previous section. In Figure 6a) we show the box-plots of the yearly snowfall maxima organized in the two
different periods (1979-1998 and 1999-2018) for the 3 regions identified. Boxplots provide more detailed information on the nature of changes: whereas for Bosnia and Montenegro the bulk of the distribution shift towards larger values in the second period, for Albania increase of maximum snowfall is mostly due to two outliers, which occur at the end of the second period. For Albania and Montenegro the variability also increased in 1999-2018, while it is stationary for Bosnia.
The analysis presented in Figure 6b) aims at identifying possible seasonal variations of extreme snowfalls. In the polar plot, the
195
radius corresponds to the average magnitude and the angle to the date of the year of SF maxima. For the countries considered, there is a tendency to observe heavy snowfall later in the winter season, although the shift is rather modest.
To understand the nature of the changes, we will analyse the synoptic environment associated with snowfall events from both a thermodynamic and dynamical point of view, analysing indicators of stability of the atmosphere as well as circulation patterns (weather regimes) during the events.
200
4.1 Thermodynamic changes
The first hypothesis to explain the occurrence of increasing heavy snowfalls despite the current global warming trends is that starker sea surface - troposphere temperature contrasts might enhance moisture uptake in combination with reduced stability, that trigger ascending motions and local convergence during snowfall events. This possibility has been explored in other studies by looking at atmospheric stability and air-sea interaction during cold-air outbreaks, albeit for different regions (Papritz and
205
Spengler, 2015, 2017; Czaja et al., 2019). Furthermore, in an event-based study of cold and snowy spells over Italy, D’Errico et al. (2019) link the recent enhancement in snowfalls on the Adriatic regions to the increase of convective precipitations from the Mediterranean sea, which is warming faster than the oceans at same latitudes because of its closed geometry (Gualdi et al., 2013). To explore this possibility, we look at changes in the stability of the flow during the maximum snowfalls using the 2-meters temperatures (t2m, boxplot in Figure 6c) and the Convective Available Potential Energy (CAPE, boxplot in Figure 6d).
210
The choice of CAPE as indicator of stability during snowfall is motivated by previous works (e.g. Schultz (1999); Olsson et al. (2017)) where snowfall extremes were co-associated with the occurrence of high CAPE values. The boxplots in Figure 6c-d) show the spatial regional average of t2m and CAPE during the days of the maximum snowfalls. The analysis for temperature (Figure 6c) suggests that maximum snowfalls tend to be associated with temperatures above the freezing point in the recent period and a reduced variability with respect to the first period. The analysis for CAPE (Figure 6d) is not very informative for
215
two reasons: i) the distribution is highly non-Gaussian, it includes zeros and presents several outliers, ii) convective precipita-tions can originate in nearby regions and being transported.
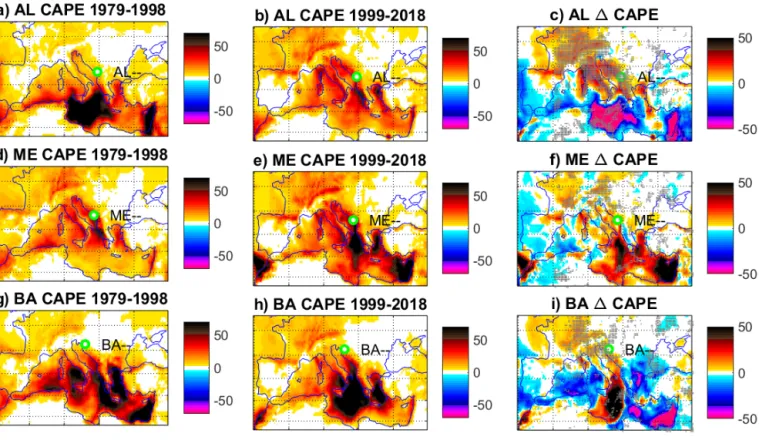
In order to explore this possibility, from bloxpots in Figure 6 we move to the fields analysis in Figure 7 for CAPE and Figure 8 for t2m. From Figure 7 we remark that heavy snowfalls for the 3 countries under examination are generally
asso-220
ciated with large values of CAPE on the Adriatic sea. For both periods, the absolute values of CAPE reached during these events (Figure7a,b,d,e,g,h) are consistent with the range found by Olsson et al. (2017) for the enhancement of snowfall by sea-air interactions. When looking at differences (∆CAPE) between the warmer (1999-2018) and colder (1979-1998) period (Figure 7c,f,i), we remark that there is an increase of CAPE (shaded regions indicate that at least 2/3 of the anomalies yield the
same sign) suggesting that convective instability can be an important factor in Adriatic regions to trigger heavy precipitations
225
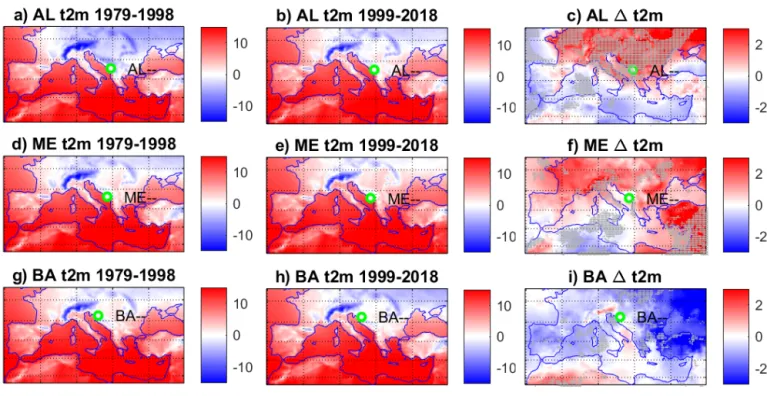
on the Balkans. Furthermore, snowfall extremes tend to occur at or near the freezing point in both colder and warmer cli-mates (O’Gorman, 2014). Figure 8 indicates that this is the case for both the periods considered and that the local temperature difference (∆t2m) between the 1979-1998 and 1999-2018 periods is small. The local temperature is important as it determines the maximum atmospheric moisture content and thus the thermodynamic component of the snowfall amount. While the warm-ing of the Mediterranean Sea durwarm-ing these events (Figure 8c,f,i) favors evaporation, part of the excess moisture to precipitate
230
out during the transport to this location, possibly reducing the thermodynamic enhancement of the snowfall.
4.2 Dynamical Analysis
Since thermodynamic effects alone cannot explain the positive changes in maximum snowfall, we also investigate the role of the atmospheric circulation as a driver of those changes. For other regions of the world, this kind of analysis has provided evidences of a prominent role of atmospheric circulation on the variability of extreme snowfall events (see e.g. Kawase et al.
235
(2016) for Japan, Lute et al. (2015) for Andorra or Guan et al. (2010) for USA). For the countries examined in the present study, the motivation for such analysis comes from the evidence that recent decades show a reduction in the abundance of zonal patterns (Guan et al., 2010).
We first present the sea-level pressure (msl) fields averaged during maxima of snowfall for both the periods in Figure9a,b,d,e,g,h) and their differences ∆msl in Figure9c,f,i). For the three countries considered, cyclonic patterns over the Thyrrenian and the
240
Adriatic sea can be identified for both the periods considered. Following pressure isobars, the flow is advected from sea-to land. In 1999-2018, cyclonic conditions further strengthened in the Balkans with negative ∆msl anomalies over Eastern Eu-rope, suggesting that, in the recent period, moisture advection from the Mediterranean sea to the Balkans has favored snow accumulations on the countries examined. These cyclonic patterns can originate from two different conditions: local cycloge-nesis on the Adriatic sea driven by cold air intrusions from Siberia (Bisci et al., 2012) or cyclogecycloge-nesis on the Thyrrenian sea
245
(Genoa Lows) driven by polar air flowing through the Rhone Valley (Spreitzhofer, 2000). The ∆msl analysis (Figure 9c,f,i) shows the reinforcement of a Eastern Mediterranean cyclonic pattern in the second period. The isobars point to southerly winds which favor uptake moisture from the Mediterranean Sea. Thus, the increase of CAPE over the Adriatic shown in Fig-ure 7c,f,i), together with the reinforcement of the pressFig-ure lows over Italy, could determine the increase in extreme snowfalls in these countries.
250
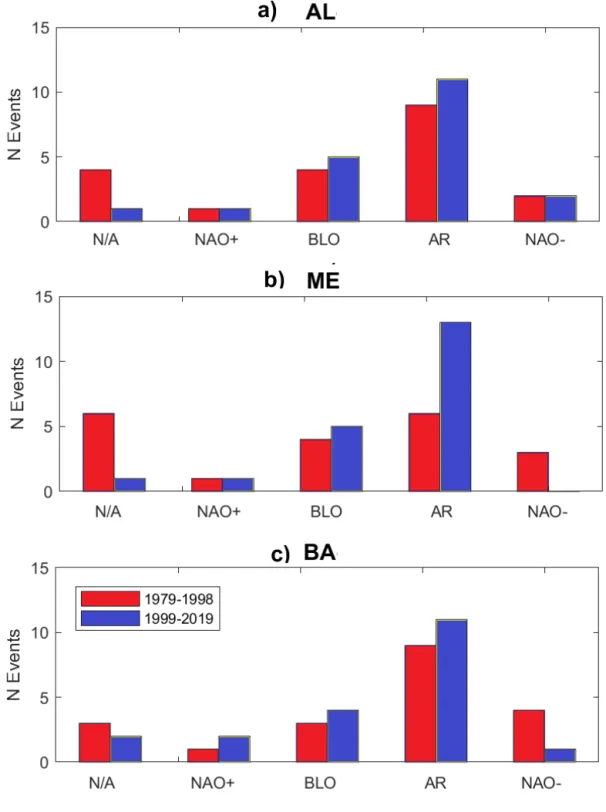
Following the approaches of Vautard (1990) and Michelangeli et al. (1995), we now analyse the shifts in daily weather regimes associated with extreme snowfalls. Weather regime search is performed by using the dynamical systems indicators introduced in Faranda et al. (2017) and using the sea-level pressure fields for the same domain specified in that study, namely latitudes 22.5N-70N, and longitudes 80W-50E. The technique presented in Faranda et al. (2017) allows to determine five pos-sible regimes: North Atlantic Oscillation positive (NAO+) and negative (NAO-) phases, Blocking (BLO), Atlantic Ridge (AR)
255
and non-attributable patterns (N/A). These patterns have been previously identified in many studies over this domain (see e.g. Vautard (1990)). The patterns obtained for ERA5 do not differ significantly from those shown in Figure 2 in Faranda et al. (2017). Results are shown in Figure 10 for the countries examined and show a prevalence of BLO and AR patterns during
extreme snowfall events. These patterns (see e.g. D’Errico et al. (2019) and references therein) favor meridional movements of air masses and therefore the intrusion of polar air to Mediterranean latitudes. It is remarkable that, for all the three countries
260
considered, the second period is characterised by an increase of Atlantic Ridge and Blocking patterns. These pattern consists of high pressure over Western or Northern Europe, favoring dry conditions over Western Mediterranean areas, and low pressure over Eastern Europe, triggering cyclogenesis on the Mediterranean and favoring the intrusion of cold air from Siberia (Ray-mond et al., 2018).
The previous analysis shows that the weather regimes shift is an important factor determining changes in extreme snowfall.
265
However, the statistics presented in Figure 10 is limited by data availability. We therefore extend this analysis by performing an analogs search for the 5% closest sea-level pressure fields (according to the Euclidean distance) to those presented in Fig-ure9a,b,d,e,g,h,j,k) (Yiou et al., 2013). Note that the results do not depend on the threshold used for the selection of analogs in the range 0.25% to 5%. For each of those fields, the analogs search is performed in all the dataset (1979-2018). We then plot in Figure 11 the number of analogs per year. A linear fit is applied to data. Besides Bosnia (Figure 11c), for which the
270
increasing trend in the number of Analogs is significant (5% level), for the other countries considered, trends are not significant. Furthermore no clear differences appear when searching analogs for 1979-1998 or 1999-2018 fields associated with extreme snowfalls. This means that the changes in circulation patterns associated with extremes are specific to those events, and seem not follow some general trends of the atmospheric circulation, thus suggesting a competition between thermodynamic and dynamical factors in their occurrence. The rationale for explaining the changes is the following: AR and BLO patterns occur
275
with the same frequency in winter but their are associated with deeper cyclogenesis in the Adriatic or Thyrrenian sea in the recent period. These cyclones find warmer surfaces and large availability of humidity and CAPE, thus producing large snow-fall amounts, enhanced by stau effect on the Balkans topography. This mechanism is similar to the one described for Japan in Kawase et al. (2016) and for Italy in D’Errico et al. (2019).
5 Conclusions
280
We have analysed recent changes in yearly total and maximum snowfall from ERA5 reanalysis and the E-OBSv20.0e data-sets. We have identified a robust signal in the general decrease in the yearly total snowfall, in particular for Northern and Western Europe. For snowfall maxima, changes are more contrasted: negative changes persist over Western Europe, but in the proxim-ity of the Mediterranean Sea we have identified a certain number of countries showing positive changes. We have focused our efforts in understanding the positive trends for maximum snowfalls in some countries the Balkans which showed consistent
285
positive trends for both the datasets considered. The thermodynamic analysis of atmospheric stability and 2-meters tempera-tures suggest that during recent heavy snowfall events the instability increases and convection is favored, an effect that could be linked to climate change (Ye et al., 1998). This can however be contrasted by the fact that excess moisture could precipitate out during the transport to the snowfall location due to temperatures close to freezing points. The thermodynamic analysis has been completed by an analysis of the atmospheric circulation patterns associated with extreme snowfall over these countries. Results
290
snowfalls in recent times. Even though this could suggest a relation between our finding and the arctic amplification caused by climate change (Vavrus et al., 2017), we stress that the length of the data-sets used is too short to attribute these changes to climate change and that they could be produced by the inter-decadal variability of the atmospheric circulation. Furthermore, the analogs analysis carried out in Section 4 did not show any particular trends in analogs for all the countries considered but
295
Bosnia. Recent studies on whether these patterns are due to low-frequency variability of the Atlantic circulation or to climate change are debated (see, e.g., the discussion in Screen (2017)).
To summarize our findings, there is an interplay of circulation and thermodynamic factors to explain the observed trends in maximum snowfalls on the Balkans: the analysis of CAPE shows that large values of this quantity are associated with heavy
300
snowfalls in the selected countries. CAPE values of 70 JKg−1are enough to trigger convection during winter time and enhance snowfall precipitations (Olsson et al., 2017). Furthermore, for all countries analysed, the isobars associated with the cyclonic conditions embedded in Atlantic ridge patterns indicate winds blowing from sea to land, thus favoring the advection of moisture and the formation of convective precipitation. In addition, the three countries analysed are characterised by mountain ranges that, in presence of sea-to-land flow, favors the Stau effect on precipitations (Bica et al., 2007). Both thermodynamics and
dy-305
namics effect seem therefore to contribute to observed trends, although it is difficult to understand which factor prevails. Only the thermodynamic components of increasing instability can be linked to climate change (Ye et al., 1998). Although winter total precipitations in future climate scenarios is expected to increase over Europe (Santos et al., 2016), global and regional warming is projected to reduce average and extreme snowfall precipitations at least in Central and Western Europe (de Vries et al., 2014). In the same study, de Vries et al. (2014) find that positive trends in snowfalls could still be observed for high
310
mountain areas (Alps and Scandinavia) in warmer climates. This seems coherent with the results found for Japan by Kawase et al. (2016) and in the present study for the Balkans.
This study comes with some caveats. First of all, the changes (especially those on the maxima) depend on the dataset chosen. Here we have focused on consistent trends between EOBSv20.0e and ERA5 and then used ERA5 for the analyses because of
315
the consistent representation of snowfalls with the atmospheric circulation. The lack of longer and highly resolved data-sets for snowfall is a strong limitation and it adds up to the intrinsic difficulty of simulating snowfalls due to their highly non-linear behavior and the fact they involve phase transitions. In addition, we have not considered the effects on the trends of lower frequency variability mechanisms. There are sub-seasonal to seasonal conditions that can trigger snowy waves over Europe by modifying winter atmospheric circulation patterns: the role of stratospheric warming, the magnitude of snow cover on
320
Siberia and in the Arctic region could be taken into account in future research on this topic, e.g. by following the approaches of Handorf et al. (2015, 2017) and Mori et al. (2019). At smaller scales, where convection is important, further studies could be based on searching the origin, transport pathways, and thermodynamic evolution of air masses involved in heavy snowfall episodes, via novel methodologies based on tracking trajectories of air masses as those introduced in Papritz and Spengler (2017), and by using convection permitting models to study sea-air-snow interactions (Bartolini, 2019).
6 Acknowledgments
The author wishes to thank F Pons, S Fromang, P Yiou, M Vrac for the discussions and S Thao for the help with the ERA5 data-set. The author acknowledge the support of the INSU-CNRS-LEFE-MANU grant (project DINCLIC), as well as EUPHEME and DAMA. The author acknowledges two anonymous reviewers as well as the editorial board of WCD for useful comments on the manuscript.
330
References
Altman, N. and Krzywinski, M.: Points of significance: interpreting P values, 2017.
Auer, I., Böhm, R., Jurkovi´c, A., Orlik, A., Potzmann, R., Schöner, W., Ungersböck, M., Brunetti, M., Nanni, T., Maugeri, M., et al.: A new instrumental precipitation dataset for the greater alpine region for the period 1800–2002, International Journal of Climatology: A Journal
335
of the Royal Meteorological Society, 25, 139–166, 2005.
Barnes, E. A., Dunn-Sigouin, E., Masato, G., and Woollings, T.: Exploring recent trends in Northern Hemisphere blocking, Geophysical Research Letters, 41, 638–644, 2014.
Bartolini, W. M.: Convection-Permitting Ensemble Forecasts of the 10–12 December 2013 Lake-Effect Snow Event: Sensitivity to Micro-physical, Planetary Boundary Layer, and Surface Layer Parameterizations, Ph.D. thesis, State University of New York at Albany, 2019.
340
Beniston, M., Farinotti, D., Stoffel, M., Andreassen, L. M., Coppola, E., Eckert, N., Fantini, A., Giacona, F., Hauck, C., Huss, M., et al.: The European mountain cryosphere: a review of its current state, trends, and future challenges, Cryosphere, 12, 759–794, 2018.
Bica, B., Knabl, T., Steinacker, R., Ratheiser, M., Dorninger, M., Lotteraner, C., Schneider, S., Chimani, B., Gepp, W., and Tschannett, S.: Thermally and dynamically induced pressure features over complex terrain from high-resolution analyses, Journal of applied meteorology and climatology, 46, 50–65, 2007.
345
Bisci, C., Fazzini, M., Beltrando, G., Cardillo, A., and Romeo, V.: The February 2012 exceptional snowfall along the Adriatic side of Central Italy, Meteorologische Zeitschrift, 21, 503–508, 2012.
Blackport, R., Screen, J. A., van der Wiel, K., and Bintanja, R.: Minimal influence of reduced Arctic sea ice on coincident cold winters in mid-latitudes, Nature Climate Change, 9, 697–704, 2019.
Brandmueller, T., Schäfer, G., Ekkehard, P., Müller, O., and Angelova-Tosheva, V.: Territorial indicators for policy purposes: NUTS regions
350
and beyond, Regional Statistics, 7, 78–89, 2017.
Brutel-Vuilmet, C., Menegoz, M., and Krinner, G.: An analysis of present and future seasonal northern hemisphere land snow cover simulated by CMIP5 coupled climate models., Cryosphere, 7, 2013.
Buehler, T., Raible, C. C., and Stocker, T. F.: The relationship of winter season North Atlantic blocking frequencies to extreme cold or dry spells in the ERA-40, Tellus A: Dynamic Meteorology and Oceanography, 63, 174–187, 2011.
355
(C3S), C. C. C. S.: ERA5: Fifth generation of ECMWF atmospheric reanalyses of the global climate, 2017.
Cattiaux, J., Vautard, R., Cassou, C., Yiou, P., Masson-Delmotte, V., and Codron, F.: Winter 2010 in Europe: A cold extreme in a warming climate, Geophysical Research Letters, 37, 2010.
Chen, H. W., Zhang, F., and Alley, R. B.: The robustness of midlatitude weather pattern changes due to Arctic sea ice loss, Journal of Climate, 29, 7831–7849, 2016.
360
Cohen, J., Screen, J. A., Furtado, J. C., Barlow, M., Whittleston, D., Coumou, D., Francis, J., Dethloff, K., Entekhabi, D., Overland, J., et al.: Recent Arctic amplification and extreme mid-latitude weather, Nature geoscience, 7, 627–637, 2014.
Commission, E.: Commission Regulation (EU) 2016/2066 of 21 November 2016 Amending the Annexes to Regulation (EC) No 1059/2003 of the European Parliament and of the Council on the Establishment of a Common Classification of Territorial Units for Statistics (NUTS), 2016.
365
Cornes, R. C., van der Schrier, G., van den Besselaar, E. J., and Jones, P. D.: An Ensemble Version of the E-OBS Temperature and Precipi-tation Data Sets, Journal of Geophysical Research: Atmospheres, 123, 9391–9409, 2018.
Czaja, A., Frankignoul, C., Minobe, S., and Vannière, B.: Simulating the Midlatitude Atmospheric Circulation: What Might We Gain From High-Resolution Modeling of Air-Sea Interactions?, Current Climate Change reports, 5, 390–406, 2019.
de Vries, H., Lenderink, G., and van Meijgaard, E.: Future snowfall in western and central Europe projected with a high-resolution regional
370
climate model ensemble, Geophysical Research Letters, 41, 4294–4299, 2014.
D’Errico, M., Yiou, P., Nardini, C., Lunkeit, F., and Faranda, D.: Warmer Mediterranean temperatures do not decrease snowy cold spell intensity over Italy, Scientific Reports (under review), 2019.
Déry, S. J. and Brown, R. D.: Recent Northern Hemisphere snow cover extent trends and implications for the snow-albedo feedback, Geo-physical Research Letters, 34, 2007.
375
Deser, C., Hurrell, J. W., and Phillips, A. S.: The role of the North Atlantic Oscillation in European climate projections, Climate dynamics, 49, 3141–3157, 2017.
Faranda, D., Messori, G., and Yiou, P.: Dynamical proxies of North Atlantic predictability and extremes, Scientific reports, 7, 41 278, 2017. Faranda, D., Alvarez-Castro, M. C., Messori, G., Rodrigues, D., and Yiou, P.: The hammam effect or how a warm ocean enhances large scale
atmospheric predictability, Nature communications, 10, 1316, 2019.
380
Frigo, B., Chiaia, B., Chiambretti, I., Bartelt, P., Maggioni, M., and Freppaz, M.: The January 18th 2017 Rigopiano disaster in Italy–analysis of the avalanche dynamics, in: Proc. Intl. Snow Science Workshop, Innsbruck, Austria, pp. 6–10, 2018.
Gualdi, S., Somot, S., Li, L., Artale, V., Adani, M., Bellucci, A., Braun, A., Calmanti, S., Carillo, A., Dell’Aquila, A., et al.: The CIRCE simulations: regional climate change projections with realistic representation of the Mediterranean Sea, Bulletin of the American Meteo-rological Society, 94, 65–81, 2013.
385
Guan, B., Molotch, N. P., Waliser, D. E., Fetzer, E. J., and Neiman, P. J.: Extreme snowfall events linked to atmospheric rivers and surface air temperature via satellite measurements, Geophysical Research Letters, 37, 2010.
Handorf, D., Jaiser, R., Dethloff, K., Rinke, A., and Cohen, J.: Impacts of Arctic sea ice and continental snow cover changes on atmospheric winter teleconnections, Geophysical Research Letters, 42, 2367–2377, 2015.
Handorf, D., Dethloff, K., Erxleben, S., Jaiser, R., and Kurgansky, M. V.: Arctic-mid-latitude linkages in a nonlinear quasi-geostrophic
390
atmospheric model, Advances in Meteorology, 2017, 2017.
Herold, N., Behrangi, A., and Alexander, L. V.: Large uncertainties in observed daily precipitation extremes over land, Journal of Geophysical Research: Atmospheres, 122, 668–681, 2017.
Isotta, F. A., Frei, C., Weilguni, V., Perˇcec Tadi´c, M., Lassegues, P., Rudolf, B., Pavan, V., Cacciamani, C., Antolini, G., Ratto, S. M., et al.: The climate of daily precipitation in the Alps: development and analysis of a high-resolution grid dataset from pan-Alpine rain-gauge
395
data, International Journal of Climatology, 34, 1657–1675, 2014.
Kawase, H., Murata, A., Mizuta, R., Sasaki, H., Nosaka, M., Ishii, M., and Takayabu, I.: Enhancement of heavy daily snowfall in central Japan due to global warming as projected by large ensemble of regional climate simulations, Climatic Change, 139, 265–278, 2016. Kim, B.-M., Son, S.-W., Min, S.-K., Jeong, J.-H., Kim, S.-J., Zhang, X., Shim, T., and Yoon, J.-H.: Weakening of the stratospheric polar
vortex by Arctic sea-ice loss, Nature communications, 5, 4646, 2014.
400
Lehmann, J. and Coumou, D.: The influence of mid-latitude storm tracks on hot, cold, dry and wet extremes, Scientific reports, 5, 17 491, 2015.
Li, F., Collins, W. D., Wehner, M. F., Williamson, D. L., Olson, J. G., and Algieri, C.: Impact of horizontal resolution on simulation of precip-itation extremes in an aqua-planet version of Community Atmospheric Model (CAM3), Tellus A: Dynamic Meteorology and Oceanogra-phy, 63, 884–892, 2011.
Lorenz, D. J. and DeWeaver, E. T.: Tropopause height and zonal wind response to global warming in the IPCC scenario integrations, Journal of Geophysical Research: Atmospheres, 112, 2007.
Lute, A., Abatzoglou, J., and Hegewisch, K.: Projected changes in snowfall extremes and interannual variability of snowfall in the western U nited S tates, Water Resources Research, 51, 960–972, 2015.
Lüthi, S., Ban, N., Kotlarski, S., Steger, C. R., Jonas, T., and Schär, C.: Projections of Alpine Snow-Cover in a High-Resolution Climate
410
Simulation, Atmosphere, 10, 463, 2019.
Madonna, E., Li, C., Grams, C. M., and Woollings, T.: The link between eddy-driven jet variability and weather regimes in the North Atlantic-European sector, Quarterly Journal of the Royal Meteorological Society, 143, 2960–2972, 2017.
Marty, C. and Blanchet, J.: Long-term changes in annual maximum snow depth and snowfall in Switzerland based on extreme value statistics, Climatic Change, 111, 705–721, 2012.
415
Michelangeli, P.-A., Vautard, R., and Legras, B.: Weather regimes: Recurrence and quasi stationarity, Journal of the atmospheric sciences, 52, 1237–1256, 1995.
Mori, M., Kosaka, Y., Watanabe, M., Nakamura, H., and Kimoto, M.: A reconciled estimate of the influence of Arctic sea-ice loss on recent Eurasian cooling, Nature Climate Change, 9, 123–129, 2019.
Murray, V. and Ebi, K. L.: IPCC special report on managing the risks of extreme events and disasters to advance climate change adaptation
420
(SREX), 2012.
Nakamura, H., Nakamura, M., and Anderson, J. L.: The role of high-and low-frequency dynamics in blocking formation, Monthly Weather Review, 125, 2074–2093, 1997.
Nitu, R. and Wong, K.: CIMO survey on national summaries of methods and instruments for solid precipitation measurement at automatic weather stations, WMO, 2010.
425
Niziol, T. A., Snyder, W. R., and Waldstreicher, J. S.: Winter weather forecasting throughout the eastern United States. Part IV: Lake effect snow, Weather and Forecasting, 10, 61–77, 1995.
Olsson, T., Perttula, T., Jylhä, K., and Luomaranta, A.: Intense sea-effect snowfall case on the western coast of Finland, Advances in Science and Research, 14, 231, 2017.
Overland, J. E. and Wang, M.: Large-scale atmospheric circulation changes are associated with the recent loss of Arctic sea ice, Tellus A, 62,
430
1–9, 2010.
O’Gorman, P. A.: Contrasting responses of mean and extreme snowfall to climate change, Nature, 512, 416–418, 2014.
Papritz, L. and Spengler, T.: Analysis of the slope of isentropic surfaces and its tendencies over the North Atlantic, Quarterly Journal of the Royal Meteorological Society, 141, 3226–3238, 2015.
Papritz, L. and Spengler, T.: A Lagrangian climatology of wintertime cold air outbreaks in the Irminger and Nordic Seas and their role in
435
shaping air–sea heat fluxes, Journal of Climate, 30, 2717–2737, 2017.
Rasmussen, R., Baker, B., Kochendorfer, J., Meyers, T., Landolt, S., Fischer, A. P., Black, J., Thériault, J. M., Kucera, P., Gochis, D., et al.: How well are we measuring snow: The NOAA/FAA/NCAR winter precipitation test bed, Bulletin of the American Meteorological Society, 93, 811–829, 2012.
Raymond, F., Ullmann, A., Camberlin, P., Oueslati, B., and Drobinski, P.: Atmospheric conditions and weather regimes associated with
440
extreme winter dry spells over the Mediterranean basin, Climate Dynamics, 50, 4437–4453, 2018. Revkin, A.: Skeptics on human climate impact seize on cold spell, The New York Times, 2, 2008. Rushton, S.: On a two-sided sequential t-test, Biometrika, 39, 302–308, 1952.
Santos, J. A., Belo-Pereira, M., Fraga, H., and Pinto, J. G.: Understanding climate change projections for precipitation over western Europe with a weather typing approach, Journal of Geophysical Research: Atmospheres, 121, 1170–1189, 2016.
445
Scherrer, S. C. and Appenzeller, C.: Swiss Alpine snow pack variability: major patterns and links to local climate and large-scale flow, Climate Research, 32, 187–199, 2006.
Scherrer, S. C., Wüthrich, C., Croci-Maspoli, M., Weingartner, R., and Appenzeller, C.: Snow variability in the Swiss Alps 1864–2009, International journal of climatology, 33, 3162–3173, 2013.
Schultz, D. M.: Lake-effect snowstorms in northern Utah and western New York with and without lightning, Weather and forecasting, 14,
450
1023–1031, 1999.
Screen, J. A.: The missing Northern European winter cooling response to Arctic sea ice loss, Nature communications, 8, 14 603, 2017. Screen, J. A., Deser, C., Simmonds, I., and Tomas, R.: Atmospheric impacts of Arctic sea-ice loss, 1979–2009: Separating forced change
from atmospheric internal variability, Climate dynamics, 43, 333–344, 2014.
Screen, J. A., Deser, C., Smith, D. M., Zhang, X., Blackport, R., Kushner, P. J., Oudar, T., McCusker, K. E., and Sun, L.: Consistency and
455
discrepancy in the atmospheric response to Arctic sea-ice loss across climate models, Nature Geoscience, 11, 155–163, 2018. Shepherd, T. G.: Atmospheric circulation as a source of uncertainty in climate change projections, Nature Geoscience, 7, 703–708, 2014. Spreitzhofer, G.: On the characteristics of heavy multiple-day snowfalls in the Eastern Alps, Natural hazards, 21, 35–53, 2000.
Strong, C., Magnusdottir, G., and Stern, H.: Observed feedback between winter sea ice and the North Atlantic Oscillation, Journal of Climate, 22, 6021–6032, 2009.
460
Tabari, H., De Troch, R., Giot, O., Hamdi, R., Termonia, P., Saeed, S., Brisson, E., Van Lipzig, N., and Willems, P.: Local impact analysis of climate change on precipitation extremes: are high-resolution climate models needed for realistic simulations?, Hydrology and Earth System Sciences, 20, 3843–3857, 2016.
Tibaldi, S. and Buzzi, A.: Effects of orography on Mediterranean lee cyclogenesis and its relationship to European blocking, Tellus A: Dynamic Meteorology and Oceanography, 35, 269–286, 1983.
465
Tonks, A.: Storm Emma in pictures: Worst snow storm to hit the UK in 50 years, The Express, 2018.
Vautard, R.: Multiple weather regimes over the North Atlantic: Analysis of precursors and successors, Monthly weather review, 118, 2056– 2081, 1990.
Vavrus, S. J., Wang, F., Martin, J. E., Francis, J. A., Peings, Y., and Cattiaux, J.: Changes in North American atmospheric circulation and extreme weather: Influence of Arctic amplification and Northern Hemisphere snow cover, Journal of Climate, 30, 4317–4333, 2017.
470
Wallace, J. M. and Hobbs, P. V.: Atmospheric science: an introductory survey, vol. 92, Elsevier, 2006.
Woollings, T., Hannachi, A., Hoskins, B., and Turner, A.: A regime view of the North Atlantic Oscillation and its response to anthropogenic forcing, Journal of Climate, 23, 1291–1307, 2010.
Wu, Q. and Zhang, X.: Observed forcing-feedback processes between Northern Hemisphere atmospheric circulation and Arctic sea ice coverage, Journal of Geophysical Research: Atmospheres, 115, 2010.
475
Ye, B., Del Genio, A. D., and Lo, K. K.: CAPE variations in the current climate and in a climate change, Journal of Climate, 11, 1997–2015, 1998.
Yiou, P. and Nogaj, M.: Extreme climatic events and weather regimes over the North Atlantic: When and where?, Geophysical Research Letters, 31, 2004.
Yiou, P., Salameh, T., Drobinski, P., Menut, L., Vautard, R., and Vrac, M.: Ensemble reconstruction of the atmospheric column from surface
480
Figure 1. Yearly total snowfall SF (average 1979-2018) for the ERA5 (a,b) and the E-OBSv20.0e (c,d) data-sets. a,c) NUTS-0 level, b,d) NUTS-2 level.
Figure 2. Maximum yearly snowfall SF (average 1979-2018) for the ERA5 (a,b) and the E-OBSv20.0e (c,d) data-sets. a,c) NUTS-0 level, b,d) NUTS-2 level.
Figure 3. Differences in yearly total snowfall (SF) for two periods (average 1979-1998 subtracted from average 1999-2018) for the ERA5 (a,b), E-OBSv20.0e (c,d) data-sets. a,c) NUTS-0 level, b,d) NUTS-2 level. Significant differences are shown in shaded grey (two-sided T-test, 5% confidence level) .
Figure 4. Differences in maximum yearly snowfall (SF) for two periods (average 1979-1998 subtracted from average 1999-2018) for the ERA5 (a,b), E-OBSv20.0e (c,d) data-sets. a,c) NUTS-0 level, b,d) NUTS-2 level. Significant differences are shown in shaded grey (two-sided T-test, 5% confidence level) .
Figure 5. a,b) Symmetric percentage error ς on average snowfall c,d) Correlation coefficient R2
for the SF daily snowfall time-series for ERA5 and E-OBSv20.0e. a,c) NUTS-2 level, b,d) NUTS-0 level
Figure 6. a) Boxplots of the maxima yearly snowfall (SF) for two periods 1979-1998 (red) and 1999-2018 (blue). b) Seasonal analysis for maximum yearly snowfall SF. The polar plots show average maxima yearly snowfall for the two periods (different colors). Each symbol corresponds to a different country. The angle corresponds to a date of the year in counterclockwise sense. Albania (AL); Montenegro (ME), Bosnia (BA). Boxplot of 2-meters temperatures t2m (c) and CAPE (d) observed during extreme snowfall events. For boxplots, on each box, the central mark indicates the median, and the bottom and top edges of the box indicate the 25th and 75th percentiles, respectively. The whiskers extend to the most extreme data points and the outliers are plotted individually using the ’+’ symbol.
Figure 7. Average of convective available potential energy (CAPE) fields ( J Kg−1) during days of yearly maximum snowfall for the periods 1979-1998 (a,d,g) and 1999-2018 (b,e,h). Panels c,f,i) show the differences between the second and the first periods ∆CAPE. a,b,c) Albania (AL); d,e,f) Montenegro (ME), g,h,i) Bosnia (BA). Green circles show the location of the most northwestern point of each country. Shaded areas represent grid points where at least 2/3 of the anomalies have the same sign.
Figure 8. Average of 2-meters temperature fields (◦C) during days of yearly maximum snowfall for the periods 1979-1998 (a,d,g) and 1999-2018 (b,e,h). Panels c,f,i) show the differences between the second and the first periods ∆t2m. a,b,c) Albania (AL); d,e,f) Montenegro (ME), g,h,i) Bosnia (BA). Green circles show the location of the most northwestern point of each country. Shaded areas represent grid points where at least 2/3 of the anomalies have the same sign.
Figure 9. Average of sea-level pressure (msl) fields (hPa) during days of yearly maximum snowfall for the periods 1979-1998 (a,d,g) and 1999-2018 (b,e,h). Panels c,f,i) show the differences between the second and the first periods ∆msl. a,b,c) Albania (AL); d,e,f) Montenegro (ME), g,h,i) Bosnia (BA). Green circles show the location of the most northwestern point of each country. Shaded areas represent grid points where at least 2/3 of the anomalies have the same sign.
Figure 10. Histograms of weather regimes during the days of maximum snowfalls. N/A: non attributable, NAO+: North Atlantic Oscillation positive phase, BLO: blocking, AR: Atlantic Ridge, NAO-: North Atlantic Oscillation negative phase, a) Albania (AL); b) Montenegro (ME), c) Bosnia (BA). Red bars correspond to 1979-1998 and blue ones to 1999-2018.
Figure 11. Number of analogs per year of the average sea-level pressure fields during days of yearly maximum snowfall for the periods 1979-1998 and 1999-2018. a) Albania (AL); b) Montenegro (ME), c) Bosnia (BA). Red corresponds to 1979-1998 and blue to 1999-2018.