HAL Id: halshs-03000365
https://halshs.archives-ouvertes.fr/halshs-03000365
Preprint submitted on 11 Nov 2020
HAL is a multi-disciplinary open access
archive for the deposit and dissemination of
sci-entific research documents, whether they are
pub-lished or not. The documents may come from
teaching and research institutions in France or
abroad, or from public or private research centers.
L’archive ouverte pluridisciplinaire HAL, est
destinée au dépôt et à la diffusion de documents
scientifiques de niveau recherche, publiés ou non,
émanant des établissements d’enseignement et de
recherche français ou étrangers, des laboratoires
publics ou privés.
The Cushioning Effect of Immigrant Mobility: Evidence
from the Great Recession in Spain
Cem Özgüzel
To cite this version:
Cem Özgüzel. The Cushioning Effect of Immigrant Mobility: Evidence from the Great Recession in
Spain. 2020. �halshs-03000365�
WORKING PAPER N° 2020 – 70
The Cushioning Effect of Immigrant Mobility:
Evidence from the Great Recession in Spain
Cem Özgüzel
JEL Codes:
Keywords:
The Cushioning Effect of Immigrant Mobility:
Evidence from the Great Recession in Spain
∗
Cem Özgüzel
†OECD
Paris School of Economics Institut de Migrations
Latest Update: November 10, 2020
Keywords: immigrant mobility, wages, employment, local labor market JEL Classification Numbers: F22, J31, J61, R23
∗I am indebted to Hillel Rapoport and Ariell Reshef for their guidance and encouragement. I would like to thank Yonatan
Berman, Simone Bertoli, Paul Brandily-Snyers, Sébastien Bock, Pierre-Philippe Combes, Federico Curci, Anthony Edo, Luis Estevez, Jesús Fernández-Huertas Moraga, François Fontaine, Cristina Lafuente, Luigi Minale, Morgan Raux, Angelo Secchi, Jan Stuhler, Gregory Verdugo, seminar participants at 60th ERSA congress, EALE SOLE AASLE World Confrence 2020, 9th CEPII - OECD migration conference, Paris School of Economics, University of Paris 1, University of Carlos III, University of Aix-Marseille, IAB (Nuremberg) and the Bank of Spain for useful feedback. I would like to thank Spain’s Dirección General de Ordenación de la Seguridad Social for kindly providing the data. I declare to have no relevant or material financial interests that relate to the research described in this paper. The views expressed herein are those of the author and do not necessarily reflect the views of the OECD. All errors are mine.
Abstract
This paper provides the first direct evidence on how the geographical mobility of immigrants cushions natives during a labor demand shock. Spain was one of the hardest-hit economies during the Great Recession. Faced with a drop in the local labor demand, immigrant workers moved within Spain or left the country, generating significant decreases in local labor supply. Focusing on this episode, I use microdata from municipal registers and longitudinal Spanish administrative data to study the effects of outflow of the immigrant population from provinces on the wages and employment of the natives. I build a shift-share instrument based on the past settlements of the immigrant population across Spain to instrument outflows and argue for a causal relationship. I find that outflow of immigrants slowed down the decline in employment and wage of natives, especially of those with higher substitutability with immigrants. Moreover, I find that increased transitions from unemployment and inactivity to employment drive the positive employment effects, while wage effects are limited to those who were already employed. These findings reveal that the higher geographical mobility of immigrants cushions the natives during a demand shock.
1
Introduction
Despite an extensive literature on the effects of the arrival of immigrants on the labor market outcomes
of the native population, little is known on the impact of their departure.1 The absence of literature
is surprising as mobility of the immigrant population can be an important channel for equilibrating labor markets (Cadena and Kovak 2016; Basso et al. 2019; Jauer et al. 2019). Due to their higher responsiveness to labor market differentials, immigrants react to the changes in labor market conditions through mobility much more than natives (Borjas, 2001; Schündeln, 2014). While natives in distressed local markets stay in the area, immigrants relocate to other markets and dissipate the shock spatially (Monras, 2018). Through their higher geographical mobility, immigrants can absorb part of the shock and help the local labor markets recover faster.
This paper investigates the effects of outflow of the immigrant population from a local labor market on natives’ labor market outcomes during an economic crisis. Specifically, I study the changes in employment and wage outcomes of natives in Spanish provinces as a result of a reduction of labor supply due to
immigrant mobility. Spain was one of the hardest-hit economies during the Great Recession. The
immigrant population in the country responded to the decreased local labor demand by moving internally but also leaving the country. As a consequence of this mobility, the immigrant labor supply reduced across all provinces of Spain.
I use this context to examine the direct impact of immigrant outflow on the local labor markets over
the 2009-2014 period.2 I start by analyzing the changes in employment and wage outcomes of natives
located in each province. Specifically, I regress the annual growth in employment and wages of natives in a province on net outflow rates normalized by the initial population. To make causal claims about the estimates, I use a modified version of the standard shift-share instrument (Card, 2001). I analyze short-term effects on employment and wages for specific groups of workers (e.g., young or unskilled natives) but also types of employment adjustments in response to outflow. For example, although native employment adjustments can be through higher inflows from non-employment into employment, it can also result from fewer employed workers leaving the labor force. Furthermore, the adjustment can also be through geographic movements across local labor markets, a mechanism found to be essential in explaining the long-run effects of adverse demand shocks in the United States (see Blanchard and Katz, 1992). I provide evidence on the magnitude of each type of response and show how their relative importance varies across worker groups.
To guide my empirical investigation, I start with a general equilibrium model that predicts how 1See for instance Altonji and Card (1991); Card (2001); Angrist and Kugler (2003); Glitz (2012); Ottaviano and Peri
(2012); Dustmann et al. (2017).
2The period of analysis starts in 2009, the first year of economic crisis with net population outflows from Spain and
ends in 2014, the last year where the Spanish economy had a negative growth. While immigrant population continued to decrease until 2016, I omit the recovery period in order to alleviate concerns about my results being driven by the positive growth observed in these years. I provide results including the recovery period for robustness.
a decrease in the local labor supply due to immigrants’ outflow affects wages and employment of the native workers located in the labor market. The departure of immigrants reduces the labor supply in the local labor market which improves employment and wages of natives. These benefits are stronger for natives who have higher substitutability with the departing population. For the groups with higher wage rigidities (e.g., older workers, workers with indefinite contracts), the adjustment takes place at the employment margin.
In my analysis, I use the Spanish Social Security panel, which allows me to track natives over time and across firms, sectors, and regions. I combine this data with individual-level municipal registers that cover 100% of the population to precisely count the number of immigrants residing in each province annually. I measure the intensity of departures across Spanish provinces by the annual decline in the immigrant working-age male population during this period, relative to the entire working-age male population in
the previous year.3
I find a positive and causal effect of the outflow of the immigrant workers on the wage and employment growth of natives located in the area. During the 2009-2014 period, a 1% increase in the annual outflow rate of the immigrant population increases the local native wages and employment by about 2% and 2.4%, respectively. These results are robust to pre-trends, use of different measures of outflows, alternative weights and instruments, the inclusion of time-varying controls which capture the changes in the local demand, the structure of the local economic activity, and composition of the workforce. Given the recession context and the overall decrease in the employment and wages during the period, these effects suggest that immigrant outflow dampened the negative effects due to the demand shock by slowing employment and wage losses in the local labor market.
Regarding differential effects by skill groups, the outflow leads to an employment increase for both unskilled and skilled natives. Breaking employment responses further out by age group and gender, my results reveal that groups that have the highest substitutability (e.g., natives below 30) or high elasticity (e.g., natives above 50) benefit the most in terms of employment, which is in line with the standard migration model.
My decomposition of the overall native employment response into different margins of adjustments sheds light to the mechanism. First, the departure of the immigrant population increases the native
population in the area.4 I find that departure of every ten immigrant increases the native population
by three. Furthermore, I study the arrival and departure rates to understand the source of the increase in the native population and find that the changes are driven by decreased outflows of natives from regions with stronger immigrant outflows. This finding is in line with recent literature which finds that 3Naturalisation rates are high in Spain, especially for immigrants originating from Latin American countries. For this
reason, throughout the paper I use the terms immigrant and foreign-born interchangeably to refer to individuals who were born outside of Spain, regardless of their nationality.
4The question of whether an immigration-induced labor supply shock leads to relocation of the natives remain
population inflows respond more than outflows to economic shocks (Monras, 2018) or increases in the labor supply due to immigration (Dustmann et al., 2017).
Second, I show that outflow of the immigrant population increases the recruitment of natives who were not employed previously, while those who were already employed were not less likely to leave employment. This observation indicates that departure of the immigrant population benefits “outsiders” (and not “insiders”) at the employment margin. This finding is in line with Dustmann et al. (2017), who find that an increase in the labor supply due to the arrival of immigrant workers reduces the employment of “outsiders”, while “insiders” are protected by labor market institutions. Put together, these findings suggest that employment adjustments to positive (negative) labor shocks benefit (hurt) the outsiders in rigid labor markets. On the other hand, I find that workers who were already in the labor market (“insiders”) are the only ones who benefit from wage increases.
In the final section of the paper, I extend the analysis beyond the short-run effects and explore the dynamics of adjustment over the medium-term. I find that the positive effects of outflows on local wages persist until the fourth year and disappear afterwards while employment effects remain positive and significant throughout the period. This “recovery” is clearly faster than what is observed following an immigration episode, where the negative effects due to immigration disappear after 5 years as in Monras (2019) or 14-20 years in Blanchard and Katz (1992); Jaeger et al. (2018); Edo (2019). Furthermore, exploiting the panel dimension of my data, I follow the outcomes of workers based on their initial location. Once the worker composition is fixed, I find positive wage effects which remain significant even beyond 4-years. This result corroborates earlier findings and suggest that changes in the worker composition, due to possible negative selection into employment and native inflows to provinces with higher outflows, attenuate overall wage effects.
My findings have implications for multiple strands of literature. First, they relate to the literature showing that mobility of (immigrant) workers can be a mechanism for equalizing differences across labor markets (Bartik, 1991; Blanchard and Katz, 1992). Due to their higher responsiveness to spatial differences in economic oppurtunities compared to natives, immigrants have higher geographical mobility
which “greases the wheels” of the labor markets (Borjas, 2001; Cadena, 2010; Basso and Peri, 2020).5 My
paper is specifically related to the recent literature focusing on immigrant mobility and its cushioning effects for the natives during a demand shock. In a seminal work on the Great Recession in the US, Cadena and Kovak (2016) shows that the mobility of Mexican workers reduced the incidence of local demand shocks on natives. In a similar study, Basso et al. (2019) also finds that the immigrant workers’ mobility in the Euro Area is strongly cyclical and it reduces the variation of overall employment rates over the business cycle. I advance this literature by using individual-level administrative data to provide 5Borjas (2001) argues that the newly arriving immigrants are much more likely to be clustered in the states that offer
the highest wages for the types of skills that they have to offer. In a recent paper Cadena and Kovak (2016) show that the effect is not due to new arrivals. Even immigrants who have arrived earlier are willing to move, making them instrumental for equilibrating labor market differences even after the years.
the first estimates on the direct impact on wages and employment margins controlling for selection, while accounting for other adjustment margins that it may entail, making it possible to provide a more comprehensive picture of the total effects. I further contribute to the literature by presenting a general equilibrium model that predicts how a decrease in the labor supply due to immigrant mobility affects wages and employment of native workers in the local labor market.
My paper is closely related to a second literature which focuses on the labor market impact of outflow-induced supply shocks. Despite the extensive literature studying the effects of immigration, evidence on the effects of outflow is scant. Focusing on the emigration of the Mexicans to the US between 1970 and 2000, Borjas and Aydemir (2007) and Mishra (2007) presented the first econometric results on the effect of emigration on the national wages. Similarly, Elsner (2013) and Dustmann et al. (2015) study the effect of the emigration on the wages of the staying natives in Lithuania and Poland, respectively. My paper differs from these for two reasons. First, I examine the effects of the departure of the immigrant population, on the staying natives in the host country. Second, apart from Dustmann et al. (2015), all of the mentioned studies focus on the wage effects following the skill-cell approach of Borjas (2003). I follow a pure spatial approach and exploit the variations in the total outflows to study the effects on the
local labor markets in the short and medium-term.6
Third, I contribute to the literature studying the natives’ residential choices, or the so called native displacement, following immigration. The literature provides estimates for the displacement of natives due to arrival of immigrants (Borjas, 2003; Peri and Sparber, 2011; Clemens and Hunt, 2017). I com-plement this literature by providing the first evidence on how the departure of the immigrants generates the exact opposite effect found in the immigration literature by attracting natives into the area.
The remainder of the paper is organized as follows. The next section provides a theoretical model that allows understanding the impact of a decrease in labor supply due to outflow of immigrants on local labor markets. Section 3 gives some background on the economic crisis in Spain and differences in mobility patterns between immigrant and native population during this period. Section 4 describes the data and presents some descriptive statistics. Section 5 presents the empirical strategy and addresses identification issues. Section 6 provides the main results, and Sections 7-8 present the robustness tests and heterogeneity analysis, respectively. Section 9 discusses the underlying adjustment mechanisms and Section 10 provides a sense of the estimated magnitudes. Section 11 discusses the dynamic adjustment effects over time. Section 12 concludes.
6Very recently the immigration literature has turned to the labor market effects of immigration restrictions. Clemens
et al. (2018) for instance study the effects of the exclusion of Bracero workers in the US in 1964, on the wages and employment of natives in the agricultural sector. They find that the reduction in the entry of seasonal Mexican workers did not increase the wages and the employment of natives in the industry, as the reduction in the labor supply was compensated by an increased in technology adoption in the sector. Similarly, Yasenov et al., 2019 study the forced repatriation of Mexicans in the US between 1930-1940, and find non-significan empmloyment effects annd wage downgrading, driven by selective in-and out-migration of natives.
2
An Equilibrium Model with Heterogeneous Labor Supply,
De-mand Shock and Wage Rigidities
In order to motivate the empirical specifications and help the interpretation of my estimated parameters, I commence by setting out a theoretical framework building on Docquier et al. (2014) and Dustmann et al. (2017). I construct a simple aggregate model of an economy where the workers are differentiated by their place of birth (native and immigrant) as well as their education (skill) levels. I also allow exogenous variations in A which captures the changes in the local demand. This structure allows me to examine the wage and employment effects due to changes in the labor supply driven by the outflow of the immigrant population.
The model aims at providing a simple framework, where the labor is the only production input, and output is an interaction of this input with A, which is both TFP and the unit price of the output. It is assumed that physical capital is nationally mobile (its supply is perfectly elastic), that each single region is too small relative to the national labor market and returns to physical capital are equalized across locations.
I start out with a fully competitive labor market as a benchmark, and allow for wage rigidities in a second step. In a second step, I allow the labor supply responses of natives, or the degree of wage rigidity, to vary across skill or demographic groups.
2.1
Set-up
2.1.1 Production Function
The output Y (homogeneous and perfectly tradable) in a specific area is the product of labor L and total factor productivity A.
Y = AL (1)
Following the literature, I assume that labor L is a nested CES function of skilled (S ) and unskilled (U )
labor Lg where g = U, S.
L =hθULβU + θSLβS
iβ1
(2)
where θU and θS are the productivity levels of unskilled (less than tertiary education) and skilled workers
(tertiary education or above). The elasticity of substitution between the two skill groups equals σ = 1−β1 ,
with β ≤ 1.
This representation implies two types of simplifications. First, I assume that the relevant split in terms of production abilities is between college and non-college-educated workers. This is consistent with the previous literature which finds high substitutability between workers with no schooling and
high school degree, but small substitutability between them and workers with college education (Card, 2009; Ottaviano and Peri, 2012). Second, for simplicity I omit further classification into age groups, considered as imperfectly substitutable skills (Borjas, 2003; Ottaviano and Peri, 2012; Docquier et al., 2014).
I distinguish between natives and immigrants within each skill-specific labor aggregate, LN
g and LSg.
Similar to Dustmann et al. (2017), I assume that within each skill group g, natives (N ) and immigrant
(M ) are perfect substitutes in production, which gives7:
Lg= LNg + L
M
g (3)
2.1.2 Labor demand for natives
Each region is a single labor market. Assuming that firms are pricetakers in the labor and product market, firms choose labor such that marginal costs equal the marginal products of each type of worker.
I derive the marginal productivity for workers of both skills (wS and wU) by substituting Equation 2
into Equation 1 and taking the derivative with respect to the total quantity of labor LS and LU. This
yields the labor demand for each type of worker:
wg = A(θg)Lβ−1g L
1−β
In Appendix A.1, I take the logarithm of the demand functions for each type and derive the firm’s
change in the demand of native workers from skill group g, dlogLN
g , due to overall immigration-induced
change in the labor supply (dlogLM
g ) and the demand (dlogA)8and obtain the following:
dlogLNg = 1 γdlogwg− (1 − β) γ (Sg0)[dlogL N g0θNg0+dlogLMg0θgM0]− 1 γdlogA+[(1−β)(Sg−1)]( θM g γ )dlogL M g (4)
where g0 denotes the other skill group, γ = [(1−β)(S1
g0−1)]θNg is the (negative) slope of the aggregate
labor demand curve, Sg denotes the contribution of labor type g to the total labor aggregate and θgN
7In my theoretical model, I assume perfect substitution between natives and immigrants within the same skill group,
similar to Docquier et al. (2014) or Dustmann et al. (2017). Although elasticity of substitution is almost perfect within refined cells (see Ottaviano and Peri, 2011) it still remains a strong assumption. For this reason, in the empirical section I estimate wage and employment responses for different skill groups to the overall decrease in labor supply due to immigrants’ mobility. This means that in my estimation procedure, I do not allocate immigrant workers to skill groups based on their observed skills (Dustmann et al., 2013). Other models have emphasized the role of complementarity within education groups as well as upgrading and specializaiton of native workers in response to immigrants and have found null or positive wage effets (Card, 2009; Peri, 2012; Ottaviano and Peri, 2012). The parameter I estimate will give the aggregate of both complementarity and substitution effects. Complementarity and substitutability (and also the elasticities) between natives and immigrants depend on the period of analysis. For instance, in the short-term, one would expect the substitutability to be stronger while the complementarity is more likely to play out in the medium or long-term.
8Demand for native workers depends on total labor demand and labor supply of the immigrant workers. I include
exogenous variation of A in order to capture the changes in the labor demand for native workers that is due to shifts in total labor demand. Thus, the changes in employment of natives is due to both changes in the total demand and the labor supply of immigrant migration.
and θMg denote the share of workers of skill group g (in head counts) among natives and immigrant (i.e. θN g = LNg Lg and θ M g = LMg Lg ).
Suppose that g indexes unskilled labor and g0 skilled labor. Equation 4 demonstrates that in the
absence of any wage response to immigration (i.e. dlogwg
dlogLM
g
= 0), unskilled native employment declines by
the rate (1 − β)(Sg− 1)(
θM
g
γ ). The equation also shows that a decline in the wage of unskilled labor in
response to immigration (i.e.,dlogwg
dlogLM
g < 0 ) will dampen the employment response of the unskilled, as the
slope of the demand curve γ is negative. An increase in the labor demand for other skill groups, would
increase the demand for unskilled native employment. (i.e., dlogL
N g dlogLM g0 > 0,dlogL N g dlogLN g0 > 0). Finally, a positive
demand shock will also increase the labor demand for natives (i.e., dlogL
N g
dlogA > 0).
2.1.3 Labor supply
Labor supply of natives and immigrants constitute the total supply. Following the literature9, I make
the simplification that all working-age immigrants supply a constant amount of labor (φM > 0) so that
total employment of immigrants is given by LM
g = φMMg(Aα), where Mg denotes the total number of
working-age immigrant population.10 The size of the immigrant population is function of A, with an
elasticity 0 < α ≤ 1.11
Using Ng to denote the (fixed) number of natives who could potentially supply labor to the local
labor market, the local labor supply function for skill group g is:
Lg= LNg + LMg = Ngfg(wg, wg0) + LMg (5)
Local labor supply of natives depends on skill-specific wages in the market under consideration (wg)
and other local labor markets (w0g). The local labor market elasticity for natives, which I allow to vary
by skill group, is then given by ηg =
wg
∂wg
∂(Ngfg(wg,w0g))
(Ngfg(wg,w0g)
. Note that ηg is the local labor market elasticity
for natives, which varies by skill group. It captures various potential adjustment mechanisms such as moving into and out of non-employment, internal migration of workers between areas, or entries into and exits from the labor force. These adjustment margins may have different importance for different types of workers and thus help explain why some groups respond more elastically than others.
From the labor supply function 5, it follows that (see Appendix A.2 for details):
dlog(LNg) = ηgdlogwg (6)
9See for instance, Borjas (2003); Docquier et al. (2014); Dustmann et al. (2017).
10The goal of this paper is to analyze the effects of a change in immigrant supply on natives’ labor market outcomes. This
definition implies that a certain percentage change in immigrant population translates into the same percentage change in immigrant employment. See Docquier et al. (2014) or Dustmann et al. (2017) for a similar simplification.
2.2
Equilibrium Effect of Migration and Demand
2.2.1 Competitive Equilibrium with Flexible Wage
In a competitive equilibrium, quantities supplied must equal quantities demanded. The intersection of the demand and supply curve, determine the skill-specific wages and employment in the local labor market.
The equilibrium wage and employment responses are determined by the two skill-specific labor de-mand curves:
dlogwS = (β − 1)dlogLS+ (1 − β)dlogL + dlogA (7)
dlogwU = (β − 1)dlogLU+ (1 − β)dlogL + dlogA (8)
and two skill-specific supply curves:
dlogLNS = ηSdlogwS (9)
dlogLNU = ηUdlogwU (10)
By substituting Equation 9 and 10 into Equation 7 and 8, and rearranging them, I derive the equi-librium employment response as (see Appendix A.3):
dlogLNg ∗ = − (1 − β)Sg 0θMg ηg 1 + (1 − β)Sg0ηgθNg + (1 − β)Sgηg0θN g0 dlogLMg + (1 − β)Sg 0θM g0ηg0ηg 1 + (1 − β)Sg0ηgθNg + (1 − β)Sgηg0θNg0 dlogLMg0 + (1 + (1 − β)Sgηg 0θgN0)ηg 1 + (1 − β)Sg0ηgθgN+ (1 − β)Sgηg0θgN0 dlogA (11)
Since β ≤ 1, Sg0 ≥ 0, Sg ≥ 0, the denominator, and the numerators are always positive. Thus, an
increase in the number of immigrants of the skill group g would have a negative impact on the employment of natives of the same skill group (g) due to substitution. An increase in the number of immigrants in
the other skill group (g0) would be positive due to complementarities between the two groups.
dlog(LN ∗ g ) dlog(A) = ∂logLN g ∂logA | {z } (−) +∂logL N g ∂logLM g | {z } (+) ×dlogL M g dlogA | {z } (−) +∂logL N g ∂logLM g0 | {z } (−) ×dlogL M g0 dlogA | {z } (−) A decrease in A will:
• decrease the demand for native labor dlogLN
g (i.e.,
∂logLN
g
∂logA < 0)
• decrease the labor supply of immigrants for the skill group g (i.e., dlogLMg
dlogA < 0), which increases
the demand for native labor of the same skill group (i.e., ∂logL
N g
∂logLM
g > 0).
• decrease the labor supply of immigrants for the skill group g0 (i.e., ∂logLNg
∂logA < 0), which decreases
the demand for native labor of the skill group g0 (i.e., ∂logL
N g
∂logLN
g < 0)
The final effect will be the sum of all these forces. A decrease in A will decrease the labor demand for natives, yet it will be dampened by the positive effect due to decreased competition from the immigrant population of the same skill group. In reverse, in case of a positive demand shock (i.e. A is positive), an increase in the labor demand for natives will be slowed by the increase in the competition due to the increased presence of immigrants from the same skill group.
2.2.2 Wage Rigidities
The equilibrium above assumes the flexibility of wages. However, in the context of Spain, wages are rigid and thus have low cyclicality especially in the short-run (Bentolila et al., 2012b; De la Roca, 2014). Moreover, the degree of rigidity may vary across sectors, skills, tenure, type of job contract or occupation (Card and Kramarz, 1996; De la Roca, 2014; Font et al., 2015). These labor market rigidities, while protecting some native workers from negative demand shock or immigrant competition, can also increase the employment response (Angrist and Kugler, 2003; Dustmann et al., 2017).
If the decline of wages is constrained due to labor market rigidities, then the wages cannot fall by as much as the equilibrium wage response given by the labor supply (Equation 5) or the equilibrium (Equation 11). This would create a demand-side constraint in the market, and in consequence generate an oversupply of (native) workers who would like to work for the current wage rate, but cannot find a job. In this case, the wages would be determined exogenously depending on the wage rigidity for the group, and the employment response of natives would be determined by the labor demand function (Equation 4).
The differences in labor supply responses and the degree of wage rigidities can generate "perverse" effects where the group experiencing the largest shock may not be the one suffering the largest changes
in wages or employment.12
3
Spanish Context
3.1
Immigrant Population in Spain
Between 1998 and 2008, Spain experienced one of the most significant immigration episodes in recent
history among the OECD countries.13 Until 2009, Spain received an average of almost half a million
immigrants annually, becoming the second-largest recipient of immigrants in absolute terms in the OECD after the United States (Arango, 2013). The immigrant share in the total population increased from 1.6 percent in 1998 to 12.1 percent in 2009, reaching to 5.6 million (Appendix Figure C1). Due to high naturalisation rates in Spain this figure even higher. For instance in 2009, there were 6.4 million immigrant people, which makes the share of immigrant in the population 13.7 percent.
A substantial portion of immigration to Spain consisted of migration flows from a diverse set of countries driven by labor market motives due to the strong economic growth lasting more than a decade (de la Rica et al., 2014; Moral-benito, 2018). Beyond the economic pull factors, cultural and linguistic factors also played a role in shaping Spain’s immigration experience by attracting many immigrants from Latin American countries (Adserà and Pytliková, 2015). In addition to the cultural proximity, the special arrangements that allowed citizens of the former colonies to enter Spain without a visa increased immigration from Latin America (Bertoli and Fernández-Huertas Moraga, 2013, 2015).
Spain was one of the hardest-hit economies during the Great Recession. It was hit by two shocks: the end of the speculative bubble of the construction sector in Autumn 2007 and the global financial shock in September 2008. The negative shock in the construction sector reversed the positive trend in the employment observed until the crisis. The global financial shock triggered a rapid increase in the unemployment rate. Appendix Section B provides further details on the evolution of the crisis and its impact on the economy.
During the crisis, immigrants, especially male immigrants, suffered higher unemployment rates than native workers (See Appendix Figure E1). There are many reasons why immigrants in Spain were hit harder. First, immigrants were concentrated in sectors which are more sensitive to the business cycles such as construction, wholesale and hotels and restaurants where up to 50 percent of the immigrants were employed prior to the crisis. Secondly, immigrants were more likely to hold temporary contracts
prior to the crisis which makes them more vulnerable to firing (Fernandez and Ortega, 2008).14
13This rapid increase in the immigrant population generated academic interest in the labor market impact of immigration.
See for instance Dorantes and De La Rica (2005); Carrasco et al. (2008); Gonzalez and Ortega (2011); Amuedo-Dorantes and de la Rica (2011) for labor market impact of immigration. See also de la Rica et al. (2014) for a more comprehensive review of the literature on the immigration wave experienced by Spain over the last decade on other dimensions (i.e., housing, immigrant assimilation, inflation rate etc.). See Appendix Section C.1 for further details on immigration in Spain before and during the Crisis.
14The fact that the changes in the business cycles affect immigrants differently has been explored in other country
contexts. Dustmann et al. (2010) find larger unemployment responses to economic shocks for immigrants relative to natives within skill groups in the UK and Germany, especially for non-OECD immigrants. Focusing on the Great Recession in the US, Orrenius and Zavodny (2010) also conclude that immigrants, especially the low-skilled, have higher sensitivity to the business cycle than natives;
The crisis caused a decrease in the immigrant population, driven by sudden drop in immigrant inflows and increase in return migration. The significant and immediate drop in labor related entries was due to two reasons. First, unlike most of the other European countries where drop was less pronounced and gradual, migration flows in Spain had always depended highly to economic cycles (OECD, 2009).
Due to the contraction in the economy, Spain’s appeal as a destination decreased.15 Second, Spanish
government took action to reduce the labor related entries (see Appendix Section D for more details). In parallel, departures also started increasing due to drop in the economic activity. Finally, Spanish
government encouraged the departure of immigrants (see Appendix D for more details).16
[Figure 1 about here.]
Between 2009-2014, working-age male immigrant population saw a net decrease of 170 000. Figure 1 shows the annual net outflow of the working-age male immigrant population as a share of the total working age population (Spanish and immigrant) the year before. It can be seen that the departure of
the immigrant created a labor supply shock between 0.1-1 percent annually.17 Between this period, the
total net outflow of working-age immigrant male population caused a reduction of 1.1 percent in the total working-age male population and 6 percent in the working-age immigrant male population across Spain.
3.2
Immigrant and Native Mobility During Great Recession
Immigrants are more mobile than native-born workers across regions, industries and occupations (Bor-jas, 2001; Orrenius and Zavodny, 2007). Recent literature shows that native–born population are less sensitive to labor demand shocks and respond much less by geographic mobility compared to immigrant counterparts (Schündeln, 2014; Cadena and Kovak, 2016; Bartik, 2017; Basso et al., 2019). These differ-ences can be due to their observable demographic characteristics (i.e., age, education, family structure, home ownership), but also unobservable characteristics (i.e., self-selected group of people with high levels of labor force attachment and a greater willingness to move long distances to encounter more favorable labor market conditions). The difference in the responsiveness between natives and the immigrant is especially high within the lower-skilled (Schündeln, 2014; Cadena and Kovak, 2016; Bartik, 2017; Basso et al., 2019).
I start by establishing whether the difference in mobility between natives and immigrants exists in 15For instance, the number of foreigners residing abroad who are offered jobs in Spain — a process known as contratación
en origen declined from 45 995 in 2006 to 4 429 in 2009.
16A reasonable question is whether the economic crisis impacted flows differently for those who are from EU countries,
thus benefiting from free mobility, vs. those who are not. I discuss these issues in Appendix Section C.2 further and show that there are no striking differences between the mobility patterns of the two groups.
17The net decrease was even stronger as share of the immigrant population. During this period 2.8% of the immigrant
population left annually. The net decrease between 2009 and 2014 corresponded to 10.1% reduction in the immigrant male population in 2009. Native male population of working-age only decreased by 3.2% during this period. Immigrant population continued to decrease until 2016. Betwen 2009-2016, working-age male immigrant population saw a net decrease of 250 000, which corresponds to a 9 percent decrease in the working-age male population in 2009.
Spain during the Great Recession. Figure 2 shows scatter plots for working-age native-born and immi-grant men and compare their mobility. Each circle represents a province where the size is proportional to the province population. The x-axis shows the change in log employment, and the y-axis shows the change in log population for the relevant group. Note that the changes in the log population can be due to both internal and international mobility. The figure demonstrates that immigrant workers respond much more strongly to local labor demand shocks than natives. The immigrant population in hard-hit areas move out, while natives remain in the area.
[Figure 2 about here.]
These figures show that native population was less responsive to shocks compared to immigrant pop-ulation. The higher mobility of the immigrant compared to the natives in Spain has also been confirmed by earlier work focusing on the internal migration in Spain (David and Javier, 2009; Hierro and Maza, 2010; Gil-Alonso et al., 2015). More recent work focusing on individual internal moves in a gravity-type setting, show that immigrant moves have much higher elasticity to labor market conditions (Gutiérrez-Portilla et al., 2018; Melguizo and Royuela, 2017). For instance, while in the pre-crisis period both natives’ and immigrants’ moves were partially motivated by amenities (e.g. temparate climate, sunny days), during the crisis these amenities lost their importance for foreigners as the driver of geographical moves (Maza et al., 2019).
In Appendix F, I further explore the issue by decomposing the mobility by the skill group to see if the elasticities differ depending on the skill group. Similar to findings of Cadena and Kovak (2016) for the US, I find that the native population in Spain is much less sensitive to the demand shocks. While high-skilled natives have higher elasticities than low-skilled natives, these elasticities still remain lower
than those estimated for low-skilled immigrants.18
Despite the low share of native outflows compared to the group population, it is important to account for them empirically as they could matter for the re-adjustment of the local labor markets. In Section 7.2, I present results controlling for native mobility.
4
Data and Summary Statistics
This section presents the data used to estimate the effects of net outflow of immigrants from Spanish provinces on natives’ outcomes. After describing the data and selected sample, I provide some descriptive statistics.
18Despite large differences in unemployment rates and economic conditions, labor mobility has been low in Spain especially
compared to the European countries (Mulhern and Watson, 2009; Bell et al., 2015). There are many reasons why natives react less to demand shocks. In the case of Spain, the low mobility is partially explained by the safety net provided by the families (Bentolila and Ichino, 2008), or by the presence of welfare state which decrease the incentive for such moves (Bover and Velilla, 2005;Amuedo-Dorantes et al., 2018). The low mobility response of natives to changes in unemployment is not a new phenomenon in Spain. For similar analysis for earlier periods see Antolin and Bover (1997); Bentolila and Dolado (1991).
4.1
Data
4.1.1 Social Security Data
The labor market data come from Spain’s Continuous Sample of Employment Histories (MCVL or
Muestra Continua de Vidas Laborales in Spanish).19 This is an administrative data set with longitudinal
information obtained by matching social security, income tax, and census records for a 4 percent non-stratified random sample of the population who in a given year have any relationship with Spain’s Social Security. Individuals can either be working as employees or be self-employed, receiving unemployment benefits or pension.
An individual enters the sample if he registers one day of activity with social security, between 2004-2016 and is kept in subsequent editions. Once in the sample, MCVL records any changes in individual’s labor market status or job characteristics (including changes in occupation or contractual conditions within the same firm) since the date of first employment. I combine multiple editions of the MCVL, and use the unique individual identifiers across waves to construct a panel that has the complete labor market history for a random sample of approximately 4% of all individuals who have worked, received benefits or a pension in Spain at any point since 2004. By combining multiple waves, enlarge the sample by including individuals who have an affiliation with the Social Security in one year but not in another. This allows me to maintain the representativeness of the sample throughout the study period. Individuals who stop working remain in the sample while they receive unemployment benefits or a retirement pension, and drop from the sample when their unemployment benefits run out, die or leave the country permanently.
On each date, I know the individual’s labor market status, daily wage20, the occupation and type of
contract, the establishment’s sector of activity at the NACE three-digit level, and the province where the establishment is located. I also obtain individual characteristics such as age, gender, country of birth,
nationality, and educational attainment which come from Padrón or Municipal Register.21 Furthermore,
by exploiting the panel dimension, I construct precise measures of tenure and experience, calculated as the actual number of days the individual has been employed, respectively, in the same establishment and overall.
This rich administrative data set is well suited for my analysis for multiple reasons. First, the
19This dataset is distributed by Directorate General of Planning for the Social Security (Dirección General de Ordenación
de la Seguridad Social ) under the Ministry of Labor, Migrations and Social Security (El Ministerio de Trabajo, Migraciones y Seguridad Social ). This dataset has been widely used in research on labor markets (e.g., Gonzalez and Ortega, 2011; Bonhomme and Hospido, 2017; De la Roca, 2017; De la Roca and Puga, 2017).
20The MCVL contains earnings data coming from the social security records and income tax records. The earnings
data coming from the social security records that go back to 1980. However, the earnings data are either top or bottom coded for about 13% of observations. Income tax records on the other hand provide uncensored gross earnings starting from 2004. Each source of labor income is matched between income tax records and social security records based on both employee and employer (anonymized) identifiers. The Basque Country and Navarre autonomous regions collect income taxes independently from Spain’s national government. As job spells originating from these regions lack uncensored earnings information, I use earnings coming from the social security records after applying necessary wage simulations following de la Roca (2015). I further check the robustness of my results by using uncensored earnings information coming from tax records.
21Since 2009 the Ministry of Education directly reports individuals’ highest educational attainment to the National
large sample size allows me to obtain precise estimates of outflow on wages and employment even for specific subgroups. Second, the data allows me to track individuals across time and space based on their workplace location, which allows me to investigate whether an increased outflow of workers drives the employment effects into other areas or non- or unemployment,. Third, the longitudinally of the data also allows me to measure changes in labor markets for constant cohorts of workers within demographic and skill-groups, avoiding compositional biases that confound cross-sectional analyses. Fourth, in addition to information on education, age, tenure, and other individual characteristics, the data include both the citizenship and country of birth, which allows identification of all immigrant workers who have
naturalized.22
4.1.2 Sample Restrictions
After combining the social security and income tax records, my monthly panel covers job spells in 2005-2016 for individuals aged 18 and over, born since 1962, and employed at any point between January 2005 and December 2016. This initial sample has 777 593 workers and 75 945 441 monthly observations.
First, I exclude spells for workers who are self-employed because labor earnings are not available during such periods. I also exclude Ceuta and Melilla given their special enclave status in continental Africa.
Job spells in agriculture, fishing, mining, and other extractive industries are excluded because these activities are covered by special social security regimes where workers self-report earnings and the number of working days recorded is not reliable (De la Roca and Puga, 2017). Job spells in the public sector, international organizations, and in education and health services are also left out because earnings in these sectors are regulated by the national and regional governments. Apprenticeship contracts and certain rare contract types are also excluded. I drop workers who have not worked at least 30 days in any year and those with missing education data.
I exclude women and immigrants from the sample. I exclude women for three reasons. First, I drop women to provide estimates that can be comparable with other studies on the labor market impact of immigration (De la Roca, 2014; Ortega and Verdugo, 2016; Dustmann et al., 2017; Edo, 2019; De la Roca and Puga, 2017 ). Second, despite the important increase in the female employment in Spain, their participation rate is still low compared to similar countries. For instance, the female labor force particpation rate was 49.1 percent in Spain, compared with 64.5 percent in the EU-27 and 72 percent in the US. The gender gap in employment is also among the highest in the industrialized countries (21 22This is feature is valuable for three reasons: first, Spain permits dual citizenship under limited circumstances. Although
the requirement to have a single nationality is waived for natural citizens of many countries, nationals of some countries are still required to renounce their original citizenship when they become Spanish. Second, Spain this is has high naturalization rates. As shown in Ródenas et al. 2017, in 2014, 24.7 percent of foreigners residing in Spain were Spanish citizens. Those with dual citizenship can be registered either as a immigrantnational as well as Spanish both in the municipal as well as social security records. Third, as pointed in Ródenas et al. 2017, naturalized immigrant have higher probability of emigration back to their home country during the crisis. These factors make the naturalisation an important measurement issue given the research question in this paper.
percent in Spain, 18 percent in the EU-27 and 10 percent in the US) (Farré et al., 2011). Finally, I prefer excluding women as their employment decisions depends not only on the labor market oppurtunities but also on the cost of child-care services and elderly care (Farré et al., 2011; Cortés and Pan, 2018), and on their husbands’ employment especially during an economic crisis (Baslevent and Onaran, 2003). In this sense, substitutability and complementarity relationships between immigrants and native workers might
be different for men and women (Carrasco et al., 2008).23 Although women workers are excluded in the
main results, I present some result in Section 8. I leave-out immigrant workers as I am interested in the outcomes of natives.
Finally, I restrict the sample to workers aged 25 to 54 between 2009-2014 to ensure that individuals
have completed their education and avoid complications related to retirement decisions. 24 I keep only
workers who work full-time and provide results for part-time workers in the Appendix. These restrictions reduce the sample to 193 247 native-born workers with 814 197 yearly observations. This means that on average each native is observed for 4 years. I use this sample to calculate province-year averages and changes.
4.1.3 Mobility Data
Outflows from provinces are measured using microdata from the Municipal Register of Population (Padrón Municipal de Habitantes), which is the official population registry of municipalities. According to the law (Ley de Bases de Régimen), anyone living in a Spanish municipality is obliged to register upon arrival in the country, and to de-register upon departure. Arriving individuals have strong incentives to register as it allows them to enjoy municipal services (such as getting a national ID, drivers permit,
passport, proof of residence) and grants them access to education and health services.25 If not registered,
individuals do not have access to any of these services. All newborn children are immediately registered before discharge, and deceased persons are removed upon death. The data covers close to 100 percent of the population (Fernández-Huertas Moraga et al., 2019).
Immigrants have additional incentives to register, which makes this data particularly important for recording foreigners that are residing in Spain both legally and illegally. Since 2000 (Ley Organica 4/2000 ), regardless of their status, registered immigrants have been entitled to make use of the public health system and education with no risk of detention by the authorities. This incentivize the illegal immigrants to report their presence (Bertoli et al., 2013). Moreover, registration has been used to prove residency in the periodical regularizations (Ley Organica 4/2000). Hundreds of thousands of immigrants 23For example, child-care services provided by immigrant women might have allowed some native women to participate
in the labor force as shown in Farré et al. (2011) or Cortés and Pan (2018).
24I apply these restrictions to avoid problems with potentially endogenous labor market participation in educational
decision for young people and early-retirement decisions for men. See Hunt (2017) and De la Roca and Puga (2017); Ortega and Verdugo (2016) for a similar empirical approach.
25For instance the residents are assigned to schools and hospitals based on the residential proximity measured by their
took advantage of being duly registered in the 2000, 2001 and 2005 amnesties (see Monras et al. (2019) for the impact of the last regularization wave).
Due to this structure, municipal registers provide precise numbers on the immigration and internal moves. However, the numbers are less precise in recording emigration due to few reasons. First, individ-uals register and de-register on the basis of their planned length of stay in the country (for entries) or the planned length of absence from the country (for exits), so some individuals may leave the country without registering if they plan to return shortly. Moreover, some individuals may prefer not to de-register to keep their entitlements associated with residency. Finally, individuals may simply not think about de-registering as, unlike registering, it does not provide any additional benefits.
Since January 2006, the INE corrects this by requiring local authorities to de-register immigrants if they do not confirm their residence within two years. Once a registration is deleted, it is counted in the official data as a departure to an unspecified destination country. Thus, since 2006 data includes all internal departures and return migrations which are registered, but also changes due to non-renewal of
residency within two years.26
I have access to individual micro-data from the official registry, which provides information on indi-vidual’s municipality of residence, nationality, the place of birth (municipality if born in Spain, country of birth otherwise), age and sex. Having these details allow me to calculate precise stocks of the immigrant and native stocks flexibly according to my sampling criteria (i.e., age, sex, country of birth). I use the changes in these stocks to account for variations in the labor supply similarly to the papers that study the impact of changes in labor supply (Cadena and Kovak, 2016; Gonzalez and Ortega, 2013; Ortega and Verdugo, 2016; Lee et al., 2017; Sanchis-Guarner, 2017).
I use population stocks to account for mobility of the immigrant population for two reasons. First, it is considered to be a good measure for the number of immigrants living in the country, especially for both those residing legally and illegally, working in formal or informal sector. Second, as I am interested in changes in supply as a share of the total population at the previous period, it is more precise.
The only limit of this data is that it does not allow to distinguish whether the changes in population stocks are due to international or internal mobility. To verify that changes in the population stocks are not driven by either internal or external moves, I use the Residential Variation Statistics (EVR, or Estadistica de Variaciones Residenciales, in Spanish) provided by the Spanish Statistical Institute (INE), a micro-data which records all individual moves originating or ending in Spain based on the Municipal
Register of Population (Padrón Municipal de Habitantes, in Spanish).27 Using this data, I find that
26This rule only applies to immigrants without an EU nationality or a permanent residence permit. In case of non-renewal
of the residence, the deletions are carried out automatically, exactly two years after the day of registration. This means that Padrón records can suffer from measurement error in terms of exact timing of the departure, and depending on the nationality of the departed individual. I discuss further these issues in Appendix I and show that they do not cause any empirical problem for my results.
27This data has been used in the literature to consider both international and domestic moves. See for instance Bertoli
and Fernández-Huertas Moraga (2013); Gil-Alonso et al. (2015); Melguizo and Royuela (2017); Amuedo-Dorantes et al. (2018)
internal moves between provinces constituted 55 percent of the total moves while moves with an origin
or destination outside of Spain constituted 45 percent of the moves.28
Using the municipal registers, I calculate the total stocks (both immigrant and Spanish29) and the
net change in immigrant population between two periods using male population that is of working-age (16-65). I apply these criteria as these stocks provide more precise measures for those involved in the labor market. As a robustness, I also provide results using female population and all the age groups, which provide similar results with smaller magnitudes as expected. Figure 3 shows the total outflows during the period 2009-2014, as a share of the total population in 2009. It can be seen that the net departures of the immigrant corresponded on average to 3 percent of the working-age population of the
province during the period as a result of both internal and international moves.30 It is also important to
note that the net outflow of the immigrants was observed in all the provinces (apart from Guipuscoa). [Figure 3 about here.]
4.2
Summary Statistics
Table 1 presents the summary statistics. My sample covers 50 provinces, over the 2009-2014 period which leads to 250 province-year observations. The table presents the main variables in the regression. The first two lines of the table present average number of employed male native workers, and average salaries. I use these numbers to compute the annual growth rate in employment which I use as the dependent variable.
[Table 1 about here.]
Table 1 also gives an idea about the annual outflow that each province faced. During the period, Spanish provinces lost annually, on average, 1597 immigrant working-age male. Given that average working-age population in a province is around 316 000, this corresponded to an outflow rate, or a reduction in the labor supply of 0.5 percent annually.
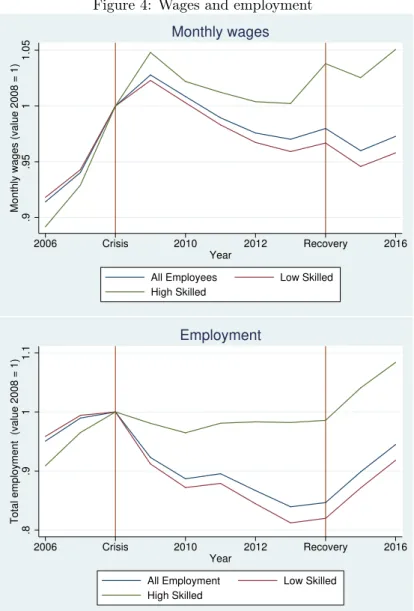
Figure 4 plots the raw data and shows the evolution of the average monthly wages (top panel) and employment (bottom panel) for natives in Spain. Both figures are normalised to 1 in 2008 (the beginning of the Crisis) to make the comparisons simpler. A few things are worth noting. First, the average wages continued increasing in the first year of the crisis, due to rigidities in the labor market and, possibly, due to employmet shedding. Second, starting from 2009, the average wages decreased for both skill groups, while the drop was more significant for the low-skilled workers. Third, while earnings for high-skilled workers recovered to their pre–shock levels by 2014 (the start of the Recovery), the wages for low-skilled
28There are also moves that take place within the province borders which I do not capture in my measure. 29I consider an individual native if the person is born in Spain and has Spanish nationality.
30In terms of immigrant population, these departures are even more striking. Figure H1 presents the same results as
a share of the immigrant population in the province in 2009. The net departures between 2009 and 2014, correspond on average to 16 percent of the immigrant population in 2009.
continued decreasing until 2015. Finally, while both skill groups suffered employment losses, low-skilled workers suffered the largest shock, driving the overall employment losses.
[Figure 4 about here.]
5
Empirical Strategy
In this section, I first explain how my main regression equations relate to the theoritical model presented in Section 2, and then describe my estimation and identification strategy.
5.1
Econometric Equation
I estimate the effect of net outflow of the immigrant population on the changes of labor market outcomes for native workers over the same period. Corresponding to my theoritical setup, I use the following first
differences regression model:31
4lnwg,j,t= βg4f oreignj,t+ αt+ εj (12) 4Lg,j,t= δg4f oreignj,t+ αt+ εj (13) where 4Lg,j,t= LN ative j,t−LN ativej,t−1 LN ative j,t−1 and 4f oreignj,t= 4Nf oreign j,t−1−Nf oreignj,t NN ative j,t−1 +N f oreign j,t−1
4lnwg,j,t is the change in mean of log wages of natives32, in group (i..e, skill, sex, age, contract
type) g, and province j, between two periods, t − 1 and t. 4Lg,j,t is the percentage change in the
native employment in group g, and province j, between two periods, t − 1 and t, 4f oreignj,t is the
net-change in immigrant population between two periods, divided by the province initial population, αt
is the time–fixed effect. Finally εj,t is the random error term. Equations 12 and 13 are written in first
differences to eliminate time-constant area and, when applicable, group fixed effects.
The variable of interest is the normalised net-change in immigrant population in province j divided
by the province initial population.33 The net-change is calculated as the difference between immigrant
population between t and t − 1. Using the normalised net-change instead of (log) net change as the 31For other papers using first differences models on evaluating the impact of immigration, see Gonzalez and Ortega
(2013); Ortega and Verdugo (2016); Dustmann et al. (2017); Sanchis-Guarner (2017)
32Some papers in the literature use changes in the log of mean wages. See Borjas et al. (2012) for a discussion on why
this is an error.
33I compute these rates using only working-age male population, i) for consistency with the outcome variable which
includes only working-age male natives, ii) to better capture the moves driven by labor market conditions. In the following sections, I test the robustness of my results by using measures which are calculated using both female and male population, as well as all age groups.
measure of net outflows eliminates any unobservables that might equally affect both the numerator (for-eign–born outflows) and the denominator (original province population, sum of natives and immigrant). Standardising net-change by initial population stocks also deals with the fact that regions have different population sizes and labor market dynamics (Card, 2001; Peri et al., 2009; Dustmann et al., 2017; Lee et al., 2017). Moreover, scale effects can induce spurious correlation between higher outflows and higher changes in labor market outcomes. This correlation could arise due to the fact that the average and
standard deviation of both variables are likely to be proportional to the population in the province.34
Finally, consistent with the model, I use only the total but not the group-specific outflow of immigrant population. This approach is preferable as it does not require pre-allocation of immigrant to skill groups based on their observable characteristics, thus avoiding the problem of misclassification that arises when such observable characteristics are used to assign immigrants into skill groups in which they do not
compete with natives.35 It thus gives the total wage and employment effects of a decrease in labor
supply due to outflow of the immigrant population as derived in equation 11.
The parameters βg and δg, measure the impact of the total net outflow of immigrant on the percent
change in wages and employment of native workers in skill group g in area j between the two time periods. If wages are fully flexible, these parameters correspond to the expression derived in equations
6 and 11. If wages are partially rigid, the wage response βg is determined exogenously by the degree of
rigidity and employment response δg as given by equation 4. The employment response in equation 13
captures, employment movements across areas in addition to movements from and to non-employment
(in activity or unemployment).36
Finally, I estimate equation 12 and 13 weighting by the number of observations used to compute the dependent variables in each province-skill cell at base period and cluster the errors by province to
account for potential location-specific correlations (Moulton, 1990).37
5.2
Identification
My identification relies on exploiting the variation in the net outflow rate which, after controlling for province and time fixed effects, is uncorrelated with local determinants of labor market demand and 34Measuring changes in immigrants’ labor supply as a share of initial total population is standard in the literature
(Dustmann et al., 2017; Lee et al., 2017). Still, in section 7.4 I test the robustness of my results by using alternative measures. Given that all provinces (except Guipuscoa) experienced net reduction in immigrant population, I measure the outflow rate as the difference in levels between t − 1 and t so that net outflows would have positive values, which makes the interpretation of the coefficients more intuitive.
35Dustmann et al. (2013) show that immigrants often downgrade upon arrival, which Fernandez and Ortega (2008) show
to be the case in the Spanish context as well. Thus assigning immigrants to skill groups based on observed characteristics may lead to serious misclassification. This estimation strategy is similar to Altonji and Card (1991); Dustmann et al. (2013, 2017); Ortega and Verdugo (2016).
36This differs from other studies which use the change in the local employment-to-population ratio such as Altonji and
Card (1991); Boustan et al. (2010).
37Similar papers use weights proportional to the number of observations used for the computation of the LHS (see. for
instance, Ottaviano and Peri (2012); Dustmann et al. (2017); Lee et al. (2017)). Some papers such as Hunt (1992); Clemens and Hunt (2017) use the inverse of the sampling variance as weights. All the results presented in the present paper are robust to the use of both weights.
economic performance between 2009-2014.38 There are two issues regarding the identification. First, the immigrant population located in provinces which are more severely affected by the crisis will be more likely to leave. Second, the distribution of the immigrant across provinces before the crisis may not be random.
5.2.1 Concern 1: Outflows and OLS as Lower Bound Estimates
A first order concern is identifying a source of variation for the outflow rate that is uncorrelated with local determinants of labor market demand and economic performance during the period. There is geographical variation in the intensity of the Great Recession across provinces. Provinces which experienced stronger increase in the unemployment rate aslo saw higher departures (Appendix Figure G1).
This creates a correlation between intensity of the demand shock and the outflow rates.39 As outflow
is higher in provinces that experience stronger negative wage and employment shocks, this association induces a spurious negative correlation between outflow, employment and wage growth that could lead to a negative bias in the OLS estimate. Hence, given the positive effects I estimate, the OLS estimator provides a lower bound for the actual effect of outflow on mean wages and employment (see Dustmann et al. (2015), for a similar argument). In Section 7, I further address this issue by controlling for changes in the local demand.
5.2.2 Concern 2: Non-random Distribution of Immigrant Population and Endogenous
Location of Native
The departure of immigrants is only possible if there is an immigrant population in the province in the first place. This initial distribution of the immigrants across provinces, however, may not be random. The use of first-differences takes care of province characteristics that are fixed over time which allows
me to make progress towards the identificitation of βg and δg.40 Still, the unbiased identification of
these parameters requires the outflow rate to be uncorrelated with the time-varying component of the error term. There is no prior on the direction of the bias as I am looking at the impact of outflows during a demand shock which is less straightforward than immigration in good times as in most of the immigration literature. For instance, if immigrants located in areas with faster wage and employment growth (conditional on all the time-varying and time-invariant controls) were more likely to leave, the estimated parameters would be upward biased. If, on the contrary, immigrants located in areas with slow growth rates were more likely to leave, then the parameters would be downward biased.
38Although not presented, I test the endogeneity of net outflow rate by using an augmented regression tests
(Durbin-Wu-Hausman test), as suggested by Davidson and MacKinnon (1995). The results show that OLS is not consistent and use of instruments is necessary. Results are available upon request.
39Although the negative demand shock and outflow rates are correlated, there is still important spatial variations in
distribution of immigrants in 2009, share of construction sector prior to the crisis and intensity of the demand shock as can be seen in the maps in Appendix Section N1.
40The normalisation of the independent variable takes care of the concerns due to size of the immigrant population
To deal with this identification issue, I construct an instrument adapting the “shift-share” methodology
which is widely used in the literature.41 Immigrants tend to locate disproportionately in areas where other
immigrants from the same nationality or ethnicity have located in the past, to benefit from social and economic networks established by those who arrived earlier. I exploit this “past settlement instrument” and use the past spatial distribution of the immigrants in order to predict the current location patterns. Specifically, I distribute year-to-year variation of the national stocks (the “shift”) of different nationalities across provinces according to some historical distribution of immigrants (the “share”).
To construct the instrument, I first calculate the share of immigrants located in province j in 1991.
sharenj,1991= F oreignn j,1991 PR r F oreignnj,1991 (14)
To obtain yearly predictions of the number of immigrants by nationality n for province j in year t,
I multiply the expression 14 by annual national stock of immigrants F oreignn
j,t of nationality n . This
stock is calculated adding the number of immigrants of that nationality in all provinces in Spain, in
year t.42 I leave-out the stocks in the same province, to address concerns due to the introduction of
own-area stocks which may mechanically increase the predictive power of the instrument (Autor and Duggan, 2003; Goldsmith-Pinkham et al., 2020). The imputed immigrant stock of a specific nationaliy n in province j at time t is thus calculated allocating yearly total national stocks weighted by its historical share (14):
d
F Bj,tn = (F oreignnSpain,t) ∗ share
n
j,1991 (15)
To calculate the imputed total (all nationalities) immigrant stock in province j at time t, I sum (15) across nationalities (N ): d F Bj,t= N X n ( dF Bn j,t) (16)
Note that the instrument is constructed from combining nationality-specific predictions for every province (a weighted sum of the national-minus-province inflows using the distribution of nationality in 1991 as weights). These predicted stocks generate a variation by exploiting differences in national flows and the initial distribution across labor markets which are arguably less endogenous to local economic conditions.
As a final step, I calculate the change in predicted immigrant stocks and divided it by the imputed population (imputed immigrant plus native stock) in province i at the beginning of the period t − 1. The 41This strategy has been set by Altonji and Card (1991) and modified by Card (2009), and followed by many including
Card (2001); Ottaviano and Peri (2006); Basso et al. (2019), applied in the case of Spain by Gonzalez and Ortega (2011, 2013); Sanchis-Guarner (2017); Fernández-Huertas Moraga et al. (2019).
42F oreignn
j,t=
PR