HAL Id: hal-01403775
https://hal.archives-ouvertes.fr/hal-01403775
Submitted on 27 Nov 2016
HAL is a multi-disciplinary open access
archive for the deposit and dissemination of
sci-entific research documents, whether they are
pub-lished or not. The documents may come from
teaching and research institutions in France or
abroad, or from public or private research centers.
L’archive ouverte pluridisciplinaire HAL, est
destinée au dépôt et à la diffusion de documents
scientifiques de niveau recherche, publiés ou non,
émanant des établissements d’enseignement et de
recherche français ou étrangers, des laboratoires
publics ou privés.
ICFHR2016 Competition on the Classification of
Medieval Handwritings in Latin Script
Florence Cloppet, Véronique Eglin, Van Kieu, Dominique Stutzmann, Nicole
Vincent
To cite this version:
Florence Cloppet, Véronique Eglin, Van Kieu, Dominique Stutzmann, Nicole Vincent. ICFHR2016
Competition on the Classification of Medieval Handwritings in Latin Script. International Conference
in Frontiers on Handwriting Recognition ICFHR 2016, Oct 2016, Shenzhen, China. �hal-01403775�
ICFHR2016 Competition on the Classification of Medieval Handwritings in Latin
Script
Florence Cloppet
1, Véronique Eglin
3, Van Cuong Kieu
1, Dominique Stutzmann
2, Nicole Vincent
11
LIPADE Paris Descartes University
Paris, France e-mail: {florence.cloppet, nicole.vincent, van-cuong.kieu}@parisdescartes.fr 2 IRHT- CNRS Paris, France e-mail: dominique.stutzmann@irht.cnrs.fr 3 LIRIS UMR5205 Université de Lyon - CNRS - INSA-LYON Lyon, France e-mail: veronique.eglin@insa-lyon.fr
Abstract—This paper presents the results of the ICFHR2016
Competition on the Classification of Medieval Handwritings in Latin Script (CLaMM), jointly organized by Computer Scientists and Humanists (paleographers). This work aims at providing a rich database of European medieval manuscripts to the community on Handwriting Analysis and Recognition. At this competition, we proposed two independent classification tasks which attracted five participants with seven submitted classifiers. Those classifiers are trained on a set 2000 images with their ground truths. In the first task – Script classification – the classifiers have been evaluated by a test set of 1000 single-type manuscripts. In the second task, a ―Fuzzy Classification‖ has been carried out on a set of 2000 multi-script-type manuscripts. The results of the participants provide the first baseline evaluation up to the accuracy score of 83.9% for the task 1 and to the fuzzy weighted score of 2.96/4 for the task 2. An analysis based on the intra-class distance and matrix of confusion of each classifier is also given.
Keywords- Historical documents; Image classification; Feature extraction; Character style recognition; Latin script classification
I. INTRODUCTION
Automated analysis and classification of handwritings applied to the written production of the European Middle Ages is a new challenge and a “frontier in handwriting recognition”. Digital libraries from Cultural Heritage institutions contain literally ten-thousands of digitized manuscripts of the European Middle Ages. The overwhelming majority of manuscripts in there are written in Latin script, and the digital libraries are growing, with often scarce metadata on script identification.
Some examples: more than 16,000 fully digitized manuscripts in Gallica (http://gallica.bnf.fr, Bibliothèque nationale de France); 12,800 in Manuscripta Mediaevalia (http://www.manuscripta-mediaevalia.de/); 7,860 in the BVMM – Bibliothèque Virtuelle des Manuscrits Médiévaux (http://bvmm.irht.cnrs.fr, Institut de Recherche et d‟Histoire des Textes, CNRS); 4,800 in DVL DigiVatLib (http://digi.vatlib.it/mss/, Bibliotheca Apostolica Vaticana).
In this context, there is a need for an automated “tagging” or “cataloguing” of the handwriting on the images. One of the difficulties is that there is a historical continuum in the evolution of scripts so that there are mixed script types and debates among paleographers regarding the definition of classes. Automated classification should not only allow for historical research (when and how which text is written), but is also a pre-requisite for handwritten text recognition (HTR) or automated indexing and data mining. To perform HTR on the digitized manuscripts, one “numerical model” is necessary to recognize the text for each script type and the identification of the script type is the first step.
The paper is organized as follows. Section 2 provides an overview of the competition, the datasets and the evaluation strategies. Section 3 presents briefly the participating systems. The evaluated results are presented in section 4 and announces the winners. Section 5 will conclude the paper.
II. OVERVIEW OF THE COMPETITION
In this competition, the training dataset and the test dataset for task 1 encompass well defined script types, in order to make the evaluation possible. In task 2, the test dataset also contains mixed script types and images with several scripts.
A. Dataset
Both training and test datasets consists of grey-level images in TIFF format at 300 dpi, picturing a 100 x 150 mm part of a manuscript. The three sets (training, task 1, task 2) consist of, respectively, 2000, 1000, and 2000 images.
The image collection used for the competition is mainly based on the collection of 9800 images from the French catalogues of dated and datable manuscripts[1], increased with the on-line documentation from the BVMM and Gallica in order to build classes of the same size.
The images of the training set are tagged according to 12 labels (see Figure 1). The classes are based on morphological differences, as defined in works on Latin scripts[2], [3].
1-Uncial 2-Half-uncial 3-Caroline 4-Humanistic 5-Humanistic Cursive 6-Praegothica 7-Southern Textualis 8-Semitextualis 9-Textualis
10-Hybrida 11-Semihybrida 12-Cursiva Figure 1. Examples of the twelve concerned medieval script types
TABLE I. CARDINALITY OF THE SCRIPT CLASSES FOR TASK 1 Class Labels
1 2 3 4 5 6 7 8 9 10 11 12 Number of images 87 90 86 82 79 84 82 68 85 88 83 86 TABLE II. CARDINALITY OF THE SCRIPT CLASSES FOR TASK 2
Class Labels
1 2 3 4 5 6 7 8 9 10 11 12 Number of images 133 27 250 58 61 566 49 163 862 270 154 408
B. Evaluation Strategies
The success of a system generally relies on two aspects, one is the choice of features to represent the data, and the other is the use of a classifier. Thus, there are two rankings.
The first and primary ranking is based on the average accuracy. The second ranking is based on the average intraclass distances (AID) that reflect the adequacy of the used features. The intraclass distance value is computed as the mean value of the distances between all the images belonging to a class according to the ground truth. The lowest value indicates the script of the class that have identical values with respect to the chosen feature.
Comparison is possible as the proposed distances have been normalized.
In task1, the average accuracy is computed according to the ground truth, which has one label for each script image; it is the average value of the accuracies associated with each script. The values are presented in table III. The second ranking is based on the AID.
To further analyze the behavior of the systems, Figure 3 displays the confusion matrices. The color of the patches expresses the percentage of the writing of ground truth classes read in line that are recognized in the class expressed by the column number. Ideally the matrix should be white with black elements on the diagonal. The gray values that appear in other places express the ambiguities that may appear between the classes. We can assume the more the scripts are alike, the more confusion will appear between the classificated elements.
For task 2, only a soft classification is possible as several labels, at most two, may be associated in the ground truth with the images containing a mixt of scripts. As a couple of answers is expected, the global accuracy for fuzzy results is expressed as a score associated with the different cases: only the two highest membership degrees define the associated labels; the score is +4 if both associated labels match the labels in ground truth; +2 if only the first label matches one of the labels in the ground truth; +1 if only the second label matches one label in the ground truth; -2 points if none of the labels matches one of the labels in the ground truth. The final score is the mean value of all scores. The maximum value is then equal to 4. The values are presented in table IV.
The second ranking aimed at analyzing rather the adequacy of the features to the image content. We have made use of the confidence that is given to the major writing style in each ground truth class. Figure 4 represents the average membership degree matrices for images with only one label (line are associated with the ground truth label). Ideally each line should contain one dark value and others lighter one figuring the difficulty to differentiate the script.
The submitted systems require different environments, so that we decided not to rank the processing time.
III. SUBMITTEDSYSTEMS
The competition has been organized as follows: there were seventeen registered participants (individuals and teams), five registered only for task 1, the others registered for both tasks 1 and 2. Five teams provided executable files, all five for both tasks, summing up to seven files (one participant delivered three different executable files). Other participants decided to stop after the first training step. Other participants stopped the competition after the first step by observing their system reaction towards the initial training dataset. Here we present briefly the seven named classification propositions: DeepScript, FAU, FRDC-OCR, NNML, TAU-1, TAU-2, TAU-3, including the basic methodological fundaments. Three propositions lie on deep architectures (Deepscript, FRDC-OCR, NNML) based on Convolutional Neural Networks (CNN).
A. DeepScript: Antwerp University System
The DeepScript system uses a „vanilla‟ neural network architecture. The model used is a single-color channel variation of the popular VGG-architecture [4]. The model takes the form of a deep stack of convolutional layers, each with a 3x3 perceptive field an increasingly large number of filters at each block of layers (2 x 64 > 3 x 128 > 3 x 256 > 3 x 512). This convolutional stack feeds into two fully-connected dense layers with a dimensionality of 1048, before feeding into the final softmax layer where the normalized scores for each class label get predicted. Models were trained with a (smallish) batch size of 30 and traditional stochastic gradient descent (with Nesterov momentum) and cross-entropy loss. No weight decay was used, but the initial learning rate of 0.01 was reduced by a factor of 3 after each series of 10 epochs. To regularize, Dropout layers were inserted towards the higher end of the network; all layers make use of random Glorot-initialization and a ReLU activation function. Models were trained for thirty epochs: after each epoch, the new weights of the network were saved only if these outperformed the previous validation accuracy.
Preprocessing stage. For development purposes, a random,
yet stratified split of the available training images was created, containing 90% (ca. 150 images per category) and 10% (ca. 17 images per category) respectively of the full CLaMM training dataset. Because of the small size of the dataset, both training and development estimates were highly noisy and considerably instable. To account for this, DeepScript followed an augmentation strategy. During each epoch, each image got downscaled by a factor of two and 100 random crops 300x300 were selected. These crops were augmented by using random perturbations affecting the zoom level, rotation angle, shear range and translation in both dimensions, eventually yielding a new random stream of 150x150 training items in each epoch.
At test time, DeepScript selected 30 random 150x150 crops from each downscaled test image, without applying augmentation. The model‟s predictions for these random crops were averaged before predicting the script label. The final submission uses an ensemble of three different models, the predictions of which were averaged. The distance matrix scores yielded were obtained by calculating the Ruzicka distance between the final probability arrays outputted for a test image. Individual models would reach development accuracy around 88%.
Device details. These models were trained on a Titan X
GPU (donated by NVIDIA), using the popular Theano library interfaced via Keras. Apart from more conventional packages in the scientific Python system (e.g. Numpy), the code extensively relies on frameworks such as scikit-learn and scikit-image.
B. FAU: Friedrich-Alexander-Universität Erlangen-Nürnberg System
The FAU system proposes to model the characteristics of each writer (style) by describing the global distribution of feature vectors computed from local image patches by so-called i-vectors [5]. I-vector extraction is a well-known method in the field of speaker verification. The extracted i-vectors are session-compensated using Within_class covariance normalization (WCCN). Finally, the vector is classified using a Latent Dirichlet Analysis (LDA). Authors use descriptors based on Scale Invariant Feature Transform (SIFT), that encode gradients in the neighborhood of scale and rotation invariant positions of keypoints. Since rotation-invariance is not necessary for the classification of handwriting, they set the key-point angles to zero. Then they employ RootSIFT features (variant of SIFT where the features are additionally normalized using the square root (Hellinger) kernel [6]. Since SIFT vectors are composed of histograms, the Euclidean distance between two vectors can be dominated by the large bin values. This effect is reduced by using the Hellinger distance instead.
For the classification stage, they use the Latent Dirichlet Analysis (LDA), which works very well for low-dimensional i-vectors.
C. FRDC-OCR: Fujitsu Research & Development Center System
The FRDC-OCR system is a CNN based classifier. As shown in Figure 2, firstly, patches are extracted from the input image with fixed size. Authors select the patches evenly from the image to ensure that they can represent each area of the image. Secondly, each patch is recognized by a trained CNN classifier. The output of the CNN classifier contains two parts: the feature vector which describes the patch and the recognition results with confidence. At the last step, authors calculate the average feature vector and the average confidences of all patches. The average feature vector and the confidences are seen as the results for the whole image.
The distance matrix is obtained by using the average feature vectors for each image. The chosen measurement is the Euclidean distance. The recognition results for task 1 and task 2 are obtained by using the average confidences of each image. The class with the highest confidence is the result for task 1. The confidences of the classes are the results for task 2.
Figure 2. Proposed CNN Architecture. Bounding boxes are used patches The CNN classifier is trained with patches extracted from the document image. About 80% of the samples are used for
training and the rest 20% as validation set. For the recognition about 1000 patches are extracted from the document image.
The patches used for the training stage are chosen randomly. Most of the training patches are used only once during the whole training process. The various training patches are essential to improve the performance of the CNN classifier.
D. NNML: Brigham Young University System
The NNML system lies on Deep CNNs that employ residual learning and batch normalization [7]. The architecture of each network is like the 50-layer network described in [8] with fewer convolution filters for each layer. To build the training set, 256x256 sub-windows have been extracted from each of the 2000 provided images at a stride of 42x42 pixels. The label for each sub-window is the script class of the image from which it was extracted. CNNs are trained to classify 227x227 sub-windows into one of the twelve script classes. At test time, the large manuscript image is cut up into overlapping 227x227 sub-windows and each is classified. The used training protocol is based on a stochastic gradient descent optimization for 220.000 data mini-batches of 40 randomly drawn instances, an initial learning rate (initial rate = 0.01) divided by 10 every 50.000 mini-batches, a L2 weight decay regularization of 0.0005, and a momentum of 0.9. Input sub-windows are linearly scaled to the range [-0.5,0.5], and a random 227x227 crop is applied as on-the-fly preprocessing of the 256x256 input sub-windows.
The resulting classification is then the average prediction of each sub-window. For improved accuracy, predictions are also averaged over an ensemble of CNNs, working over different scales of the image. The deep learning library Caffe was used to train the models.
At test time, 227x227 sub-windows are extracted from the test image at a stride of 100x100 pixels. The CNN predicts a distribution over the script classes for each sub-window. These predictions are then uniformly averaged together over all sub-windows to obtain the overall prediction of the CNN.
In the ensemble, each CNN is trained at a particular image scale. This is accomplished by scaling the original images before sub-window extraction (for both training and testing). Then, each CNN computes a prediction (averaged over the sub-windows extracted at the appropriate scale) and these predictions are uniformly averaged over all CNNs in the ensemble. The single label prediction required for task 1 is the class with the highest probability in the prediction. The class scores for task 2 are simply the predicted probabilities. The final pair-wise distance matrix is constructed by taking the pair-wise Euclidean distance between the predicted probability vectors and then normalized.
E. TAU: Tel Aviv University Systems
The TAU system consists in three variant of a single method that consists in representing each document as a histogram of binary 3x3 patches. The identification of
document‟s type is performed via k-NN (k=1) out of the training histograms.
Preprocessing stage. Each document is binarized via an
Otsu algorithm without any image correction. In fact, the author‟s research shows that some of the document‟s artifacts (extra-large capital letters of calligraphic exaggerations) can be beneficial for text labeling. The binarization is then transformed into a histogram of small 3x3 patches (overlapping in the original document), see Figure 3. The only elements of the histogram that are not taken into account are all-white and all-black patches; the rest of the frequencies are normalized accordingly.
Three scenarii of classification are then proposed, two are based on k-NN for the classification step (TAU-1 with the L1
-Norm &, TAU-2 with the Bhattacharyya--Norm) and the last
on a regression model BL (TAU-3). They lead to the three following propositions based on variant on training and decision stages.
Training stage (TAU-1&TAU-2). The histograms are stored
in a small database with their types‟ label. For those two first scenarii, they use k-NN algorithm without any other further processing requirement.
Training stage (TAU-3). All the histograms are stored in a
matrix (row for each histogram) along with zero-ones vectors for each label L, YL. For each label, a regression model BL is constructed (12 models in total).
Decision stage (TAU-1 &TAU-2). The nearest neighbor (i.e.
closest histogram in the training set) is selected, for TAU-1 via L1 Norm along with its label (“Type 1”) and for TAU-2
via Bhattacharyya Norm. The first two neighbors are considered (with the second neighbor belonging to a different class). The distance matrix table is filled proportionally to the scoring rules of “Task 2”, while in “Task 2” two default values are used for Type 1 and Type 2.
Decision stage (TAU-3). For each vector (histogram), the
different BL models are used for prediction purposes. The class with the highest prediction is selected (“Type 1”). If desired the next class (“Type 2”) can be selected by the same process. Only the best two classes are considered. The distance matrix table is filled proportionally to the scoring rules of “Task 2”, while in “Task 2” two default values are used for Type 1 and Type 2.
IV. EXPERIMENTS AND EVALUATION
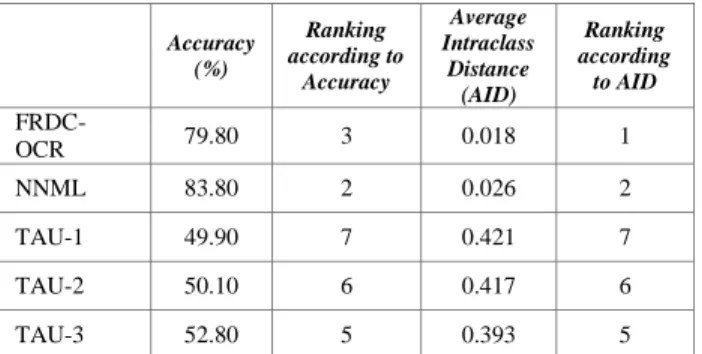
The systems were run by the organizers and the generated outputs evaluated as described above. Four systems obtain high accuracy rates in task 1 and prove that the automated classification can be applied for manuscript cataloguing and as a first step for HTR. FAU is the winner on the primary ranking, although its AID is not the best one.
TASK1RANKING Accuracy (%) Ranking according to Accuracy Average Intraclass Distance (AID) Ranking according to AID DeepScript 76.49 4 0.039 3 FAU 83.90 1 0.068 4
Accuracy (%) Ranking according to Accuracy Average Intraclass Distance (AID) Ranking according to AID FRDC-OCR 79.80 3 0.018 1 NNML 83.80 2 0.026 2 TAU-1 49.90 7 0.421 7 TAU-2 50.10 6 0.417 6 TAU-3 52.80 5 0.393 5
In task 2, three systems yield a high, similar score. DeepScript is the winner on the primary ranking. The secondary ranking based on AID gives about the same order as in task 1; AID and accuracy are partly uncorrelated.
TASK2RANKING Final Score Ranking according to Score Average Intraclass Distance (AID) Ranking according AID DeepScript 2.967 1 0.146 3 FAU 2.784 2 0.174 4 FRDC-OCR 2.631 4 0.120 1 NNML 2.771 3 0.134 2 TAU-1 0.615 6 0.260 6 TAU-2 0.590 7 0.259 5 TAU-3 1.226 5 0.356 7
The results given by the best performing systems can be evaluated not only from an image analysis point of view, but also towards a historical interpretation. Indeed, the script classes are historical phenomena, since some script types gave birth to other ones.
Whereas the accuracy and average intraclass distance measures correspond to the system performances in a supervised learning process, the systems integrate de facto some pre-assumptions, methods, features, and historical conclusions of paleographers, which are embedded within the training dataset, but not all beyond debate [1]. The outputs cannot aim at revising the extant classification, but they can be evaluated along their heuristic efficiency. Indeed, the four systems that yield an accuracy above 75%, the confusion matrix (Figure 3) and the membership degree matrices (Figure 4) appear all but random from a historical perspective. In Figure 3, all four systems disperse Semi-uncial scripts onto Uncial and Caroline, which are two historically related script types. Likewise, Humanistic and Humanistic cursive are sparsely intermingled by DeepScript, FAU, and NNML systems, but are very clearly separated from all other classes: this reflects their close historical connection beyond their great differences. It is however surprising that there are so few connections with Caroline and Praegothica since Humanistic was created as a direct imitation of late Caroline scripts.
In Figure 3, DeepScript, FAU, and NNML systems also group together Praegothica, Southern Textualis, Semitextualis, and Textualis. Praegothica is almost exclusively dispersed onto Textualis and Southern Textualis, both scripts having emerged from it. Semitextualis is less accurately defined. This script was mostly used in Southern Europe and, beyond a reduced form of letter “a” which is not shared by neither Textualis nor Southern Textualis, it clearly appears to be confused with both Textualis and Southern Textualis. Southern Textualis is confused with Textualis. Interestingly, it is rarely confused with Praegothica, emphasizing the transformation that occurred at the eve of the 13th c., even if resulting into two different script types. Yet, conversely, Textualis is less confused with Southern Textualis than with Semitextualis and Praegothica: this fact could be interpreted as a more direct phylogenetic link from Praegothica to Textualis and a derivation from Textualis to Southern Textualis.
A last gathering of scripts can be clearly identified in the dispersion matrix of DeepScript, FAU, and NNML systems: Hybrida, Semihybrida, and Cursiva, with additional, not reciprocal connections from Hybrida towards Semitextualis. These three scripts are historically connected, and Hybrida is also called loopless “cursive” (Semihybrida being an intermediary between “looped” and “loopless”[3]). The detail of the dispersion shows very clearly that Hybrida can be confused with Semihybrida rather than with Cursiva; Semihybrida can be confused with both, but is closer to Cursiva; Cursiva is neatlier defined.
Figure 4 illustrates how interconnected the different script types are, as evidenced by the outputs in task 2. The main observations from Figure 3 are to be made: script types 6-9 (Praegothica, Southern Textualis, Semitextualis, Textualis) share common features, as do script types 10-12 (Hybrida, Semihybrida, Cursiva). New phenomena emerge: Praegothica is the class having the most common features with other scripts, and even if it appears very specific in FAU, it shares commonalities with Caroline and Textualis, much more than in Figure 3, and totally in line with its historical situation. Likewise, Caroline which was classified with a high accuracy and little confusion now appears similar with Praegothica.
V. CONCLUSION
Given an image of a medieval manuscript page, several systems are able to classify the script type with a reasonable accuracy (more than 80% in task 1, with a score above 2.7 out of 4 in task 2). This classification accuracy is not strictly correlated with the AID, reflecting the compactness of each class and, as such, the quality of the features. The aims of cataloguing and classifying for HTR are achievable.
The confusion matrix for task 1 and the membership degree matrices for task 2 allow to analyze the errors or dispersion of the results, which are largely to be explained by the overall historical and graphical connection between script types. In this regard, the methods reflect accurately the paleographical classifications; they appear to be potentially relevant also for historical analysis.
ACKNOWLEDGMENT
The authors thank Marlène Helias-Baron and Henri Seng (IRHT) who selected the image data sets and ran the executable files.
REFERENCES
[1] D. Stutzmann, “Clustering of medieval scripts through computer image analysis: towards an evaluation protocol”, Digital Medievalist Journal, vol. 10, 2015.
[2] B. Bischoff, Paläographie des römischen Altertums und des abendländischen Mittelalters. Berlin: Erich Schmidt, 1986. [3] A. Derolez, The Palaeography of Gothic Manuscript Books from the
Twelfth to the Early Sixteenth Century. Cambridge: Cambridge University Press, 2003.
[4] K. Simonyan et A. Zisserman, « Very Deep Convolutional Networks for Large-Scale Image Recognition », ArXiv14091556 Cs, sept. 2014.
[5] N. Dehak, “Language recognition via i-vectors and dimensionality reduction”, in Interspeech, 2011.
[6] R. Arandjelović and A. Zisserman, “Three things everyone should know to improve object retrieval”, in 2012 IEEE Conference on Computer Vision and Pattern Recognition (CVPR), 2012, p. 2911‑ 2918.
[7] S. Ioffe and C. Szegedy, “Batch Normalization: Accelerating Deep Network Training by Reducing Internal Covariate Shift”, ArXiv150203167 Cs, févr. 2015.
[8] K. He, X. Zhang, S. Ren, et J. Sun, “Deep Residual Learning for Image Recognition”, ArXiv151203385 Cs, déc. 2015.
Figure 3. Confusion matrices for task 1.