HAL Id: hal-01854150
https://hal.archives-ouvertes.fr/hal-01854150
Submitted on 6 Aug 2018HAL is a multi-disciplinary open access archive for the deposit and dissemination of sci-entific research documents, whether they are pub-lished or not. The documents may come from teaching and research institutions in France or abroad, or from public or private research centers.
L’archive ouverte pluridisciplinaire HAL, est destinée au dépôt et à la diffusion de documents scientifiques de niveau recherche, publiés ou non, émanant des établissements d’enseignement et de recherche français ou étrangers, des laboratoires publics ou privés.
Laurent Cormier
To cite this version:
Laurent Cormier. Diffraction and X-ray absorption spectroscopy. Akira Takada, John Parker, Alicia Duran, Klaus Bange. Teaching Glass Better: 10th Anniversary of the ICG Summer School , ICG; International Commission of Glass, pp.57-81, 2018, 978-84-17528-04-1. �hal-01854150�
Entropy 2018, 20, x; doi: FOR PEER REVIEW www.mdpi.com/journal/entropy
Diffraction and X-ray absorption spectroscopy
Laurent Cormier 1,*
1 Sorbonne Université, Muséum National d’Histoire Naturelle, CNRS UMR 7590, IRD, Institut
de Minéralogie, de Physique des Matériaux et de Cosmochimie, IMPMC, 75005 Paris * Correspondence: [email protected]
Abstract: X-ray/neutron diffraction and X-ray absorption spectroscopy are complementary experimental techniques giving pair distribution functions. There are selective tools to obtain structural information, probing short and medium ranges (up to typically 1nm), such as coordination, bond distances but also valence state, even at a dilute concentration. Moreover, spatial or time resolution, specific environments (high pressure/temperature, controlled atmosphere) can be achieved. In this chapter, the theoretical basis of each techniques is given and case studies applied to glasses are used to illustrate the structural information that can be extracted.
Keywords: X-ray diffraction; neutron diffraction; X-ray absorption spectroscopy; structure
1. Introduction
In order to verify the amorphicity of a glass, a primary tool is to use diffraction and to check that no Bragg peaks are apparent. However, diffraction patterns contain significant structural information. Indeed, the first structural characterizations were obtained by X-ray diffraction [1][2][3] leading to the famous Zachariasen-Warren model for oxide glasses.
Diffraction methods can successfully give direct information on the atomic structure, both at short and intermediate range order. Similarly X-ray absorption spectroscopy has become a popular tool to investigate the environment around specific elements. These experimental techniques can be easily compared to simulations. Finally, various environments can be adapted allowing measurements at high temperature and/or high pressure.
2. Diffraction by non-crystalline materials 2.1. Theoretical background
A theoretical description of the scattering processes can be found in various textbooks [4][5][6][7]. Early X-ray diffraction studies have already shown that the diffraction pattern can be
better understood after a Fourier transform to analyze the data in r-space. The structure factor, S(Q), is the diffraction intensity obtained after normalization and corrections. Its Fourier transform yields the pair distribution (correlation) function (PDF), g(r) [5]:
, (1)
where Q (Å-1) is the magnitude of the scattering vector, r is the interatomic distance and ρ
"
(atoms Å-3) is the atomic number density. 𝑄 = 4π sin(θ) λ⁄ with θ the scattering angle and λ the
wavelength of the incident neutron or X-ray photon.
Different functions are frequently used in the literature that are all related [8]:
- the pair distribution function g(r), describing the local fluctuations in density around the unit: g(r) = ρ(r) ρ⁄ , where ρ(r) is the r-dependent atomic density [9]; "
- the differential (or reduced) correlation function D(r) = 4πrb45ρ
"[g(r) − 1], that considers
deviations from the average atomic density ρ" and 𝑏45= ∑ 𝑐 =𝑐>𝑏=𝑏>
=,> , with 𝑐= the atomic
concentration for the element i and bi its the neutron scattering length;
- the (total) radial distribution function RDF(r) = 4πr5b45ρ
"g(r) or the total distribution
function T(r) = RDF(r) r⁄ .
2.1.1. The Faber-Ziman formalism
For a polyatomic material, S(Q) is a weighted sum of all partial structure factors (PSFs), Sαβ(Q)
[10], S(Q) = ∑F,GWFGSFG(Q), with the weighting factors Wαβ for the chemical species α and ß:
, (2)
The δαβ function takes into account that Sαβ(Q)=Sβα(Q). bi is the neutron scattering length and
fi(Q,E) is the atomic form factor. They both describes the interaction between the incident particle
and an atom i.
The PSFs only depend on the structure, while the weighting factors are different when diffraction is obtained by X-ray photons or neutrons. In consequence, a SNeutron(Q) and a SX-ray(Q) exhibit
significant differences in peak positions and intensities. Each PSF is associated with a partial pair distribution function (PPDF), gαβ(r), that gives the probability of finding an atom of type β at distance
r from an atom of type α taken at the origin (average distribution of atoms β around an atom α at the origin).
For a material containing n chemical species, 𝑛(𝑛 + 1) 2⁄ independent PSFs (or PPDFs) are required for a detailed description of the structure.
2.1.2. Fourier transformation
An important parameter in the diffraction technique is the highest accessible Q value, Qmax. A
Fourier transform with a small Qmax value yields a peak broadening that prevents to resolve two close
interatomic distances. High Qmax values are thus required to achieve high real space resolution. This
is experimentally obtained by using short incident wavelength λ (high incident energy).
An example of using high energy x-ray diffraction (HE-XRD) can be found in Petkov et al. [11]. A Qmax value of 40 Å-1 has been achieved allowing to separate Si-O and Al-O distances that are
separated by only 0.15 Å, in aluminosilicate glasses. A similar resolution can be obtained using neutron diffraction. The two P-O distances at 1.43 Å and 1.58 Å that exists in PO4 tetrahedra (terminal
oxygen and bridging oxygen) can be resolved [12].
2.2. Better to use neutron or X-ray?
Neutron and X-ray diffraction techniques are complementary tools to provide structural information. Table 1 summarizes the main differences between these two techniques. Since a X-ray photon and a neutron interacts differently with an atom, there are not sensitive to the same elements: X-ray diffraction is useful to probe high-Z elements while neutron diffraction can investigate light elements such as H or Li, and gives a different signal for different isotopes of the same element. While the neutron scattering length b is a constant, the X-ray form factor f depends on Z and decreases to zero at large Q-values. This decay limits the Q-range that can be achieved in a X-ray diffraction experiment for samples containing low-Z elements.
The complementary of the two diffraction techniques can be emphasized in borate and phosphate glasses containing elements responsible for the ionic conduction (alkali oxides or salts) [12][13][14]. For such materials, the borate or phosphate networks can be determined by neutron diffraction while the mobile species (especially ionic salts) is probed by X-ray diffraction.
Table 1. Comparison of neutron and x-ray diffraction
X-ray Neutron
Interaction with electronic cloud Interaction with the nucleus
f(Q,E) atomic form factor
strong variation of scattered intensity with q
information on high-Z elements
weak scattering for low-Z elements
weak contrast for elements with close Z
f varies with the energy ⇒ anomalous scattering
No isotopic effect
b neutron scattering length constant, independent of q
not a monotonous function of Z
light elements are visible (H, Li, N, O, etc)
possibility to distinguish elements with close Z
b can vary at some energies for some elements ⇒ anomalous scattering limited
b varies among isotopes of the same element => isotopic substitution
Small samples Large samples
Radiation can cause damage Radiation can cause activation
No magnetic information Magnetic information is possible
2.3. Determination of the structural parameters
The structural information is mainly obtained from the real space functions (figure 1). The peak position, rαβ, gives directly the average interatomic bond length between two atoms a and b, with a
great accuracy. For instance, using neutron diffraction, the Si-O bond length has been determined at 1.605 ± 0.003 Å [15]. The coordination number, Nαβ, defines the average number of neighbors b
around an atom a. Nαβ is obtained by integrating the area under the a-b peak:
, (3)
where r1 and r2 delimit the coordination shell. The choice for r1 and r2 can be delicate when several
contributions are overlapping, which reduce the accuracy. The peak width, sαβ, reflects the
However, sαβ is also broaden by the Fourier transform over a finite Q-range. rαβ, Nαβ and sαβ are
usually extracted by performing a Gaussian fit of the peak.
Figure 1. Correlation function and real space information.
2.4. Difference methods
The pair distribution function gives average information on the global structure of the material and it is dominated by the PPDFs having the largest weighting factors. For instance, Si-O, O-O and Si-O pairs strongly dominate the neutron pair distribution function in silicate glasses. Furthermore, the overlapping of the various contributions beyond 3 Å prevent rigorous interpretation without the recourse to some sort of modeling.
For a system of n elements, 𝑛(𝑛 + 1) 2⁄ independent PSFs (or PPDFs) must be determined to obtain a complete description of the structure. This can be obtained by performing 𝑛(𝑛 + 1) 2⁄ distinct experiments. Neutron and X-ray diffraction offer two different experiments so that, even for a binary system, an additional experiment is required. This can be achieved using a contrast variation method for which a specific element in the material is investigated. This allows the extraction of the PPDFs associated with this element, which are otherwise buried beneath other contributions having strong weighting factors.
In the structure factor, the PSFs and the atomic concentration ci depends upon the structure and
composition of the material, respectively. However, the scattering power (b or f(Q,E)) of a given element can both be modified. Important variation in the amplitude of b (and even its sign) can exist from one element to another or considering different isotopes of the same element. The first property has been used in isomorphic substitution where an element is replaced by another playing and identical role in the structure but having a significant different b value [16]. The use of different isotopes allows a more rigorous contrast method, called isotopic substitution. Similarly, f(Q,E) can vary significantly when E is close to an absorption energy that is characteristic of the electronic structure of a specific element. This is at the origin of the anomalous diffraction. For these two contrast methods, neutron diffraction with isotopic substitution (NDIS) and Anomalous X-ray diffraction (AXRD), the higher the contrast variation for b or f, the higher the reliability of the results.
2.4.1. Neutron diffraction with isotopic substitution (NDIS)
The isotopic substitution method consists in measuring the scattering intensity for two samples, prepared rigorously identically (allowing the assumption that they have the same structure, i.e. identical cα, cβ and gαβ(r)) but one species, M, has different isotopic concentrations. Two structure
factors are obtained for the two samples, where only the PSFs involving M have different weighting factors:
, (4)
By taking the difference between these two functions, all terms not involving M are eliminated. The subtraction gives a first difference function, DM(Q), that contains only the PSFs associated with
M and, after Fourier transformation, the M-centered PDF:
𝐺MN(𝑟) =2 𝜋Q ΔM(𝑄)𝑄𝑠𝑖𝑛(𝑄)𝑑𝑄 𝐺MN(𝑟) = 2 ∑ 𝑐N𝑐M𝑏N(𝑏M− 𝑏V M)𝑔MN(𝑟) NXM + 𝑐M5Y𝑏M5 − 𝑏VM5Z𝑔MM(𝑟), (5)
Figure 2 illustrates a first difference function obtained on a K2TiSi2O7 using isotopic substitution
for Ti (46Ti and 48Ti isotopes) [17]. This glass contains 𝑛(𝑛 + 1) 2⁄ = 10 partial functions that
overlaps. The first difference function, GTia(r) presents a first contribution with two Ti-O distances:
a small peak at 1.68 Å whose Gaussian fitting indicate 1 O neighbor and a more intense one at 1.96 Å corresponding to 4 O neighbors. This short range order is compatible with a square-based pyramid geometry, effectively encountered in crystalline structures. The advantage of the first difference
function is to reveal the short Ti-O distance at 1.68 Å which is buried beneath the strong Si-O contribution in the total function.
Figure 2. Total differential correlation functions (top curve) for a K2TiSi2O7 glass containing 46Ti
isotope and first difference functions (lower curve, displaced for clarity) for Ti. Insert shows the TiO5 square pyramid site with the two Ti-O distances. The figure is adapted from [17].
For a simple binary glass, GeSe2 [19][20], NDIS using Ge and Se isotopes was used to extract
all partial functions. The network was investigated in details, revealing GeSe4 tetrahedra sharing both
edges and corners. The determination of GeGe and SeSe PPDFs has revealed the presence of homo-nuclear Ge-Ge or Se-Se bondings that are specific structural features of chalcogenide glasses. .
If three samples with different isotopic concentration are measures, two first differences, DM(Q)
and D'M(Q) can be calculated:
∆M(Q)=2 ∑α≠McαcMbαYbM-b'MZ(SMα(Q)-1)+cM2 \bM2-b'M 2 ] (SMM(Q)-1) ∆'M(Q)=2 ∑α≠McαcMbαYb'M-b''MZ(SMα(Q)-1)+cM2 \b'M 2 -b''M 2 ] (SMM(Q)-1) , (6)
The equation (6) separates the weighting factors between M and a chemical species a (a ≠ M) and the M-M weighting factor. Indeed, the isotopic composition of the three glasses can be judiciously chosen to equalize the quantities 𝑏M− 𝑏MV = 𝑏
The subtraction of DM(Q) and D’M(Q) allows the isolation of the M-M PPDF:
, (7)
Using such double difference method, a single PPDF can be extracted in a multicomponent glass. This GMM(r) PPDF gives directly the distribution of cations M within the structure. Gaskell et al. have
obtained GCaCa(r) showing well-defined Ca-Ca distances in a CaSiO3 glass that they interpreted as
edge-sharing Ca polyhedra forming corrugated rafts in the silicate network [21]. This approach has been extended to various cations (Ca, Ti, Ni, Li) in oxide glasses and has revealed cation organization with periodic M-M distances (and specific distances which are absent). Figure 3 shows these M-M correlations that are convincing evidences of clustering and percolation domains in silicate glass structures [22].
Figure 3. Second difference functions corresponding to the M-M PPDF showing the cation-cation distribution in glasses with specific distances. From top to bottom: Ni Ca2NiSi3O9, Ti in K2TiSi2O7,
Ca in Ca2NiSi3O9, Li in LiAlSiO4. The figure is adapted from [23].
A few elements have isotopes with both positive and negative scattering lengths (H, Li, Ti, Cr, Ni, Sm, Dy, W). An appropriate mixture of isotopes enables to have an element with a zero scattering
length. For a binary glass, this implies that the substituted element does not have scattering and only the other element is contributing to the scattering. As an example, the null isotopic substitution method applies to a binary Dy7Ni3 metallic glass has allowed the isolation of all partial functions [24].
For such a binary system, a matrix form can summarize the treatment:
^ 𝑆`(𝑄) 𝑆5(𝑄) 𝑆a(𝑄) b = c 𝑐N5𝑏 N5 𝑐M5𝑏M5 2𝑐N𝑐M𝑏N𝑏M 𝑐N5𝑏 N5 𝑐M5𝑏VM5 2𝑐N𝑐M𝑏N𝑏VM 𝑐N5𝑏 N5 𝑐M5𝑏VVM5 2𝑐N𝑐M𝑏N𝑏VVM d ^ 𝑆NN(𝑄) 𝑆MM(𝑄) 𝑆NM(𝑄) b , [𝑆(𝑄)] = [𝐴][𝑃𝑆𝐹(𝑄)] (8)
S1(Q), S2(Q) and S3(Q) are three distinct measurements using three isotopic mixture for the
element M. A matrix inversion can then be calculated to obtain each PSFs:
[𝑃𝑆𝐹(𝑄)] = [𝐴]h`[𝑆(𝑄)], (9)
2.4.2. Anomalous x-ray diffraction (AXRD)
The anomalous X-ray diffraction technique takes advantage that the atomic form factor f depends upon the incident energy, E:
, (10)
with f0(Q) the usual Q-dependent term. f’(E) and f’’(E) are the real and imaginary parts of the
anomalous term and they strongly vary near the energy of an absorption edge, Eedge, for a given
element, M, which drastically change the scattering by the atoms M [25][26].
By measuring the scattering intensities of a sample at two different energies (figure 4), a first difference function similar to NDIS can be obtained. Contrary to NDIS, one sample is needed, avoiding inaccuracies in sample preparation. A second difference function can also be extracted by measuring the sample at three different energies. This was used for instance to determine the distribution of Ba in Ba-silicate glasses [27]. Anomalous neutron diffraction also exists for a limited number of elements (e.g. Sm) [28].
AXRD can be used for a large number of elements (K or L absorption edges for low- and high-Z elements, respectively). However, the Q range has to be sufficient to ensure a good real space resolution. A Qmax value of 10 Å-1, which can be considered as a lower limit, corresponds to an energy
of 10 keV. This implies that AXRD can be used to probe elements for Z ≥ 26 (iron K-edge).
As an example, AXRD was used to investigate the structure of GexSe1−x binary glasses.
Experiments at Ge and Se K absorption edges allowed the isolation of the partial functions, showing a gradual change with x. The SSeSe(Q) PSF exhibits a pre-peak at low Q values associated with
intermediate-range structure and shows variations at x = 0.20, in agreement with a stiffness transition [29].
Figure 4. Variation of f’ and f’’ near an absorption edge energy Eedge (l2, l3). AXRD usually
considers two experiments at the edge (l2 or l 3, where the variation of f is the highest, and far below
the edge (l1) where f’ and f” are almost constant, rather than above the edge (l4) due to oscillations
in f”.
2.5. Modeling techniques
In section 2.3, we have developed how to simply obtained information by Gaussian fitting. However, more information can be extracted based on modeling techniques. The most popular techniques (Reverse Monte Carlo and Empirical Potential Structure Refinement) are inverse methods based on fitting the diffraction data using 3-D models of the glass structure. They are usually giving the most disordered organization in agreement with the measured data and care must be taken to avoid over-interpretation of the models.
The Reverse Monte Carlo (RMC) method consists to move randomly the atomic position in order to reproduce the diffraction data [30][31][31]. If the move improves the agreement between the model and the experimental data, it is accepted. If the move does not improve the fit, it is accepted with some probability to avoid to be trapped in local minima. The model needs to be constrained by additional parameters: density, known coordination numbers, distance of closest approach between atomic pairs etc.
This approach was particularly useful to understand the atomic structure of bulk metallic glasses [32][33][34] that are based on packing of spheres as in RMC. Analysis of structural models has allowed the determination of the short range corresponding to polyhedra of 9-13 atoms with the solute atom at the center, surrounded by the solvent atoms. Surprisingly, these models show also important medium range ordering due to the packing of these polyhedra arranged in 5-fold symmetry. This symmetry, that is not compatible with crystal periodicity, can explained the glass forming ability of these materials.
Empirical Potential Structural Refinement (EPSR) is now widely used and includes realistic intra- and inter-molecular potentials [35], giving more realistic atomic models. The agreement with the experimental data is obtained by fitting an empirical potential acting as a perturbation to the potentials. Again atomic displacements are generated and a Monte Carlo refinement modifies the empirical potential to reproduce the experimental data. This method was particularly useful to simulate molecular systems [36] but was also employed for complex oxide glasses [37].
3. X-ray absorption spectroscopy
X-ray absorption spectroscopy (XAS) is another method allowing a measurement that gives a pseudo pair distribution function. Since it is a chemically selective probe, the information is similar to a NDIS or AXRD experiment. This technique emerges with the development of synchrotron radiation sources in the 1970s that allow electromagnetic multi-wavelengths radiation and high flux of photons. XAS began to be used as a quantitative tool for structural investigation of glasses at the beginning of the 1980s [38][39][40] and soon some crucial results were obtained, which were at the origin of the Modified Random Network model proposed by Greaves [38][39]. This is a technique well suited for disordered systems, offering many advantages: structural and electronic information, complementary to diffraction, applicable to all the elements with a high sensitivity (few ppm of a dilute chemical species can be detected), complex environment (high pressure, high temperature, controlled atmosphere …), space and time resolution.
3.1. XAS basics
The principle of XAS corresponds to the measurement of an absorption coefficient, µ, as a function of the energy E of the incident X-ray photon beam, following the Beer-Lambert law:
𝜇(𝐸) =`k𝑙𝑛 \mm(n)
o(n)], (11)
with x the thickness of the sample. I0 and I are the intensities of the incident and transmitted
beams, respectively.
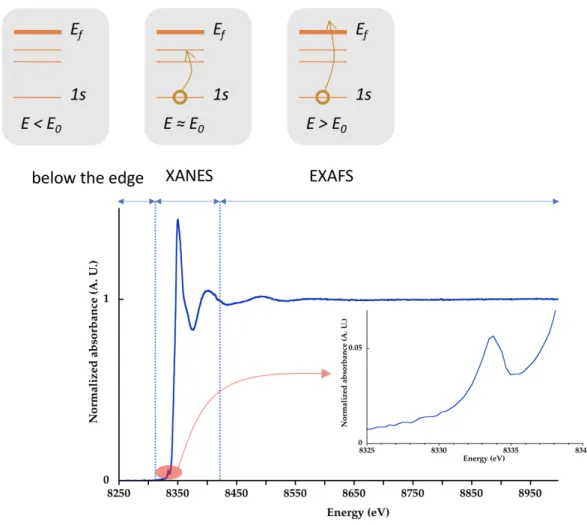
The absorption coefficient shows discontinuities, called edges, at discrete energies specific to each element, which are due to the absorption of the incoming photon through the photo-electric effect.
When the energy of the incident photon is smaller than the edge energy, E < E0 (figure 5, below
the edge), no absorption event can take place and only a monotonic decrease of the absorption coefficient is observed.
When E > E0 (figure 5), the energy of the photon is sufficient to promote an electronic transition
for the absorbing atom (absorber): a core level electron is ejected towards the first empty electronic states and then towards an unoccupied state located above the Fermi energy level, Ef (continuum). This creates a photoelectron, with a kinetic energy, 𝐸p = 𝐸 − 𝐸", that propagates as a spherical wave. The photoelectron mean free path, 𝜆(𝐸p), presents a minimum as a function of EC (figure 6). For low
kinetic energies (EC < 50 eV), the photoelectron has a long lifetime and a mean free path extending
over several tens of Å. It is then possible for the photoelectron to probe the medium range environment. This corresponds to the XANES (X-ray Absorption Near Edge Structure) region (see below). For high kinetic energies (EC > 50 Å), the photoelectron has a short life-time and it interacts
predominantly with its first neighbors (acting as scatterers), which corresponds to the EXAFS (Extended X-ray Absorption Fine Structure) region (see below). These two domains (XANES and EXAFS) are approximatively separated around 50 eV above the edge (figure 6).
Figure 6. Evolution of the photelectron mean free path as a function of the kinetic energy.
The energy position of an edge, E0, corresponds to the binding energies of electrons, which are
characteristics for a given element. K-, L1-, L2,3 -edges... indicate electronic transitions from a 1s, 2s,
2p orbitals to the continuum state. In a complex sample, it is thus possible to probe the environment around each element by tuning the energy to a specific edge.
Following a X-ray absorption event, the atom is left with a core hole, that is a vacancy in the initial electronic level, which is energetically unstable. This excited state rapidly relaxes, in typically ~1 fs:
- either by a higher-lying electron filling the core hole and the simultaneous emission of a fluorescence photon,
- or in a two electrons process (Auger emission). Two higher-lying electrons are implied: one fills the core hole and the other one is ejected in the continuum. This process dominates at low energies (< 2 keV).
3.2. Data acquisition
The usual acquisition mode to obtain the absorption coefficient µ is by measuring the incident intensity, I0, and the intensity transmitted through the sample, I (figure 7). The main constraint
concerns the sample thickness: it must be adapted according to the element, its concentration, the glass composition, and must be uniform. A good signal is typically obtained for concentration higher than 5 weight%. It is often useful to measure a reference using a second transmission detector.
The two deexcitation processes give values proportional to the absorption coefficient and they can be used experimentally to determine µ:
- fluorescence mode: the incident and fluorescence intensities are determined and 𝜇(𝐸) ∝ 𝐼t⁄ . This detection is advantageous for dilute species, down to 10 ppm, and is more surface 𝐼" dependent (~1 µm) than transmission that probes the bulk structure;
- total electron yield (TEY): this mode detects the current of emitted electrons in the Auger process. This is well suited for low-energy edges and thus for light elements with a concentration ~1 weight%. This is a surface method, typically ~100 Å, and problems of charging may be encountered for low-conducting samples.
Incident and transmitted intensities are usually detected by ionization chambers containing excited gas during the transmission of the beam. The fluorescence intensity is measured with different types of energy-resolving detectors (Si or Ge solid-state detectors, photoelectric diodes...). The acquisition of a XAS spectra can be obtained in few tens of milliseconds either using a dispersive energy set-up and a white incident beam or using a quick-EXAFS setup in a step by step measurement (scanning of the incident energy).
Figure 7. Drawing of a detection by a transmission and fluorescence mode.
The experimenter has to wonder which detection mode is required for its sample and its element of interest. The most important criteria is to optimize the signal to noise S/N ratio and to achieve an edge jump close to 1. Transmission is the most accurate method, giving the best S/N ratio and must be always favored. Fluorescence yield must be privileged for dilute species, large sample that cannot be damaged or thinned down to a desired thickness (e.g. cultural heritage sample, thin films). TEY is adapted to investigate surface or low-energy edges. Sample preparation and data reduction are clearly explained in “XAFS for everyone” by Calvin [41].
3.3. EXAFS
EXAFS region concerns the modulation in the absorption coefficient that is observed above the edge for non-isolated atoms. For an isolated atom (case of a monatomic gas), the absorption coefficient equals the atomic absorption coefficient, 𝜇(𝐸) = 𝜇"(𝐸), and exhibits a monotonic decay
above the edge E0. For an atom bonded to other atoms (case of a solid or liquid), the photoelectron
ejected by an absorber is scattered by the neighboring atoms and returns back to the absorber. The photoelectron backscattered wave function interferes with itself, giving oscillations (called fine structure) that are superimposed over µ0. This autointerference phenomenon is the signal of interest
as it depends on the electronic and geometrical environment around the absorber. The EXAFS region is arbitrarily chosen about 50 eV above the edge jump and extends typically over ~1000 eV.
The EXAFS signal C(k) is extracted with the following formula:
Χ(𝑘) =w(x)hwo(x)
∆wo(x) , (12)
where ∆𝜇" is the edge step and
𝑘 = z5{|(nhno)
ℏ~ , (13)
k(Å-1) is the photoelectron wavenumber and is thus equivalent to Q in a diffraction experiment.
me is the electron mass. 𝜇" is not measured but estimated by fitting a smooth spline function above
the edge. The procedure to extract the C(k) is explained in various books and reviews [41][42]. Due to the short electron mean free path, the EXAFS region is dominated by single scattering. In this approximation, the theoretical expression of the EXAFS signal is a sum of damped sinusoidal oscillations due to the scattering contributions from the various absorber-scatterer paths:
Χ(𝑘) = ∑ 𝐴> >(𝑘)𝑠𝑖𝑛 \2𝑘𝑅>+ 2𝛿>(𝑘)] 𝐴>(𝑘) = 𝑆"5 •xƒ‚ ‚~𝑓>(𝑘)𝑒𝑥𝑝Y−2𝜎> 5𝑘5Z𝑒𝑥𝑝 \h5ƒ‚ ‰(x)] , (14)
The sum is over the j shells of neighbors (or scattering paths) of the central absorbing atom. 𝑆"5
is a reduction factor (0.75-1.00) due to many body effects. 𝑓>(𝑘) and 𝛿>(𝑘) are scattering amplitude and phase shift functions that depend both of the absorber and the scatterer j. Thanks to these functions, the nature of the scatterer can be distinguished, an information which is not contained in a diffraction experiment. 𝑓>(𝑘) and 𝛿>(𝑘) are theoretically calculated by different programs such as FEFF [43], GNXAS [44] and EXCURVE [45]. The bond length between the absorber and its neighbor, 𝑅>, the coordination number, 𝑁>, and the Debye-waller factor, 𝜎>, are the structural parameters for the shell j that the experimenter wants to extract. The Debye-Waller factor includes the mean-square deviation of the absorber-scatterer distance due to thermal motion and static disorder. These different parameters are correlated and the fitting procedure must be taken with care. The average bond length, 𝑅>, is usually known with an accuracy ± 0.02 Å, while the error on the coordination number is more
severe (± 20%). Note that EXAFS gives average information: if an average four fold coordination is obtained, N=4, it is not possible to draw conclusions on the site geometry (tetrahedron or square planar for instance). However, such information on the site geometry can be deduced from the XANES region (see below). If the EXAFS equation is still used, ab initio EXAFS codes (FEFF, GNXAS) allow nowadays fitting the data routinely by using multiple scattering formulations.
After extracting the C(k) signal, a Fourier transform is performed to visualize a real space function. In figure 8, the EXAFS C(k) signal and its Fourier transform are obtained at Ti K-edge for a K2TiSi2O7 glass. The real space function is a pseudo-radial distribution function corresponding to
the sum of all the PPDFs associated with Ti (note that, due to the 𝛿>(𝑘) function, the apparent
distances are shifted towards lower r-values by 0.2-0.5 Å compared to the real distances) and, thereby, is similar to the first difference function obtained in a NDIS experiment (figure 2). Figure 8 compares the EXAFS and NDIS results in reciprocal and real space for Ti in K2TiSi2O7. The EXAFS signal is
cut at low-k values to avoid the XANES part dominated by multiple scattering effects. In consequence, the medium range ordering is difficult to probe by EXAFS and the information for glasses is usually limited to first and second neighbors. The k-range is also limited in a XAS experiment compared to NDIS, which also prevents high resolution in real space. This is illustrated in figure 8: the high resolution of a NDIS experiment allows the separation of two Ti-O distances that are merged and unresolved in the EXAFS real space function. The best resolution that can be achieved in an EXAFS experiment is Δ𝑅 ≥ 𝜋 2Δ𝑘⁄ , i.e. Δ𝑅 ≥ 0.13Å for a k-range up to 12 Å-1. Alternatively the
advantage of a XAS experiment compared to NDIS is to enable systematic investigation of glass systems, without requiring expensive isotopic enrichment, and allows various pressure/temperature/atmosphere equipments to be used.
Figure 8. Comparison of NDIS and EXAFS data for Ti in a K2TiSi2O7 glass: (a) Difference structure
factor obtained by neutron diffraction with Ti isotopic substitution, (b) corresponding Fourier transform, (c) EXAFS signal at Ti K-edge, (d) corresponding Fourier transform. EXAFS data are from [46] and NDIS from [47]. Note the different Q- and k-range for the reciprocal functions and the different r-range for the distribution functions.
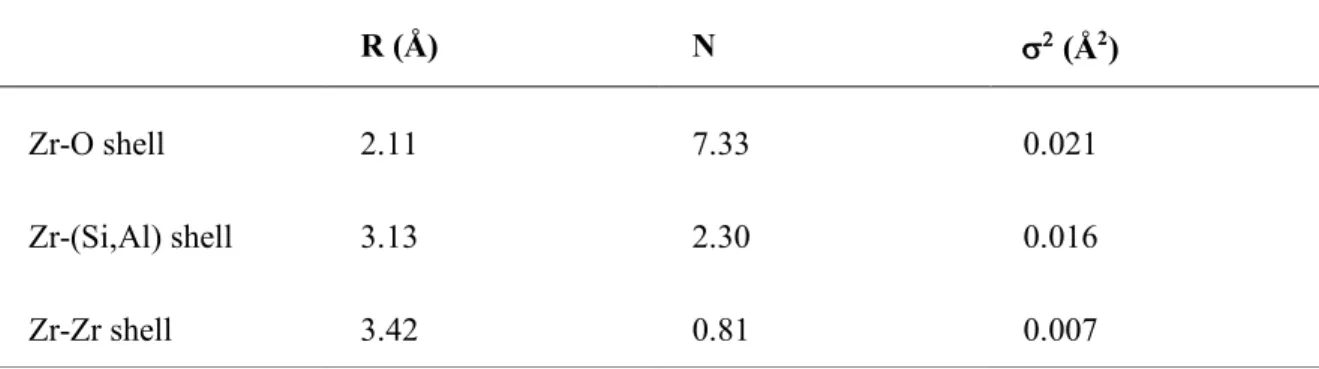
A quantitative analysis can be performed as illustrated in figure 9 and table 2 at Zr K-edge for an aluminosilicate glass. An average coordination number can be calculated allowing the determination of the Zr local site. Moreover, the nature and number of second neighbors can be determined, which give valuable information on the connectivity between the Zr polyhedral and the aluminosilicate network.
Figure 9. (Left) EXAFS signal and its GNXAS fit (top curves, exp and fit) at Zr K-edge from [48]. The lower curves are the decomposition of the fit in different shells. (Right) Model that can be deduced from the EXAFS analysis, indicating the ZrO7 polyhedra (in blue) connected together or
with the (Si,Al) polyhedra (in yellow).
Figure 10 illustrates another case at Mo K-edge for a simplified nuclear waste borosilicate glass. The peak can be fitted to give a M-O bond length of 1.78 Å with 4 O neighbors [49]. This is in agreement with Mo6+ in tetrahedral position. Contrary to Zr, no second neighbors can be detected.
The reason is that (MoO4)2- groups are not directly connected to the silicate network. The charge
compensation of this site is provided by alkali and alkaline-earths that form a loose shell of neighbors with a large distribution of distances; all these distances interfere destructively. Therefore, the lack of peak does not indicate the lack of neighbors but a large disorder in the second shell of neighbors. This environment is also consistent with the propensity of Mo to separate in alkali or alkaline-earth molybdate phases in silicate glasses.
Table 2. EXAFS-derived structural parameters for the Zr environment in magnesio-aluminosilicate glass (from [48]). Errors are CN ± 0.5, R ± 0.01 Å, Var. ± 0.03 Å2.
R (Å) N s2 (Å2)
Zr-O shell 2.11 7.33 0.021
Zr-(Si,Al) shell 3.13 2.30 0.016
Figure 10. (Left) EXAFS signal at Mo K-edge for a borosilicate glass [49]. (Right) Model for Mo environment that can be deduced from the EXAFS analysis.
An important result obtained over the years by EXAFS is that cation environment can be well defined in glasses. EXAFS has been used successfully to determine the local environment for almost all elements. Reviews are obtained and list the structural parameters for various cations [50][51]. Moreover, transition elements have usually low coordination number compared to usual coordination numbers observed in crystals. A review paper by Calas et al. describe the cation environment and their influence on the physico-chemical properties of glasses [52]. The example of colors of glasses illustrates this structure-composition-property relationships. Ni in silicate and borate glasses promotes various colorations that are directly explained by the Ni local environment and, optionally, the mixture of different sites.
3.4. XANES
The XANES domain starts at the edge and extend up to about 50 to 100 eV above the edge and exhibits usually a complex shape. It allows access to the local electronic properties (orbitals hybridization, crystal field, density of available electronic states) and structural arrangement (coordination, valence, medium range ordering up to ~8 Å). The EXAFS equation cannot be used in this region in which important multiple scattering phenomena can occur due to the large photoelectron mean free path. These multiple scattering pathways imply that three-dimensional information are contained in this region, contrary to two-dimensional information in EXAFS or diffraction methods. XANES can be analyzed using a fingerprint approach or theoretical calculations to reproduce the spectra.
In the fingerprint approach, the shape of the XANES spectrum from an unknown sample is compared with spectra from model compounds. This method gives only qualitative information on the local coordination but can be very successfully and straightforwardly applied. As an example, figure 11 shows the Zr L2,3-edges for an a lithium aluminosilicate glass (LAS) of unknown geometries
compared to crystalline references with Zr in different sites. A very simple comparison indicates that the shape of the spectra for the glass is similar to the reference spectra for Zr in octahedral environment. A similar fingerprint approach can also be used at Zr K-edge [53]. This qualitative determination of the site geometry can be further supported by an EXAFS analysis that confirms 6 O neighbors around Zr [54].
Figure 11. (a) Zr L3-edge and (b) L2-edge for crystalline references with different Zr environment
compared with a lithium aluminosilicate glass (LAS) for which Zr environment is not a priori known. Data adapted from [54].
The position of the edge can also give qualitative information on the valence state as there is a systematic shift in the edge towards higher energies as the considered cation becomes more oxidized. A quantitative interpretation of XANES is challenging since it includes single and multiple scattering effects. To progress in the understanding of XANES spectra and completely exploit this spectroscopy, it is necessary to go beyond the preliminary fingerprint step. The exploitation of the richness of the XANES spectrum requires its simulation from a theoretical model. This is very delicate in the case of glasses for which a precise representation of the structure at medium range distance is difficult to obtain. However, theoretical calculations have made enormous progress during
the last two decades and several codes are available to users to calculate XANES spectra. Two different methods can be distinguished [55].
(1) The ligand field multiplet (LFM) theory does not require the detailed structure but only the site symmetry, the crystal field effects due to the ligands and the atomic spin-orbit interactions of the photoabsorber. This is a semi-empirical model as multiplet calculations require the adjustment of a number of parameters by comparing calculated and experimental spectra (crystal field value, type and intensity of site distortion, value of the spin-orbit coupling …). This approach considers only localized orbitals for the final state and local symmetry in the real space. It is thus well suited to describe the L2,3-edges for 3d transition elements or M4,5 for rare earth elements.
(2) Contrary to the LFM theory which is multielectronic (all the electrons of the absorber are considered in the initial or excited state), several monoelectronic theories are developed and based on ab initio calculations. These theories consider extended final states which are more sensitive to the environment involving several shells of neighbors. The most used approach is the real space multiple scattering theory that calculates the electronic structure of a cluster around the absorbing atom. The requirement is to have a good structural model, which can be obtained by Molecular Dynamics simulation for a disordered sample. This method enables the development of popular codes: FEFF, FDMNES. Alternatively, band structure calculations based on the DFT (Density Functional Theory) can be used to calculate XANES spectra [56]. These calculations consider XANES as a probe of the projected density of unoccupied electronic states. This approach has been implemented in a package XSpectra [57] of the Quantum-Espresso code. A major difficulty is to accurately describe the final excited state to take into account many-body effects and relaxations due to the creation of the core-hole. Many-body Green’s function methods [58], including time-dependent DFT (TD-DFT), GW calculations and the Bethe-Salpeter equation, are still in developments to rigorously describe the excitations.
3.5. Pre-edge feature
Pre-edge transitions can be observed before the edge and arise from bound state transitions towards empty or partially filled atomic levels. For the first row transition metals, the 1s → 3d transition is theoretically prohibited for a K-edge according to the dipole selection rule. However 3d + 4p mixing and quadrupolar coupling can break this restriction and allows transition to occur. This pre-edge is highly sensitive to the site geometry. Its intensity increases as the site becomes more distorted from a centrosymmetric environment: intensity(tetrahedra) > intensity(square pyramid) > intensity(octahedra). The effect of symmetry can also give 1s → 4p transitions which can be intense for a square-planar geometry.
The pre-edge is obtained together with XANES measurement and provides a rapid, possibly quantitative, estimation of the coordination, site symmetry and valence state.
Chromium is an archetypical example how the pre-edge is related to the site geometry (figure 12). Cr3+ is located in octahedral centrosymmetric geometry with no p-d mixing. This yields very weak
pre-edge (quadrupolar) transitions. Cr6+ is in tetrahedral non-centrosymmetric symmetry that allows
important p-d mixing. A very intense pre-edge at 5993 eV, with an intensity almost similar to the K-edge jump, can be observed. The intensity of this pre-K-edge transition is thus very sensitive to Cr speciation and can be used to quantify the proportion of Cr6+ in glasses even in dilute content [59].
Figure 12. (a) Cr K-edge XANES spectra of Cr6+ and Cr3+ (adapted from [60]). (b) Cr K-edge
XANES spectra for glasses with different ratio Cr6+/Cr3+ (adapted from [59]).
Figure 13 shows the pre-edge XANES feature at the Ti K-edge for the K2TiSi2O7 glass. Its
position perfectly matches with that for fresnoite (Ba2TiSi2O8) in which Ti is five-fold coordinated in
a square based pyramid. The position is clearly different to a simple mixture of references with six-fold and four-six-fold coordinated Ti. The square based pyramid geometry agrees with the two Ti-O distances that can be found in a NDIS experiment (figure 2). This pre-edge is easily measured together with XANES providing straightforward determination of site geometry and this has been exploited by Farges et al. to systematically investigate the Ti environment in numerous silicate glasses [61].
Figure 13. (a) Ti K-edge XANES spectra for a K2TiSi2O7 glass an zoom on the pre-edge (insert).
(b) Ti K-edge pre-edge features for crystalline references with different Ti geometries: Ba2TiO4 = [4]Ti, fresnoite Ba
2TiSi2O8 = [5]Ti, benitoite BaTiSi3O9 = [6]Ti.
Iron in glasses is still a challenging problem since iron can be present in Fe2+ and Fe3+ oxidation
states and, for each case, four-fold, five-fold and six-fold coordination are possible, so that in total six different Fe states can be present with specific structural role and influence on the physico-chemical properties of oxide glasses. XAS is very efficient to determine the iron oxidation state: as emphasized in figure 14a, the pre-edge position is highly sensitive to the iron valence with a pre-edge near 7112.3 eV due to Fe2+ and a pre-edge near 7113.8 eV due to Fe3+. These two separate pre-edges
allow the quantitative estimation of Fe3+/SFe ratio in glasses. Usually, the pre-edge is extracted from
the main edge by a curve fitting (see Farges et al. for discussion on the correct choice of background [62]) and a simple linear combination of the two end members is used to determine intermediate states. This approach has been successfully applied to follow the redox evolution with the temperature (Figure 14b) or the kinetics of iron oxidation in a supercooled melt [63]. For complex natural glasses [64], such fitting procedure lead to about 90% confidence using Fe2+ augite glass and two references
for [4]Fe3+ and [6]Fe3+ (see figure 15), enabling to determine both the oxidation and geometry of the
Figure 14. (a) Fe K-edge XANES spectra for a reduced and oxidized pyroxene glass an zoom on the extracted pre-edge features (insert). (b) Evolution with temperature of the Fe oxidation state with the replacement of Fe2+ by Fe3+ at high temperature. Figures adapted from [63].
Figure 15. Fe K-edge XANES spectra for a volcanic glass, Erta’Ale, with a fit obtained by a linear combination of an Augite glass ([5]Fe2+) and two components for Fe3+. Adapted from [64].
However, the multiple coordination geometries can complicate the fitting procedure and the correctness of the result. A different approach has been proposed and developed by Farges and coworkers: it consists in systematic measurements of crystalline references with various environments that allows drawing a mapping as a function of the pre-edge position and its normalized height. Using such plots, domains are obtained for various cations, informing on the valence or
geometry. As examples, the domains for Ti, Ni and Fe environments for oxide glasses are plotted in figure 16. The pre-edge intensity decreases as the coordination increases and its position slightly shifts towards higher energy with increasing coordination number, except for Fe where the position depends only upon the valence state. The different coordination domains are determined from crystalline references. The information extracted for a glass (pre-edge position, intensity/area) are then positioned on this diagram to obtain a direct estimation of the coordination/redox.
Figure 16. Plots of the pre-edge information (normalized height or integrated intensity vs energy position) for K pre-edge features in crystalline references showing domains for fourfold, fivefold and sixfold coordination for Ti4+ [46], Ni2+ [65] and Fe2+/Fe3+ [62].
4. Summary
In this chapter, the fundamental concepts of neutron/X-ray diffraction and X-ray absorption spectroscopy have been introduced. These structural techniques are complementary as they focus on different information. A comparison of the contributions brought by each method is summarized in Table 3. They are widely accessible on large facilities (synchrotron, neutron source) though proposal evaluation, which usually required preliminary investigation and/or a careful preparation of the experiment. Developments of new neutron sources and upgrade of synchrotrons will offer new opportunities, allowing specialized environments to be used for extreme conditions of pressure and/or temperature or controlled atmosphere and providing the opportunity for X-ray absorption spectroscopy to reach higher spatial resolution (currently down to ~20-30 nm) to investigate heterogeneous samples and better time resolution (currently ~10ms) to elucidate kinetics phenomena. These major and versatile experimental tools remain essential for structural determination and give invaluable information on the structure of disordered materials.
Table 3. Comparison of the structural information that can be obtained from diffraction, NDIS/AXRD and X-ray absorption spectroscopy.
Diffraction NDIS/AXRD EXAFS XANES Pre-edge
1D PDF (all atomic pairs) 1D PDF (centered on one specific element) 1D PDF (centered on one specific element) Element selectivity Element selectivity Element selectivity Element selectivity Short range order +++ Short range order +++ Short range order ++ Short range order + Short range order +++ Medium range order +++ Medium range order +++ Medium range order + Medium range order ++ Interatomic distances Interatomic distances Interatomic distances
Coordination Coordination Coordination Coordination, site geometry Coordination, site geometry Types of ligands 3-body correlations
Oxidation state Oxidation state
Electronic structure
Electronic structure
References
1. W.H. Zachariasen, The atomic arrangement in glass. J. Am. Ceram. Soc., 54 (1932)
3841-3851.
2. B.E. Warren, The diffraction of X-rays in glass. Phys. Rev. B., 45 (1934) 657-661.
3. B.E. Warren and J. Biscoe, Fourier analysis of X-ray patterns of soda-silica glass. J. Am.
Ceram. Soc., 21 (1938) 259-265.
4. H.E. Fischer, A.C. Barnes and P.S. Salmon, Neutron and x-ray diffraction studies of
liquids and glasses. Rep. Prog. Phys., 69 (2006) 233-299.
5. P. Chieux, Liquid structure investigation by neutron scattering, in: H. Dachs (Ed.),
Neutron Diffr., Springer-Verlag, Berlin, 1978.
6. G.L. Squires, Introduction to the theory of thermal neutron scattering, Cambridge
University Press, Cambridge, 1978.
7. A.C. Wright, The structure of amorphous solids by X-ray and neutron diffraction, in:
Adv. Struct. Res. Diffr. Methods, Pergamon Press, 1974, pp. 1-84.
8. D.A. Keen, A comparison of various commonly used correlation functions for describing
total scattering. J. Appl. Cryst., 34 (2001) 172-175.
9. P.H. Gaskell, A. Saeed, P. Chieux and D.R. McKenzie, Neutron-scattering studies of the
structure of highly tetrahedral amorphous diamondlike carbon. Phys. Rev. Lett., 67 (1991)
1286-1289.
10. T.E. Faber and J.M. Ziman, A theory of the electrical properties of liquid metals III. The
resistivity of binary alloys. Phil. Mag., 11 (1965) 153-157.
11. V. Petkov, S.J.L. Billinge, S.D. Shastri and B. Himmel, Polyhedral units and network
connectivity in calcium aluminosilicate glasses from high-energy X-ray diffraction. Phys.
Rev. Lett., 85 (2000) 3436–3439.
12. U. Hoppe, G. Walter, R. Kranold and D. Stachel, Structural specifics of phosphate
glasses probed by diffraction methods: a review. J. Non-Cryst. Solids, 263&264 (2000)
29-47.
13. J. Swenson, A. Matic, C. Karlsson, L. Börjesson, C. Meneghini and W.S. Howells,
Random ion distribution model: A structural approach to the mixed-alkali effect in glasses.
Phys. Rev. B, 63 (2001) 132202.
14. J. Swenson, A. Matic, C. Gejke, L. Börjesson, W.S. Howells and M.J. Capitan,
Conductivity enhancement in PbI
2-AgI-AgPO
3glasses by diffraction experiments and
reverse Monte Carlo modeling. Phys. Rev. B, 60 (1999) 12023-12032.
15. A.C. Wright, Neutron scattering from vitreous silica. V. The structure of vitreous silica:
What have we learned from 60 years of diffraction studies?. J. Non-Cryst. Solids, 179 (1994)
84-115.
16. R.A. Martin, P.S. Salmon, H.E. Fischer and G.J. Cuello, Structure of dysprosium and
holmium phosphate glasses by the method of isomorphic substitution in neutron diffraction.
J. Phys. Condens. Matter, 15 (2003) 8235-8252.
17. L. Cormier, P.H. Gaskell, G. Calas and A.K. Soper, Medium range order around titanium
in a silicate glass studied by neutron diffraction with isotopic substitution. Phys. Rev. B, 58
(1998) 11322-11330.
18. F. Farges, G.E. Brown Jr., A. Navrotsky, H. Gan and J.J. Rehr, Coordination chemistry
of Ti(IV) in silicate glasses and melts. II. Glasses at ambient temperature and pressure.
Geochim. Cosmochim. Acta, 60 (1996) 3039-3053.
19. I. Petri, P.S. Salmon and H.E. Fischer, Defects in a disordered world: the structure of
glassy GeSe
2. Phys. Rev. Lett., 84 (2000) 2413-2416.
20. P.S. Salmon and I. Petri, Structure of glassy and liquid GeSe
2. J. Phys. Condens. Matter,
15 (2003) S1509.
21. P.H. Gaskell, M.C. Eckersley, A.C. Barnes and P. Chieux, Medium-range order in the
cation distribution of a calcium silicate glass. Nature, 350 (1991) 675-677.
22. G.N. Greaves and S. Sen, Inorganic glasses, glass-forming liquids and amorphizing
solids. Adv. Phys., 56 (2007) 1-166.
23. L. Cormier, L. Galoisy, J.-M. Delaye, D. Ghaleb and G. Calas, Short- and medium-range
structural order around cations in glasses: a multidisciplinary approach. CR Acad. Sci. Sér.
IV, 2 (2001) 249-262.
24. A.C. Wright, A.C. Hannon, R.N. Sinclair, W.L. Johnson and M. Atzmon, The neutron
diffraction double-null isotopic substitution technique. J. Phys. F Met. Phys., 14 (1984)
L201-L205.
25. P.H. Fuoss and A. Bienenstock, X-ray anomalous scattering factors - measurements and
applications, in: Inn.-Shell X-Ray Phys. At. Solids, Plenum, D.J. Fabian, A. Kleinpoppen,
L.M. Watson, New-York, 1981, pp. 875-884.
26. S. Kohara, H. Tajiri, C.H. Song, K. Ohara, L. Temleitner, K. Sugimito, A. Fujiwara, L.
Pusztai, T. Usuki, S. Hosokawa, Y. Benino, N. Kitamura and K. Fukumi, Anomalous x-ray
scattering studies of functional disordered materials. J. Phys. Conf. Ser., 502 (2014) 012014.
27. H. Schlenz, A. Kirfel, K. Schulmeister, N. Wartner, W. Mader, W. Raberg, K. Wandelt,
C. Oligschleger, S. Bender, R. Franke, J. Hormes, W. Hoffbauer, V. Lansmann, M. Jansen,
N. Zotov, C. Marian, H. Putz and J. Neuefeind, Structure analyses of Ba-silicate glasses. J.
Non-Cryst. Solids, 297 (2001) 37-54.
28. A.C. Wright, J.M. Cole, R.J. Newport, C.E. Fisher, S.J. Clarke, R.N. Sinclair, H.E.
Fischer and G.J. Cuello, The neutron diffraction anomalous dispersion technique and its
application to vitreous Sm
2O
3·4P
2O
5. Nucl. Instrum. Methods Phys. Res. A, 571 (2007)
622-635.
29. S. Hosokawa, I. Oh, M. Sakurai, W.-C. Pilgrim, N. Boudet, J.-F. Bérar and S. Kohara,
Anomalous x-ray scattering study of Ge
xSe
1-xglassy alloys across the stiffness transition
composition. Phys. Rev. B, 84 (2011) 014201.
30. R.L. McGreevy, RMC - Progress, problems and prospects. Nucl. Instrum. Methods Phys.
Res. A., 354 (1995) 1-16.
31. R.L. Mc Greevy and P. Zetterström, Reverse Monte Carlo modelling of network glasses:
useful or useless ?. J. Non-Cryst. Solids, 293-295 (2001) 297-303.
32. D. Miracle, A structural model for metallic glasses. Nature Mater., 3 (2004) 697-702.
33. H.W. Sheng, W.K. Luo, F.M. Alamgir, J.M. Bai and E. Ma, Atomic packing and
short-to-medium-range order in metallic glasses. Nature, 439 (2006) 419-425.
34. J. Hwang, Z.H. Melgarejo, Y.E. Kalay, I. Kalay, M.J. Kramer, D.S. Stone and P.M.
Voyles, Nanoscale structure and structural relaxation in Zr
50Cu
45A
l5bulk metallic glass.
Phys. Rev. Lett., (2012) 195505.
approach using empirical potential structure refinement. Phys. Rev. B, 72 (2005) 104204.
36. J.L. Finney, A. Hallbrucker, I. Kohl, A.K. Soper and D.T. Bowron, Structures of high
and low density amorphous ice by neutron diffraction. Phys. Rev. Lett., 88 (2002) 225503.
37. C. Weigel, L. Cormier, G. Calas, L. Galoisy and D.T. Bowron, Intermediate-range order
in the silicate network glasses NaFe
xAl
1-xSi
2O
6(x=0, 0.5, 0.8, 1): a neutron diffraction and
empirical potential structure refinement modeling investigation. Phys. Rev. B, 78 (2008)
064202.
38. G.N. Greaves, EXAFS and the structure of glass. J. Non-Cryst. Solids, 71 (1985)
203-217.
39. G.N. Greaves, A. Fontaine, P. Lagarde, D. Raoux and S.J. Gurman, Local structure of
silicate glasses. Nature, 293 (1981) 611-616.
40. J. Petiau and G. Calas, Local structures about some transition elements in oxide glasses
using X-ray absorption spectroscopy. J. Phys., 43 (1982) C9-47-C9-50.
41. S. Calvin and K.E. Furst, XAFS for everyone, CRC Press, Boca Raton, 2013.
42. A. Gaur, B.D. Shrivastava and H.L. Nigam, X-Ray Absorption Fine Structure (XAFS)
Spectroscopy – A Review. Proc. Indian Natn. Sci. Acad., 79 (n.d.) 921-966.
43. J.J. Rehr, J. Mustre de Leon, S.I. Zabinski and R.C. Albers, Theoretical X-ray absorption
fine structure standards. J. Am. Chem. Soc., 113 (1991) 5135-5140.
44. A. Filipponi and A. Di Cicco, X-ray absorption spectroscopy and n-body distribution
functions in condensed matter. I. Theory. Phys. Rev. B, 52 (1995) 15122-15134.
45. N. Binstead, J.W. Campbell, S.J. Gurman and P.C. Stephenson, The Excurve Programs,
Daresbury Laboratory, 1991.
46. F. Farges, G.E. Brown, A. Navrotsky, H. Gan and J.J. Rehr, Coordination chemistry of
Ti(IV) in silicate glasses and melts: II. Glasses at ambient temperature and pressure.
Geochim. Cosmochim. Acta, 60 (1996) 3039-3053.
47. L. Cormier, P.H. Gaskell, G. Calas and A.K. Soper, Medium-range order around
titanium in a silicate glass studied by neutron diffraction with isotopic substitution. Phys.
Rev. B, 58 (1998) 11322-11330.
Olivi, Structural role of Zr
4+as a nucleating agent in a MgO-Al
2
O
3-SiO
2glass-ceramics: A
combined XAS and HRTEM approach. J. Non-Cryst. Solids, 356 (2010) 2928-2934.
49. G. Calas, M. Le Grand, L. Galoisy and D. Ghaleb, Structural role of molybdenum in
nuclear glasses: an EXAFS study. J. Nucl. Mater., 322 (2003) 15-20.
50. G. Calas, L. Galoisy, L. Cormier, G. Ferlat and G. Lelong, The structural properties of
cations in nuclear glasses. Procedia Mater. Sci., 7 (2014) 23-31.
51. G.E. Brown Jr., F. Farges and G. Calas, X-ray scattering spectroscopic studies of silicate
melts. Rev. Miner., 32 (1995) 317-410.
52. G. Calas, L. Cormier, L. Galoisy and P. Jollivet, Structure-property relationships in
multicomponent oxide glasses. CR Chim., 5 (2002) 831-843.
53. L. Galoisy, E. Pellegrin, M.-A. Arrio, P. Ildefonse and G. Calas, Evidence for
6-coordinated zirconium in inactive nuclear waste glasses. J. Am. Ceram. Soc., 82 (1999)
2219-2224.
54. L. Cormier, O. Dargaud, G. Calas, C. Jousseaume, S. Papin, N. Trcera and A. Cognigni,
Zr environment and nucleation role in aluminosilicate glasses. Mater. Chem. Phys., 152
(2015) 41-47.
55. D. Cabaret, Single-particle modeling of X-ray absorption near-edge structure:
Theoretical development and applications, HDR Thesis, Université Pierre et Marie Curie
(UPMC), 2012. http://www-ext.impmc.upmc.fr/~cabaret/memoireHDR_Cabaret.pdf.
56. M. Taillefumier, D. Cabaret, A.-M. Flank and F. Mauri, X-ray absorption near-edge
structure calculations with the pseudopotentials: Application to the K edge in diamond and
α-quartz. Phys. Rev. B, 66 (2002) 195107.
57. C. Gougoussis, M. Calandra, A.P. Seitsonen and F. Mauri, First-principles calculations
of x-ray absorption in a scheme based on ultrasoft pseudopotentials: From α -quartz to high-
Tc compounds. Phys. Rev. B, 80 (2009) 075102.
58. G. Onida, L. Reining and A. Rubio, Electronic excitations: density-functional versus
many-body Green’s-function approaches. Rev. Mod. Phys., 74 (2002) 601-659.
59. O. Villain, G. Calas, L. Galoisy and L. Cormier, XANES determination of chromium
oxidation states in glasses: comparison with optical absorption spectroscopy. J. Am. Ceram.
Soc., 90 (2007) 3578-3581.
60. M.L. Peterson, A.F. White, G.E. Brown and G.A. Parks, Surface passivation of
magnetite by reaction with aqueous Cr(VI): XAFS and TEM results. Environ. Sci. Technol.,
31 (1997) 1573-1576.
61. F. Farges, G.E. Brown Jr., A. Navrotsky, H. Gan and J.J. Rehr, Coordination chemistry
of Ti(IV) in silicate glasses and melts: II. Glasses at ambient temperature and pressure.
Geochim. Cosmochim. Acta, 60 (1996) 3039-3053.
62. F. Farges, Y. Lefrère, S. Rossano, A. Berthereau, G. Calas and G.E. Brown, The effect
of redox state on the local structural environment of iron in silicate glasses: a combined
XAFS spectroscopy, molecular dynamics, and bond valence study. J. Non-Cryst. Solids, 344
(2004) 176-188.
63. V. Magnien, D.R. Neuville, L. Cormier, B.O. Mysen, V. Briois, S. Belin, O. Pinet and
P. Richet, Kinetics of iron oxidation in silicate melts: a preliminary XANES study. Chem.
Geol., 213 (2004) 253-263.
64. L. Galoisy, G. Calas and M.-A. Arrio, High-resolution XANES spectra of iron in
minerals and glasses: structural information from the pre-edge region. Chem. Geol., 174
(2001) 307-319.
65. F. Farges, G.E. Brown, F. Farges, G. Calas, P.-E. Petit and M. Munoz, Transition
elements in water-bearing silicate glasses/melts. Part I. A high-resolution and anharmonic
analysis of Ni coordination environments in crystals, glasses, and melts. Geochim.
Laurent Cormier, Dr., works for CNRS at IMPMC (Paris) since 1999 and leads the group “Properties of Amorphous, Liquids and Minerals” since 2013. He collaborates with the ICG since 2012 being member of the TC07 (Crystallisation and Glass-ceramics) and TC26 (Structure and Vibrations) groups and gives lectures at the Montpellier Summer School since 2012. He co-organized several international conferences (“Non-Crystalline Materials” in 2011, “Physics of Non-Crystalline Solids” and “European Society of Glass conference” in 2018) and will be chairman of the “International Symposium on Crystallisation in glasses and liquids” organized by TC07 in 2020. He is advisory board of the French glass society (USTV) since 2012 and currently vice-president of USTV. He published more than 120 articles and books in the field of glass structure in relation with transport properties, nucleation and crystallization, using experimental and modelling techniques. He received the Gottardi prize by the ICG in 2007.


![Figure 10. (Left) EXAFS signal at Mo K-edge for a borosilicate glass [49]. (Right) Model for Mo environment that can be deduced from the EXAFS analysis](https://thumb-eu.123doks.com/thumbv2/123doknet/15016439.681369/20.892.140.773.118.386/figure-exafs-signal-borosilicate-right-environment-deduced-analysis.webp)
