HAL Id: hal-03025510
https://hal.archives-ouvertes.fr/hal-03025510
Submitted on 26 Nov 2020HAL is a multi-disciplinary open access archive for the deposit and dissemination of sci-entific research documents, whether they are pub-lished or not. The documents may come from teaching and research institutions in France or abroad, or from public or private research centers.
L’archive ouverte pluridisciplinaire HAL, est destinée au dépôt et à la diffusion de documents scientifiques de niveau recherche, publiés ou non, émanant des établissements d’enseignement et de recherche français ou étrangers, des laboratoires publics ou privés.
Metformin lowers glucose 6-phosphate in hepatocytes by
activation of glycolysis downstream of glucose
phosphorylation
Tabassum Moonira, Shruti Chachra, Brian Ford, Silvia Marin, Ahmed
Alshawi, Natasha Adam-Primus, Catherine Arden, Ziad Al-Oanzi, Marc
Foretz, Benoit Viollet, et al.
To cite this version:
Tabassum Moonira, Shruti Chachra, Brian Ford, Silvia Marin, Ahmed Alshawi, et al.. Metformin lowers glucose 6-phosphate in hepatocytes by activation of glycolysis downstream of glucose phospho-rylation. Journal of Biological Chemistry, American Society for Biochemistry and Molecular Biology, 2020, 295 (10), pp.3330 - 3346. �10.1074/jbc.ra120.012533�. �hal-03025510�
1
Metformin lowers glucose 6-phosphate in hepatocytes by activation of glycolysis downstream of glucose phosphorylation
Tabassum Moonira1, Shruti S. Chachra1, Brian E. Ford1, Silvia Marin2,3, Ahmed Alshawi1#, Natasha S.
Adam-Primus1, Catherine Arden1, Ziad H Al-Oanzi1##, Marc Foretz4,5,6; Benoit Viollet4.5,6, Marta Cascante2,3,
Loranne Agius1*
From the 1Biosciences Institute, Newcastle University, Medical School, Newcastle upon Tyne NE2 4HH, UK; 2Department of Biochemistry and Molecular Biomedicine, Faculty of Biology, Universitat de Barcelona,
Barcelona, Spain; 3CIBEREHD and metabolomics node at INB-Bioinformatics Platform, Instituto de Salud
Carlos III (ISCIII), Madrid, Spain; 4INSERM, U1016, Institut Cochin, Paris 75014, France; 5CNRS,
UMR8104, Paris 75014, France; 6Université Paris Descartes, Sorbonne Paris Cité, Paris 75014, France.
Running title: Metformin lowers glu
cose 6-phosphate in hepatocytes
#Present address: Medical Laboratory Technique Department, Kufa Institute, Al-Furat Al-Awsat Technical University, Kufa, Iraq
##Present address: Jouf University, Medical Laboratory Science, POB 2014, Sakaka, Saudi Arabia
*To whom correspondence should be addressed: Loranne Agius, Biosciences Institute, Newcastle University, Medical School, Newcastle upon Tyne, NE2 4HH, UK; [email protected]; Tel +441912087033. Keywords: liver, metformin, glucose 6-phosphate, glycolysis, phosphofructokinase-1
ABSTRACT
The chronic effects of metformin on liver gluconeogenesis involve repression of the G6pc gene, which is regulated by the Carbohydrate response element binding protein through raised cellular intermediates of glucose metabolism. In this study we determined the candidate mechanisms by which metformin lowers glucose 6-phosphate (G6P) in mouse and rat hepatocytes challenged with high glucose or gluconeogenic precursors. Cell metformin loads in the therapeutic range lowered cell G6P but not ATP and decreased G6pc mRNA at high glucose. The G6P lowering by metformin was mimicked by a Complex 1 inhibitor (rotenone), an uncoupler (dinitrophenol) and by overexpression of mGPDH, which lowers glycerol 3-phosphate and G6P and also mimics the G6pc repression by metformin. In contrast, direct allosteric activators of AMPK (A-769662, 991, C13) had opposite effects from metformin on glycolysis, gluconeogenesis and cell G6P. The G6P lowering by metformin which also occurs in hepatocytes from AMPK-knock-out mice, is best explained by allosteric regulation of phosphofructokinase-1 (PFK-1) and/or fructose bisphosphatase-1, as supported by: increased metabolism of [3-3H]glucose relative to [2-3H]glucose; an increase in lactate m2/m1
isotopologue ratio from [1,2-13C
2]glucose, by
lowering of glycerol 3-phosphate an allosteric inhibitor of phosphofructokinase-1 and by marked G6P elevation by selective inhibition of phosphofructokinase-1 but not by a more reduced cytoplasmic NADH/NAD redox state. We conclude that therapeutically relevant doses of metformin lower G6P in hepatocytes challenged with high glucose by stimulation of glycolysis by an AMPK-independent mechanism through changes in allosteric effectors of PFK-1 and fructose bisphosphatase-1, including AMP, inorganic phosphate and glycerol 3-phosphate. Metformin is the most commonly prescribed drug for lowering blood glucose in Type 2 diabetes. Its therapeutic effect involves inhibition of glucose absorption by the gut and inhibition of glucose production by the liver (1). Evidence for the latter mechanism in man is largely derived from chronic studies demonstrating efficacy after 2-26 weeks therapy (2). Suppression of hepatic glucose production during chronic therapy may involve either acute inhibition of gluconeogenic flux or chronic changes in gene expression (3-5), with various arguments in support of the latter. One such argument is a lack of acute effect of
2
intravenously administered metformin on hepatic glucose production in man (6-8). Studies on metformin effects on gene expression in animal and cellular models have largely focused on mechanisms mediated by activation of AMPK (9). However repression by metformin of the G6pc gene, which encodes the enzyme catalysing the final reaction in hepatic glucose production, has also been observed in hepatocytes from AMPK-deficient mice (10). The G6pc gene is of particular interest because it was identified as a component of the metformin mechanism in both animal diabetes and in man by non-targeted approaches (11-13) and because G6pc is regulated by the transcription factor ChREBP (14) which is activated by raised cellular phosphorylated intermediates of glucose metabolism in conditions of raised blood glucose or compromised intracellular homeostasis resulting in raised glucose 6-phosphate, G6P (14-17). ChREBP recruitment to the G6pc gene promoter is inhibited by metformin in association with lowering of cell G6P and fructose 2,6-P2 (18).
Although G6P lowering by metformin has been shown in liver in vivo (19) and in isolated hepatocytes (18-21), the underlying mechanisms remain unsettled. The aim of this study was to identify the mechanism(s) by which metformin levels corresponding to a therapeutic dose, lower G6P in hepatocytes. Such mechanisms are expected to contribute to G6pc repression by metformin (10,18). Various sets of evidence support lowering of G6P by increased glycolysis via allosteric effectors of phosphofructokinase-1. Results
Cell metformin accumulation
Intracellular accumulation of metformin is slower in hepatocytes than in liver in vivo (19,22). Mice given an intra-gastric load of 50mg/kg metformin attain a portal vein metformin concentration of 50-60 M and accumulate peak metformin levels in liver of 1-2nmol/mg protein within 30 min (22). Rat hepatocytes incubated with 100-200 M metformin accumulate cell loads of 1-2nmol/mg protein after 2h (18). Throughout this study on rat and mouse hepatocytes, we used a protocol comprising a 2h pre-incubation with metformin followed by 1h incubation with medium containing the substrates and the same metformin concentration as during the pre-incubation. Using this protocol the cell metformin content at the end of the 3h incubation with 100-200 M metformin
is 1-2 nmol/mg in mouse hepatocytes (Fig. 1A). This corresponds to an intracellular / extracellular metformin concentration ratio of ~5 (Fig. 1B). This data on mouse hepatocytes (Fig. 1AB) is similar to data on rat hepatocytes reported previously (18).
Metformin lowers cell G6P when raised with high glucose or gluconeogenic precursors
We determined the effects of metformin on cell G6P in rat or mouse hepatocytes incubated with either high glucose (25mM) or with dihydroxyacetone (DHA) which enters the glycolytic / gluconeogenic pathway at the level of triose phosphates or with xylitol which enters the pathway at triose phosphate and fructose 6-P (23). These experiments were performed without or with the chlorogenic acid derivative S4048 (24), which inhibits the G6P transporter (Slc37a4) on the endoplasmic reticulum. S4048 has no effect of G6P levels in hepatocytes incubated with 5mM glucose (Fig.1C) but it enhanced the elevation by high glucose (25mM) in rat hepatocytes (Fig. 1D) and mouse hepatocytes (Fig. 1E). The elevation in G6P by S4048 in hepatocytes and in vivo (24-26), supports the role of glucose 6-phosphatase in maintaining G6P homeostasis (16,17). Metformin did not lower G6P in hepatocytes incubated with 5mM glucose (Fig. 1C), but it lowered G6P dose-dependently in rat or mouse hepatocytes with 25mM glucose (Fig. 1D,E) and caused a greater fractional lowering when G6P was elevated by S4048 (Fig. 1F,G). Similarly metformin lowered G6P with both DHA (Fig. 1H) and xylitol (Fig. 1I). Cell ATP was decreased by 1mM metformin but not by ≤ 0.5mM metformin (Fig. 1J-N).
AMPK activators do not mimic metformin on glycolysis, gluconeogenesis or cell G6P
We next tested whether direct activators of AMPK (A-769662, 991 and C-13) mimic the metformin lowering of G6P with high glucose or DHA (Fig. 2). A-769662 and compound-991 bind to a discrete pocket between the α and β subunits of AMPK(27,28), whereas C-13 is a prodrug that is metabolised to an “AMP mimetic” that binds to the ϒ-regulatory subunit (29). A-769662 (20 µM) caused similar phosphorylation of the AMPK target ACC-S79 as 500µM metformin (Fig. 2A) and C13 and 991 at 3µM caused comparable phosphorylation as 20 µM A-769662 (Fig. 2B). With 25mM glucose, A-769662 increased G6P, 991 had no effect and C-13 caused a modest decrease compared with metformin (Fig. 2C) with negligible effect on ATP (Fig. 2D) but with
3
significant inhibition in the production of lactate and pyruvate unlike metformin (Fig. 2E). With DHA, the AMPK activators unlike metformin significantly raised G6P (Fig. 2F), with little effect on ATP (Fig. 2G) and A-769662 and C13 also increased glucose production (Fig. 2H). This indicates opposite effects of AMPK activators from metformin on glycolysis with high glucose and on gluconeogenesis from DHA and shows that the AMPK activators do not mimic the G6P lowering by metformin.
A-769662 does not mimic low metformin on G6pc and Gck expression at high glucose
We next tested whether A-769662 mimics metformin (≥ 0.2mM) on gene regulation at high glucose. For these experiments we used 45mM glucose to achieve G6P levels intermediate between 25mM glucose alone and 25mM glucose + S4048. High glucose caused repression of Gck (by 60%) and induction of G6pc and Pklr, by 5-fold and 3-5-fold, respectively (Fig. 2I-K). A-769662 caused similar Pklr repression as high metformin (Fig. 2K) but did not mimic the effect of 0.2mM metformin on either Gck or G6pc expression (Fig. 2I,J). This implicates AMPK-independent mechanisms for the counter-regulatory effects of low metformin on G6pc and Gck expression. Metformin lowers G6P in hepatocytes from AMPK-KO mice
To test for involvement of AMPK in the metformin mechanism on G6P we used hepatocytes from liver-specific AMPKα1α2 knock-out mice. We confirmed lack of immunoactivity to AMPKα in hepatocytes from AMPKα1lox/lox,α2lox/lox –Alfp-Cre (AMPK-KO)
compared with the AMPKα1lox/lox,α2lox/lox controls
(Fig. 3A) and also lack of immunoactivity to phospho-AMPKα after challenge with metformin or A-769662 (Fig. 3B). To test whether activation of AMPK by metformin is affected by raised G6P we compared phospho-AMPK immunoactivity in conditions of low and high G6P with 25mM glucose + S4048 in control hepatocytes from AMPKlox/lox mice. Phosphorylation of AMPK by
high metformin (0.5mM) and by A-769662 (10µM) was not attenuated by high glucose + S4048 compared with 5mM glucose (Fig. 3C). Hepatocytes from AMPK-KO mice had similar levels of cell ATP in control conditions without S4048 with either 25mM glucose (Fig. 3D,E) or with 5mM DHA (Fig. 3F,G) and similar elevation of G6P with S4048 at 25mM glucose or DHA (Fig. 3H-K) as control hepatocytes from AMPKlox/lox
mice. The AMPK-KO hepatocytes showed small but significant lowering of ATP with S4048 (Fig. 3 L,M) which is best explained by compromised ATP homeostasis in conditions of raised G6P. Metformin (0.2 and 0.5mM) caused similar or greater fractional lowering of G6P in AMPK-KO heptocytes with high glucose + S4048 or with DHA + S4048 as for AMPKlox/lox controls (Fig. 3
N,O). This indicates involvement of AMPK-independent mechanisms in the metformin lowering of G6P.
Rotenone, an uncoupler and an NNT inhibitor lower G6P
To test for mechanisms linked to mitochondrial function (Fig. 4A) we compared metformin with a Complex 1 inhibitor (rotenone), an uncoupler (dinitrophenol, DNP), and with berberine which causes mitochondrial depolarization similar to metformin (30). Rotenone, DNP and berberine caused comparable lowering of G6P as metformin (Fig. 4B), with negligible effect on ATP (Fig. 4C). To test whether the metformin mechanism is similar to that of rotenone or the uncoupler, we determined the metabolism of [U-14C]glucose to 14CO
2 as a measure of mitochondrial oxidation
(Fig. 4D). Glucose oxidation was inhibited by rotenone, as expected for a Complex I inhibitor which promotes an increase in NADH/NAD ratio and it was stimulated with DNP, consistent with dissipation of the proton gradient and increased electron transport. Metformin inhibited glucose oxidation at 500 M (Fig. 4D), consistent with inhibition of Complex I at this concentration (31). However, lower metformin concentrations had no effect on glucose oxidation (Fig. 4D). The similar lowering of G6P by rotenone and DNP which have opposite effects on substrate oxidation implicates the decrease in the mitochondrial proton gradient as a possible link to the G6P lowering. Mechanisms linked to the mitochondrial proton gradient include ATP synthase (Complex V) and nicotinamide nucleotide transhydrogenase (NNT), which generates NADPH from NADH, NADP and proton import (Fig. 4A). We next tested whether rhein (4,5-dihydroxyanthraquinone 2-carboxylic acid) an inhibitor of NNT (32) lowers G6P. Rhein (40µM) raised NADP, as expected (33) and lowered G6P in conditions of maintained ATP (Fig. 4E), suggesting a possible role for either NNT inhibition or for the raised NADP/NADPH ratio. Metformin raises NADP but NNT deletion does
4
To test for possible involvement of NNT activity or raised NADP in the G6P lowering effect of metformin we determined cell NADP in incubations with metformin and we also tested NH4+ (2mM) which raises NADP by consumption
of NADPH during urea synthesis (33,34). Cell NADP was higher at 5mM glucose than at 25mM glucose and was raised by NH4+ at low and high
glucose and by 500µM metformin at high glucose (Fig. 4F). NH4+ like metformin lowered G6P at
high glucose (Fig. 3G) with no effect on ATP (Fig. 4H). The raised NADP by metformin and the lowering of G6P by rhein and NH4+ which raise
NADP by different mechanisms (33,34), supports potential roles for compromised NNT activity or for the raised NADP/NADPH in the G6P lowering, for example by increased activity of the pentose pathway which uses G6P and NADP as substrates. To test for a role of NNT we determined the effects of metformin in hepatocytes from mice with a deletion in the NNT gene (35), (Fig. 4I). The lowering of G6P by metformin was similar in hepatocytes without or with a functional NNT gene (Fig. 4J,K). This indicates involvement of mechanisms other than NNT inhibition in the G6P depletion by metformin.
Changes in glucose phosphorylation or glycogen metabolism cannot explain the metformin lowering of G6P
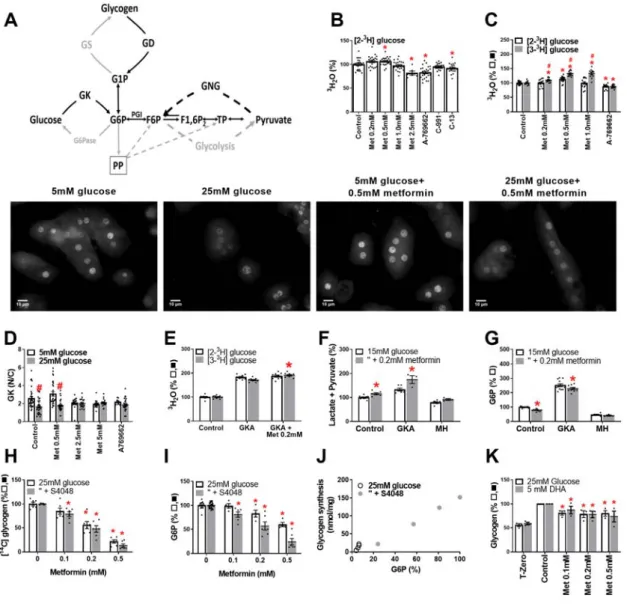
We tested which candidate metabolic pathways are involved in the metformin mechanism (Fig. 5A). Depletion of G6P may result from inhibition of G6P generating pathways (e.g. glucose phosphorylation, gluconeogenesis or glycogenolysis) or stimulation of G6P consuming pathways (glycogen synthesis, glycolysis or pentose pathway). We used [2-3H]glucose to
measure glucose phosphorylation and
[3-3H]glucose to determine G6P metabolism by
glycolysis and the pentose pathway. Glucose phosphorylation was modestly inhibited by A-769662 and C13 and by 2.5mM metformin but not by lower metformin (0.2-1mM) (Fig. 5B,C). Similarly glucokinase translocation by high glucose was inhibited by 2.5-5mM metformin but not by 0.5mM metformin (Fig. 5D). Detritiation of [3-3H]glucose (Fig. 5C, shaded bar) relative to [2-3H]glucose was increased by metformin
(0.2-1mM) indicating stimulation of glycolysis and/or pentose pathway after G6P formation.
In the presence of a glucokinase activator (GKA) to maximally activate endogenous glucokinase, low metformin also modestly increased
[3-3H]glucose metabolism (Fig. 5E) and formation of
lactate and pyruvate (Fig. 5F), whereas in the presence of mannoheptulose (MH), a glucokinase inhibitor the effects of metformin on pyruvate and lactate formation (Fig. 4F) and on G6P (Fig. 5G) were abolished. Cumulatively, this implicates metformin stimulation of G6P disposal by glycolysis and/or the pentose pathway downstream of glucose phosphorylation at endogenous or raised but not attenuated glucokinase activity.
Lowering of G6P can occur in conditions of stimulation of glycogen synthesis (36). We therefore tested the effects of metformin on glycogen synthesis (Fig. 5H). Metformin caused concentration-dependent inhibition of glycogen synthesis (Fig. 5H) and this correlated with the G6P lowering (r=0.99, Fig. 5I,J). Metformin also inhibited glycogen storage with 25mM glucose and DHA as substrates (Fig. 5K). G6P is a major regulator of glycogen synthesis (37). These results rule out a role for changes in glycogen metabolism as cause of G6P depletion but implicate the G6P lowering as the cause of the impaired glycogen synthesis.
Flux through glycolysis and the pentose pathway determined with [1,2-13C
2]glucose: converse
effects of metformin and AMPK activators
To test whether metformin increases flux through the pentose pathway we first used
[1-14C]glucose and [6-14C]glucose to estimate flux
from the difference in 14CO
2 formation ([1-14C]
minus [6-14C]glucose). However, decarboxylation
of [1-14C]glucose was lower than from [6-14C]glucose. This was not due to impurities in the
[1-14C]glucose but to lack of equilibration at the
triose phosphate isomerase step (38). This was confirmed from incubation with ethanol (39) which inhibited 14CO
2 formation from [6-14C]glucose but
not [1-14C]glucose (results not shown).
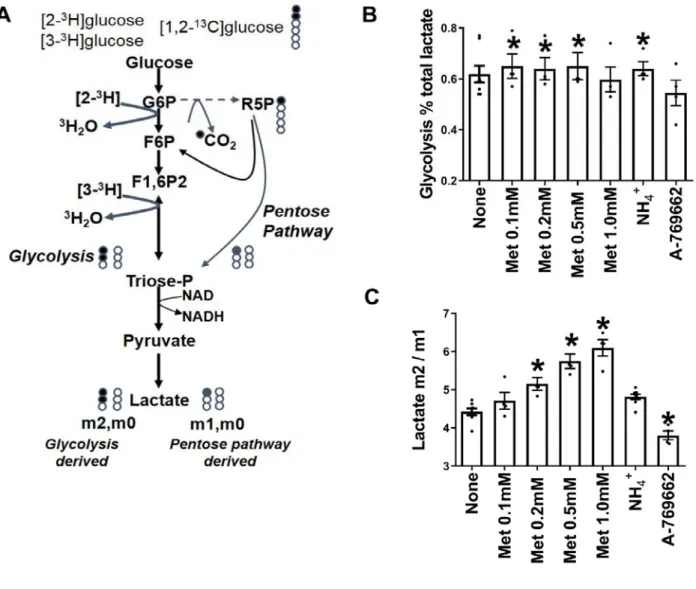
We next used [1,2-13C
2]glucose to measure
partitioning of flux between glycolysis (via PFK1) and the pentose pathway (via glucose 6-phosphate dehydrogenase) from 13C-lactate mass
isotopologues (m0, m1, m2), where m0 represents unlabelled lactate, and m1 and m2 represent lactate with one or two 13C atoms, respectively (Fig. 6A).
Metabolism of [1,2-13C
2]glucose by the pentose
pathway generates m1 and m0 lactate, while glycolysis generates m2 and m0 lactate. Pyruvate cycling in mitochondria would lead to conversion of m2 to m1. Incubations were performed with α-cyano-4-hydroxycinnamate and amino-oxyacetate to inhibit substrate entry into mitochondria as pyruvate or alanine (40) in medium without glutamine. We confirmed inhibition of entry of
5
glucose carbon into mitochondria from the lack of
13C incorporation into glutamate. The medium also
contained S4048 to prevent flux through glucose 6-phosphatase. Comparison of glucose isotopologues at the start and end of the incubation confirmed no change in 13C distribution in medium glucose. In
these conditions the ratio of m2/m1 lactate is a measure of the relative G6P flux by glycolysis (PFK1) versus pentose pathway (Fig. 6A). Metformin (100-500 µM) had two effects on 13
C-lactate mass isotopologue distribution. It increased the fraction of lactate derived from glucose (Fig. 6B) and it increased the m2/m1 ratio (Fig. 6C). The AMPK activator decreased the m2/m1 ratio (Fig. 6C). Cumulatively metformin stimulates glycolysis via PFK1 in absolute terms and relative to flux via the pentose pathway whereas the AMPK activator had the converse effect on the m2/m1 ratio. NH4+
(2mM) increased the fraction of lactate derived from glucose without changing the m2/m1 ratio indicating increased glycolysis and possibly also pentose pathway.
Modulation of cell G6P by inhibition of PFK-1 or FBP1 activity
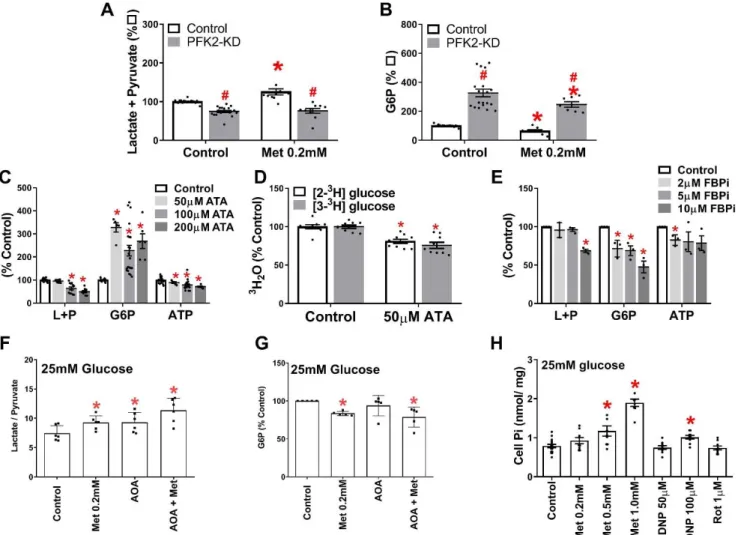
To identify candidate mechanisms for the G6P lowering we determined the effects of targeted inhibition of PFK1 or FBP1. We first expressed a kinase-deficient variant of the liver isoform (PFKFB1) of 6-phosphofructo-2-kinase / fructose-2,6-bisphosphatase (PFK2-KD) which functions as a constitutively active bisphosphatase and depletes fructose-2,6-P2 (14), an activator of PFK1 and
inhibitor of FBP1 (41). PFK2-KD caused modest (<20%) lowering of pyruvate + lactate formation (Fig. 7A) but raised G6P by ~3-fold (Fig. 7B). We next used the citrate analogue aurintricarboxylic acid (ATA), which is a potent inhibitor of PFK1 and antagonizes activation by fructose-2,6-P2 (42).
ATA caused concentration-dependent lowering of pyruvate and lactate formation and increased G6P by 3-fold also at the lowest concentrations tested (Fig. 7C). The lowest [ATA] tested (50µM) lowered metabolism of both [2-3H]glucose and [3-3H]glucose, by 23±3% and 32±2% respectively
(Fig 7D), with greater (P<0.05) fractional inhibition of [3-3H]glucose, consistent with
inactivation of PFK1 (42). An inhibitor of FBP1 caused concentration-dependent lowering of G6P but without increasing lactate and pyruvate production and with ATP lowering (Fig. 7E). Treatment with amino-oxyacetate (AOA) an inhibitor of the aspartate shuttle to inhibit transfer of NADH equivalents to mitochondria and thereby increase the cytoplasmic NADH/NAD (43) as
shown by the increase in lactate / pyruvate ratio (Fig. 7F) had no effect on cell G6P (Fig. 7G). This establishes that selective targeting of PFK1 and/or FBP1 but not targeting downstream glycolysis with an increase in cytoplasmic NADH/NAD redox state affects G6P levels.
Candidate effectors of PFK1- increased Pi.
The 3-fold increase in G6P with the PFK1 inhibitor (42) despite modest inhibition of pyruvate and lactate formation (Fig. 7C,D), suggests that allosteric effectors of PFK1 could account for the G6P lowering by metformin with concomitant increased glycolysis (Fig.2E,5C,E,F,6, 7A). Candidate PFK1 activators include AMP, Pi (inorganic phosphate), NH4+, fructose 2,6-P2 and
fructose 1,6-P2 and inhibitors include citrate and
G3P (41). Fructose 2,6-P2 is lowered by metformin
(18) and therefore cannot explain the increased glycolysis. Pi is a candidate effector because mitochondrial [Pi] is several fold higher than cytoplasmic Pi and uptake into mitochondria is by electrogenic transport (44). Accordingly mitochondrial depolarisation by low metformin (45) would be expected to increase cytoplasmic Pi. Total cell Pi was increased by high DNP (100 M) as expected (46) and by high (≥500 M) metformin (Fig. 7H). An increase in cytoplasmic Pi with negligible change in total cell Pi would be expected at lower metformin or DNP with more modest effects on the mitochondrial proton gradient.
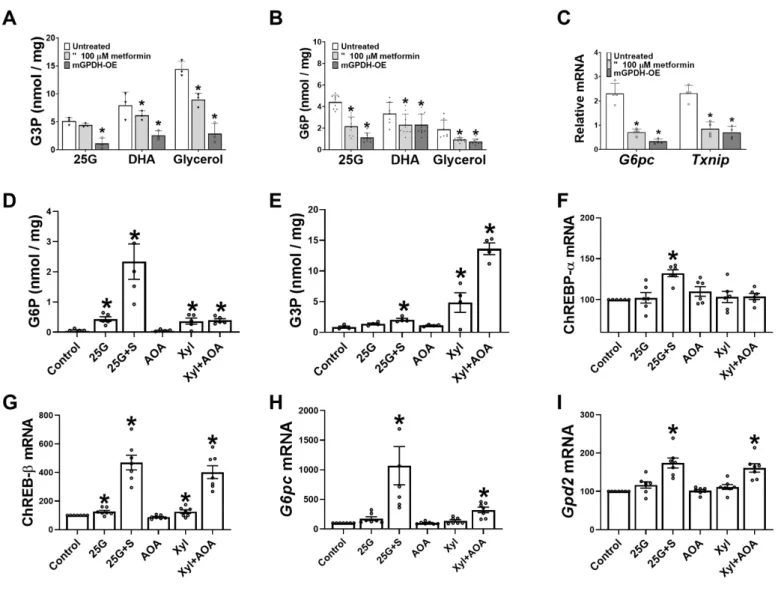
Roles of G3P and mGPDH activity in modulating cell G6P and G6pc expression
We showed previously (31) that metformin lowers G3P, a substrate for mGPDH and cGPDH and an inhibitor for PFK-1 (41), in conditions of gluconeogenic flux and proposed a role for the lower G3P in activation of PFK1 and inhibition of gluconeogenesis (31). Liver G3P represents the balance between formation from exogenous glycerol (via glycerokinase) and metabolism by cGPDH and mGPDH. Whereas cGPDH is present at high activity and catalyses the reversible interconversion of DHAP and G3P, mGPDH is present in low activity in liver and catalyses the irreversible oxidation of G3P to DHAP (47). We tested the hypothesis that selective lowering of G3P by mGPDH overexpression lowers G6P. Cells overexpressing mGPDH had lower G3P with 25mM glucose, DHA and glycerol as substrate (Fig. 8A) as expected (31), and they also had markedly lower G6P (Fig. 8B). Interestingly, overexpression of mGPDH attenuated the
6
induction of G6pc and Txnip mRNA by 25mM glucose, similarly to metformin (Fig. 8C). The Gpd2 gene encoding mGPDH was identified as a potential target for ChREBP in mouse liver (48). We tested whether Gpd2 is induced by raised G6P or G3P. Hepatocytes were incubated with either 25mM glucose -/+ S4048 to raise G6P or with the reduced substrate xylitol and without or with AOA to inhibit transfer of NADH equivalents from the cytoplasm and further raise G3P. The highest G6P elevation was with high glucose +S4048 (Fig. 8D) and the highest G3P was with xylitol +AOA (Fig. 8E). Expression of ChREBP-α was raised by 30% by high glucose +S4048 (Fig. 8F), whereas ChREBP-β (Fig. 8G) which is a sensitive marker of ChREBP activation (49) was increased by 5-fold and 4-fold, respectively by high G6P (25G+S) and by high G3P (xylitol + AOA) and was also significantly induced by moderate elevation in G6P and G3P with high glucose or xylitol without inhibitors, but not with AOA alone. This indicates activation of ChREBP-β by triose-P (G3P) as well as hexose-P (G6P). G6pc mRNA was induced to a greater extent by raised G6P in comparison with raised G3P (Fig. 8H), 10-fold vs 3-fold (P<0.05) whereas
Gpd2 mRNA was induced similarly (Fig. 8I) by
raised G3P (61% by Xyl+AOA) and by G6P (74% by 25G+S4048). This shows that the Gpd2 gene is induced by raised G6P and by G3P (Fig.8D,E,I), and that raised mGPDH activity attenuates the raised G3P and G6P by substrate challenge (Fig. 8AB) and similarly to metformin it attenuates G6pc induction by high glucose (Fig. 8C). This supports a role for the lower G6P and G3P in the metformin repression of G6pc.
Dinitrophenol and rotenone mimic the G3P lowering by metformin
We next explored the mechanisms for G3P lowering by metformin. In liver cells in the absence of exogenous glycerol, changes in cell G3P result mainly from changes in the cytoplasmic NADH/NAD redox state via the cGPDH equilibrium (Fig. 9A) or from changes in mGPDH activity, which transfers the electrons from G3P oxidation to the mitochondrial ubiquinone pool (Fig. 9A). Cell G3P was moderately raised by elevated glucose (15-25mM) and by 5mM DHA and was further raised by AOA, while ATP was unchanged (Fig. 9B,C). The increase by AOA is explained by the raised cytoplasmic NADH/NAD ratio (43) as shown by the raised lactate / pyruvate ratio (Fig.7F), which increases conversion of DHAP to G3P by cGPDH (Fig. 9A). The
uncoupler DNP, which stimulates mitochondrial pyruvate oxidation by dissipation of the mitochondrial proton gradient mimicked metformin and lowered G3P, with both DHA (Fig. 9DE) and 25mM glucose (Fig. 9F,G) irrespective of the presence of AOA, with no change in ATP. The DNP effect on G3P is consistent with a more oxidized ubiquinone redox state, by dissipation of the proton gradient. Rotenone (0.25-1 µM), an inhibitor of Complex 1, caused concentration-dependent lowering of G3P in the presence of AOA and more modest lowering of G3P at ≥ 0.5µM in the absence of AOA (Fig. 9H) with mild lowering of ATP at 1 µM rotenone (Fig. 9I). In the absence of AOA low rotenone (0.25 µM), raised lactate plus pyruvate production and the lactate / pyruvate ratio (Fig. 9JK), indicating a raised cytoplasmic NADH/NAD. The latter predicts G3P elevation via cGPDH. Accordingly, rotenone has opposite effect on G3P via cGPDH and mGPDH. In the presence of ethanol, which markedly raised cell G3P (Fig. 9L-O), as expected (50), the fractional lowering of G3P by DNP was increased from 40-70% to 70-85% (Fig. 9L vs 9F) and the lowering of G3P by rotenone was also increased (Fig. 9N vs 9H)). Metformin (100-200 µM) modestly lowered G3P in all conditions tested (Fig. 9D,F,L,N). Since metformin raises the lactate / pyruvate ratio (Fig. 7F), the metformin effect on G3P cannot be explained by the cytoplasmic NADH/NAD redox state and therefore indicates increased mGPDH activity. Cumulatively, G3P lowering by DNP, rotenone and metformin is best explained by a more oxidized mitochondrial ubiquinone redox state.
DISCUSSION
We show in this study that metformin lowers G6P in hepatocytes challenged with gluconeogenic precursors or high glucose by increased flux through glycolysis, downstream of G6P and not through effects on glucose phosphorylation or glycogen metabolism. This G6P lowering manifests over a wide range of cell metformin concentrations from the therapeutic range (1-2 nmol/mg cell protein) to 10-fold higher and is not mediated by AMPK-dependent mechanisms. It is a candidate mechanism for the repression of G6pc by low metformin in animal models of diabetes (12,13) and in hepatocytes from AMPK-deficient mice (10).
The induction of G6pc (encoding glucose 6-phosphatase) by high glucose is linked to raised metabolites of glucose rather than to glucose itself
7
via activation of the transcription factor ChREBP which binds to the liver G6pc gene promoter (14,15), and is explained by the adaptive role of glucose 6-phosphatase in maintaining cellular homeostasis of ATP and hexose phosphates (16,17). We show that Gpd2 (encoding mGPDH) which is a candidate target gene of ChREBP (48) is induced by raised phosphate esters in conditions of ChREBP-β induction. This indicates an analogous role for mGPDH as for glucose 6-phosphatase (G6pc) in cell phosphate ester homeostasis in conditions of glucose excess. We also show that overexpression of mGPDH attenuates the elevation in both hexose phosphate and triose phosphate and mimics the G6pc repression by metformin, thus supporting a role for lowering of phosphometabolites in the metformin mechanism on G6pc.
The metformin efficacy in G6P lowering manifests in conditions of raised intracellular metabolites as occurs with high glucose or gluconeogenic precursors and is further enhanced by the G6P transport inhibitor (S4048), which further enhances G6P elevation (24-26). The finding that the lowering of G6P by metformin was abolished with a glucokinase inhibitor which lowers G6P is of interest because metformin is known to be ineffective in MODY-diabetes linked to inactivating mutations in the GCK gene (51). This further supports a role for the G6P lowering in the therapeutic effect of metformin in type 2 diabetes (2).
In liver several metabolic pathways can contribute to the G6P lowering by metformin. G6P is generated by glucose phosphorylation, glycogen degradation and gluconeogenesis and metabolised by glycogen synthesis, glycolysis, pentose pathway and other minor pathways. We can firmly exclude inhibition of glucose phosphorylation because only very high metformin (> 1mM) inhibited glucose phosphorylation in association with ATP depletion. We also exclude metformin effects on glycogen metabolism (synthesis or degradation) as cause of the G6P lowering because metformin decreased rather than increased glycogen synthesis and storage, at all concentrations tested, in agreement with previous findings (52). G6P is a key activator of glycogen synthase (37) and inhibitor of glycogen phosphorylase (53). Accordingly, the correlation between G6P lowering and inhibition of glycogen synthesis with increasing metformin points to the decline in G6P as the primary mechanism with attenuation of glycogen synthesis, as secondary to G6P depletion, through partitioning towards
glycolysis. The pentose pathway uses G6P as substrate and generates NADPH. Flux through this pathway is determined by the NADP/NADPH ratio (54) and is increased when other pathways for NADPH production (such as NNT which is driven by the mitochondrial proton gradient) are compromised or when there is increased consumption of NADPH, for example by urea synthesis (34). We considered this pathway as a potential mechanism because metformin raised NADP and in addition, an NNT inhibitor and ammonium ion which raise NADP by different mechanisms, both lowered G6P. However, the data on NNT deficient hepatocytes indicates a mechanism independent of NNT and furthermore the depletion of G6P by NH4+ can be explained by
allosteric activation of PFK1 (41).
A role for activation of glycolysis at PFK1 by low metformin is supported by various sets of evidence. First, metabolism of [2-3H] and [3-3H]
glucose which measure respectively, glucose phosphorylation and G6P metabolism by glycolysis and/or pentose pathway showed higher stimulation by metformin of detritiation of
[3-3H]glucose compared with [2-3H]glucose. Second,
lactate isotopomers (m2/m1 ratio) from [1,2-13C]
glucose revealed both a relative increase in glycolysis versus pentose pathway and an absolute increase in glycolysis. Third, the citrate analogue (ATA) which is a potent inhibitor of PFK1 (42) caused 3-fold elevation in G6P despite modest inhibition of glycolysis, whereas targeting downstream glycolysis with a more reduced cytoplasmic NADH/NAD redox state had negligible effect on G6P. This cumulatively supports a role for allosteric regulation at a proximal site of glycolysis after hexose 6-P formation by targeting of PFK1 and / or FBP1.
FBP1 is inhibited by fructose-2,6-P2 and AMP,
whereas PFK1 is inhibited by citrate and G3P and activated by fructose 2,6-P2, AMP, Pi, NH4+ and
other effectors (41). Fructose 2,6-P2, which has a
major role in hepatic regulation of glycolysis by hormones and high glucose, can be excluded from the metformin mechanism on glycolysis and G6P because it is lowered by metformin (18). A somewhat analogous mechanism occurs in hepatocytes during anoxia which promotes glycolysis with concomitant lowering of fructose 2,6-P2 (55) but with raised AMP and lowered
citrate, which stimulate and inhibit PFK1, respectively (41,55). Candidate allosteric effectors to explain the stimulation of glycolysis by metformin include: raised AMP and cytoplasmic Pi and lowered citrate and G3P. A role for raised
8
AMP in the inhibition of gluconeogenesis by metformin was recently demonstrated using a knock-in mouse model for an AMP-insensitive variant of FBP1 (56). Metformin has been shown to lower citrate levels in a metabolomics study on the Zucker diabetic fatty rat (57) and to lower G3P in hepatocytes incubated with gluconeogenic precursors (31, 58). The lowering of G3P by metformin contrasts with the marked elevation during anoxia (55) and is best explained by mitochondrial depolarisation which favours increased flux through mGPDH.
Cytoplasmic G3P levels are determined by the cGDH equilibrium through changes in the NADH/NAD redox and by the activity of mGPDH which oxidizes cytoplasmic G3P by transfer of electrons to ubiquinone in the electron transport chain. mGPDH has low affinity for its substrate G3P (47), and thereby a minor role on cell G3P at low substrate when changes in cell G3P would predominantly reflect changes in the cytoplasmic NADH/NAD redox state through the cGDH equilibrium. Here we used high substrate or ethanol to raise G3P. Lowering of G3P by rotenone and metformin in conjunction with an increase in the lactate / pyruvate ratio which implicates an increase in the G3P/DHAP via the cGDH equilibrium indicates increased flux through mGPDH. The studies with the uncoupler support a role for mitochondrial depolarisation in lowering G3P and G6P and also raising cell Pi (an activator of PFK1). Cumulatively this supports multiple allosteric effectors including lower G3P and citrate (57), and raised Pi and AMP (56) in the metformin activation of PFK1. It does not exclude a role for the raised AMP causing inhibition of FBP1 as shown recently with a knock-in mouse model for an AMP-insensitive FBP1 variant (56).
Two widely studied mechanisms of metformin are the inhibition of Complex 1 (19,59-63) and the activation of AMPK (63,64). The latter can occur either by a “canonical pathway” downstream of inhibition of Complex 1 and consequent mitochondrial depolarisation resulting in compromised phosphorylation potential and thereby raised AMP or by a “non-canonical” pathway linked to sensing of fructose 1,6-P2
(65,66). Arguments in support of involvement of Complex 1 in activation of AMPK by the canonical pathway have been reviewed (63). The non-canonical pathway occurs in conditions of depletion of fructose 1,6-P2 which promotes
formation of an AMPK multi-protein complex at the lysosome comprising AXIN, LKB1, Ragulator, v-ATPase and aldolase functioning as the fructose
1,6-P2 sensor (65,66). We can exclude a role for
AMPK activation in the G6P lowering mechanism because metformin was equally effective in AMPK-KO hepatocytes. However, we cannot exclude involvement of other stress kinases like PKD and MK2 that may be activated through LKB1-independent mechanisms at high metformin (67). In this study high substrate challenge showed trends of lower AMPK phosphorylation basally and with low metformin (0.2mM) but enhanced AMPK phosphorylation with high metformin (0.5mM), indicating that raised hexose phosphates do not antagonize AMPK activation by the canonical pathway.
A key outstanding and contentious issue is whether inhibition of Complex 1 is involved the therapeutic effects of metformin (63,64). Inhibition of the oxygen consumption rate (19,59) or glucose (pyruvate) oxidation by high metformin are consistent with inhibition of Complex 1 and mimicked by rotenone. In this study we found inhibition of glucose oxidation by 0.5mM but not by 0.2mM metformin and this concurs with studies showing inhibition of oxygen consumption at ≥ 0.3mM metformin (68). Whereas high metformin (≥ 0.5mM) promotes a more reduced mitochondrial NADH/NAD ratio, consistent with Complex 1 inhibition (31), low metformin (≤ 0.2mM) promotes a more oxidized NADH/NAD ratio and increased beta-octanoate oxidation implicating increased electron transport (31). Nonetheless glucose (pyruvate) oxidation was unchanged at low metformin (0.2mM). We cannot exclude a role for targeting of Complex 1 by low metformin, whereby metformin causes uncoupling of proton pumping as proposed by Cameron and colleagues (62) and the consequent mitochondrial depolarisation favours increased electron transport and increased flux through mGPDH. Depolarisation of mitochondria by low metformin has been reported (45). Whether mechanisms independently of Complex 1 can explain such a depolarization remains speculative (31). Cumulatively, this study shows that the lowering of G6P in conditions of substrate challenge by metformin is mimicked by mitochondrial depolarisation with an uncoupler or by a Complex 1 inhibitor and that multiple allosteric effectors of PFK1 including lower G3P and raised Pi, as well as raised AMP (56) and lower citrate (57) can contribute to the increased disposal of G6P by glycolysis.
9
Reagents. A-769662 was from Tocris Biosciences; the AMPK activator C13 was from the Division of Signal Transduction Therapy, University of Dundee; compound 991 was synthesized by SpiroChem, Switzerland (69) ; the glucokinase activator (GKA), Ro28-1675 was from Axon MedChem BV, Groningen, Netherlands ; the FBP1 inhibitor, (5-chloro-2-[N-(2,5dichlorobenzenesulfonamide)] -benzoxazole (14) was from Calbiochem/Santa Cruz; S4048, (1- [2-(4-chloro-phenyl)-cyclopropylmethoxy]-3,4- dihydroxy-5-(3-imidazo[4,5-b]pyridin-1-yl-3-phenyl-acryloyloxy)-cyclohexanecarboxylic acid) was a kind gift from Sanofi-Aventis. All other reagents were from Sigma or Tocris Biosciences. Hepatocyte isolation and culture. Mice were housed in environmental conditions as outlined in the Home Office Code or Practice. All animal procedures conformed to Home Office Regulations and were approved by the Animal Welfare Ethics Review Board (AWERB) of the Newcastle University Ethics Committee. Hepatocytes were isolated from adult male Wistar rats (Envigo, Bicester, UK) and adult male mice, by collagenase perfusion of the liver (31). Unless otherwise indicated the mice were of the C57BL/6JOlaHSD strain (from Envigo, U.K.). For the experiments in Fig. 3 on liver AMPK-deficient mice, these were generated by crossing AMPKα1lox/lox,α2lox/lox mice
(control) against Alfp-Cre (albumin promoter with alfa-fetoprotein enhancer) to generate AMPKα1lox/lox,α2lox/lox –Alfp-Cre (AMPK-KO)
mice, as previously described (69). For experiments on Nnt-deficient mice the strain was C57BL/6J (35) from Charles River, UK. For the experiments in Figure Fig. 8, the mice were heterozygous for Pro446Leu substitution in the Gckr gene (70). The hepatocytes were suspended in Minimum Essential Medium containing 5% (v/v) new born calf serum and seeded on gelatin-coated (0.1%) multi-well plates, glass coverslips for immunostaining (18) or glass flasks for 14CO
2
entrapment. After cell attachment the medium was replaced by serum-free MEM medium containing 5mM glucose, 10nM dexamethasone, 1nM insulin and experiments were started after ~20h culture. For experiments involving enzyme overexpression the hepatocytes were incubated with adenoviral vectors for 4h after cell attachment. For overexpression of mouse mGPDH, the adenoviral vector (Ad-m-Gpd2, ADV-279685, 5 x10⁷
PFU/ml) was generated by Vector Biolabs Malvern, PA 19355. The vector for expression of a kinase-deficient bisphosphatase active variant
(S32D, T55V) of 6-phosphofructo-2-kinase– fructose-2,6-bisphosphatase, PFKFB1 denoted by PFK-KD was described in (14).
Hepatocyte incubations. After overnight culture hepatocytes were pre-incubated for 2h in MEM containing 5mM glucose and the concentrations of metformin and AMPK activators or enzyme inhibitors as indicated. The medium was then supplemented with glucose or gluconeogenic substrates and other additions as indicated or replaced by fresh medium with the additions including metformin at the same concentration as for the 2h pre-incubation and incubations were continued for 1h. Where indicated S4048 (G6P transport inhibitor) was used to raise cell G6P at a concentration of 0.2-2 µM.
Accumulation of 14C-metformin was as described
in (18) and metabolism of [U-14C]glucose to
glycogen and [2-3H], [3-3H]glucose to 3H
2O were
as described in (718). For [U-14C]glucose
oxidation cells were cultured in glass flasks and for the final incubation with [U-14C]glucose the flasks
contained a 2 ml tube and were sealed with rubber stoppers. The incubation was terminated by injection of HCl (0.2M final) to the flask and Hyamine 10X hydroxide (300 µl, Perkin Elmer) was injected into the 2ml tube to trap the 14CO
2
released by acidification of the medium. For determination of cell metabolites other than Pi the medium was aspirated on termination of the incubations and the hepatocyte monolayers in multi-well pates were snap frozen in liquid nitrogen and stored at -80oC until analysis. For
determination of cell ATP, G6P and G3P cells were extracted in 2.5% (wt/vol) sulphosalicylic acid and deproteinized and ATP, was determined by chemiluminescence and G3P and G6P fluorometrically (Ex 530nm, Em 590nm) as in (31). For NADP assay, cells were extracted in 0.6M HClO4 and after deproteinization and
neutralization (3M KOH/1M K2HPO4), NADP was
assayed fluorometrically (Ex 340, Em 450) with yeast glucose 6-phosphate dehydrogenase. For determination of inorganic phosphate on termination of the incubations the hepatocyte monolayers were rapidly washed 2 times with 300mM sucrose, 3 mM HEPES, pH 7.4 and extracted in 0.6M perchloric acid (4oC). The
extracts were centrifuged (9000g, 10min, 4oC) and
assayed immediately as described in (72). Pyruvate and lactate in the medium were determined by either absorbance (A340nm) or fluorometrically (Ex 340nm, Em 450nm) using lactate dehydrogenase as previously described (31).
10
Flux analysis from [1,2-13C
2]glucose.
Hepatocytes were incubated in MEM without glutamine, containing 15mM glucose with
[1,2-13C
2]glucose (50%), 2µM S4048, 0.4 mM
α-cyanocinnamate, 500 µM aminooxyacetate and other additions as indicated for 1h. The medium was collected at the start and end of the incubation and derivatized for CG-MS analysis of lactate, glucose and glutamate, as described in (70). Results of lactate mass isotopologues are expressed as fractional enrichment or m2/m1 ratio (73). Immunostaining and immunoblotting. Immunostaining for glucokinase in hepatocyte monolayers on glass coverslips was with a rabbit GK antibody (H-88, sc7908) as in (74). For immunoblotting hepatocytes were extracted in buffer containing 100mM KCl, 10mM EDTA, 20mM K2HPO4, 0.1% Triton X-100,
0.5mMPMSF, 0.5mM benzamidine, 1mM DTT, 1 µg/ml calyculin A, 0.1% protease inhibitor cocktail. Samples (20 µg protein) were resolved b y SDS-PAGE (90V for 15min, 180V for 45 min) and transferred onto PVDF membrane (Trans Blot SD semidry, 15V, 45 min). The membranes were probed for AMPKα and Phospho-AMPKα-Thr172 (New England Biolabs #2532; #2531), acetyl-CoA carboxylase-S79(P) (New England Biolabs #3661) and Gapdh (Hytest ABIN153387) and protein bands were visualized by enhanced chemiluminescence (Pierce) and exposure to medical film (Agfa Healthcare). Densitometry was imaged by Bio-Rad GS-800 Software.
mRNA analysis. RNA was extracted from the hepatocyte monolayers with Trizol (Invitrogen) and cDNA was synthesized from 1 µg RNA using M-MLV reverse transcriptase (Promega). Sybr-Green based real-time RT-PCR was performed using a Roche-480 Light Cycler in a volume of 10 µl containing 50 ng of reverse transcribed cDNA and 5 ng of forward and reverse primers for rat-Gck: for GATACCTGGGGAACAGCAAA, rev TAGGTGGAGACCCTGCTGAT; rat G6pc: for CTACCTTGCGGCTCACTTTC; rev
ATCCAAGTGCGAAACCAAAC; rat Pklr: for CTGGAACACCTCTGCCTTCTG; rev
CACAATTTCCACCTCCGACTC; mouse Nnt: for GGAAGGGTCAGTTGTTGTGG; rev CCGGCTTAGTCGTTTCAAAG; mouse Gapdh: for GACAATGAATACGGCTACAGCA; rev GGCCTCTCTTGCTCAGTGTC; mouse G6pc: for TGGTAGCCCTGTCTTTCTTT; rev
TCAGTTTCCAGCATTCACAC; mouse Txnip: for AACATCCCAGATACCCCAGA; rev GTGGGGCTCTCTAGTCTGTGA. mouse Gpd2: for ACTACCTGAGTTCTGACGTTGAAG; rev TAACAAGGGGACGGATACCA; mouse ChREBP-α: for CGACACTCACCCACCTCTTC; rev TTGTTCAGCCGGATCTTGTC; mouse ChREBP-β: for TCTGCAGATCGCGTGGAG; rev CTTGTCCCGGCATAGCAAC.
Statistical analysis. Results are expressed as means±SEM for the number of hepatocyte preparations indicated in the legends. Statistical analysis was by the Student’s t-test or by ANOVA.
Conflict of interest: The authors declare that they have no conflicts of interest with the contents of this article.
11
References
1. Bailey CJ. Metformin: historical overview. Diabetologia. 2017;60:1566-1576
2. Natali A, Ferrannini E. Effects of metformin and thiazolidinediones on suppression of hepatic glucose production and stimulation of glucose uptake in type 2 diabetes: a systematic review. Diabetologia. 2006;49:434-41
3. Rena G, Hardie DG, Pearson ER. The mechanisms of action of metformin. Diabetologia. 2017;60:1577-1585
4. Foretz M, Guigas B, Bertrand L, Pollak M, Viollet B. Metformin: from mechanisms of action to therapies.
Cell Metab. 2014;20:953-66
5. Baur JA, Birnbaum MJ. Control of gluconeogenesis by metformin: does redox trump energy charge? Cell
Metab. 2014;20:197-9
6. Bonora E, Cigolini M, Bosello O, Zancanaro C, Capretti L, Zavaroni I, Coscelli C, Butturini U. Lack of effect of intravenous metformin on plasma concentrations of glucose, insulin, C-peptide, glucagon and growth hormone in non-diabetic subjects. Curr Med Res Opin. 1984;9:47-51
7. Sum CF, Webster JM, Johnson AB, Catalano C, Cooper BG, Taylor R. The effect of intravenous metformin on glucose metabolism during hyperglycaemia in type 2 diabetes. Diabet Med. 1992;9:61-5 8. Christensen MM, Højlund K, Hother-Nielsen O, Stage TB, Damkier P, Beck-Nielsen H, Brøsen K.
Endogenous glucose production increases in response to metformin treatment in the glycogen-depleted state in humans: a randomised trial. Diabetologia. 2015;58:2494-502
9. He L, Wondisford FE. Metformin action: concentrations matter. Cell Metab. 2015;21:159-162.
10. Foretz M, Hébrard S, Leclerc J, Zarrinpashneh E, Soty M, Mithieux G, Sakamoto K, Andreelli F, Viollet B. Metformin inhibits hepatic gluconeogenesis in mice independently of the LKB1/AMPK pathway via a decrease in hepatic energy state. J Clin Invest. 2010;120:2355-69
11. Dawed AY, Ali A, Zhou K, Pearson ER, Franks PW. Evidence-based prioritisation and enrichment of genes interacting with metformin in type 2 diabetes. Diabetologia. 2017;6:2231-2239
12. Heishi M, Ichihara J, Teramoto R, Itakura Y, Hayashi K, Ishikawa H, Gomi H, Sakai J, Kanaoka M, Taiji M, Kimura T. Global gene expression analysis in liver of obese diabetic db/db mice treated with
metformin. Diabetologia. 2006;49:1647-55
13. Heishi M, Hayashi K, Ichihara J, Ishikawa H, Kawamura T, Kanaoka M, Taiji M, Kimura T. Comparison of gene expression changes induced by biguanides in db/db mice liver. J Toxicol Sci. 2008;33:339-47 14. Arden C, Tudhope SJ, Petrie JL, Al-Oanzi ZH, Cullen KS, Lange AJ, Towle HC, Agius L. Fructose
2,6-bisphosphate is essential for glucose-regulated gene transcription of glucose-6-phosphatase and other ChREBP target genes in hepatocytes. Biochem J. 2012;443:111-23
15. Ma L, Robinson LN, Towle HC. ChREBP*Mlx is the principal mediator of glucose-induced gene expression in the liver. J Biol Chem. 2006;281:28721-30
16. Agius L. Dietary carbohydrate and control of hepatic gene expression: mechanistic links from ATP and phosphate ester homeostasis to the carbohydrate-response element-binding protein. Proc Nutr Soc. 2016;75:10-18
17. Agius L. High-carbohydrate diets induce hepatic insulin resistance to protect the liver from substrate overload. Biochem Pharmacol. 2013;85:306-12
18. Al-Oanzi ZH, Fountana S, Moonira T, Tudhope SJ, Petrie JL, Alshawi A, Patman G, Arden C, Reeves HL, Agius L. Opposite effects of a glucokinase activator and metformin on glucose-regulated gene expression in hepatocytes. Diabetes Obes Metab. 2017;19:1078-1087
19. Owen MR, Doran E, Halestrap AP. Evidence that metformin exerts its anti-diabetic effects through inhibition of complex 1 of the mitochondrial respiratory chain. Biochem J. 2000;348:607-14
20. Guigas B, Bertrand L, Taleux N, Foretz M, Wiernsperger N, Vertommen D, Andreelli F, Viollet B, Hue L. 5-Aminoimidazole-4-carboxamide-1-beta-D-ribofuranoside and metformin inhibit hepatic glucose phosphorylation by an AMP-activated protein kinase-independent effect on glucokinase translocation.
Diabetes. 2006;55:865-74
21. Fulgencio JP, Kohl C, Girard J, Pégorier JP. Effect of metformin on fatty acid and glucose metabolism in freshly isolated hepatocytes and on specific gene expression in cultured hepatocytes. Biochem Pharmacol. 2001;62:439-46
12
22. Wilcock C, Bailey CJ. Accumulation of metformin by tissues of the normal and diabetic mouse.
Xenobiotica. 1994;24:49-57
23. Cook DE, Blair JB, Lardy HA. Mode of action of hypoglycemic agents. V. Studies with phenethylbiguanide in isolated perfused rat liver. J Biol Chem. 1973;248:5272-7
24. Härndahl L, Schmoll D, Herling AW, Agius L. The role of glucose 6-phosphate in mediating the effects of glucokinase overexpression on hepatic glucose metabolism. FEBS J. 2006;273:336-46
25. Arden C, Petrie JL, Tudhope SJ, Al-Oanzi Z, Claydon AJ, Beynon RJ, Towle HC, Agius L. Elevated glucose represses liver glucokinase and induces its regulatory protein to safeguard hepatic phosphate homeostasis. Diabetes. 2011;60:3110-20
26. Grefhorst A, Schreurs M, Oosterveer MH, Cortés VA, Havinga R, Herling AW, Reijngoud DJ, Groen AK, Kuipers F. Carbohydrate-response-element-binding protein (ChREBP) and not the liver X receptor α (LXRα) mediates elevated hepatic lipogenic gene expression in a mouse model of glycogen storage disease type 1. Biochem J. 2010;432:249-54
27. Cool B, Zinker B, Chiou W, Kifle L, Cao N, Perham M, Dickinson R, Adler A, Gagne G, Iyengar R, Zhao G, Marsh K, Kym P, Jung P, Camp HS, Frevert E. Identification and characterization of a small molecule AMPK activator that treats key components of type 2 diabetes and the metabolic syndrome. Cell
Metab. 2006;3:403-16
28. Xiao B, Sanders MJ, Carmena D, Bright NJ, Haire LF, Underwood E, Patel BR, Heath RB, Walker PA, Hallen S, Giordanetto F, Martin SR, Carling D, Gamblin SJ. Structural basis of AMPK regulation by small molecule activators. Nat Commun. 2013;4:3017.
29. Hunter RW, Foretz M, Bultot L, Fullerton MD, Deak M, Ross FA, Hawley SA, Shpiro N, Viollet B, Barron D, Kemp BE, Steinberg GR, Hardie DG, Sakamoto K. Mechanism of action of compound-13: an α1-selective small molecule activator of AMPK. Chem Biol. 2014;21:866-79
30. Qiu BY, Turner N, Li YY, Gu M, Huang MW, Wu F, Pang T, Nan FJ, Ye JM, Li JY, Li J.
High-throughput assay for modulators of mitochondrial membrane potential identifies a novel compound with beneficial effects on db/db mice. Diabetes. 2010;59:256-65
31. Alshawi A, Agius L. Low metformin causes a more oxidized mitochondrial NADH/NAD redox state in hepatocytes and inhibits gluconeogenesis by a redox-independent mechanism. J Biol Chem.
2019;294:2839-2853
32. Moyle J, Mitchell P. The proton-translocating nicotinamide-adenine dinucleotide (phosphate) transhydrogenase of rat liver mitochondria. Biochem J. 1973;132:571-85
33. Sies H, Summer KH, Bücher T. A process requiring mitochondrial NADPH: urea formation from ammonia. FEBS Lett. 1975;54:274-8
34. Sies H, Akerboom TP, Tager JM. Mitochondrial and cytosolic NADPH systems and isocitrate
dehydrogenase indicator metabolites during ureogensis from ammonia in isolated rat hepatocytes. Eur J
Biochem. 1977;72:301-7
35. Kraev A. Parallel universes of Black Six biology. Biol Direct. 2014;9:18
36. Hampson LJ, Agius L. Increased potency and efficacy of combined phosphorylase inactivation and glucokinase activation in control of hepatocyte glycogen metabolism. Diabetes. 2005;54:617-23 37. Villar-Palasí C, Guinovart JJ. The role of glucose 6-phosphate in the control of glycogen synthase.
FASEB J. 1997;11:544-58
38. KATZ J, WOOD HG. The use of C14O2 yields from glucose-1- and -6-C14 for the evaluation of the pathways of glucose metabolism. J Biol Chem. 1963;238:517-23
39. Crawford JM, Blum JJ. Quantitative analysis of flux along the gluconeogenic, glycolytic and pentose phosphate pathways under reducing conditions in hepatocytes isolated from fed rats. Biochem J. 1983 ;212:585-98
40. Thomas AP, Halestrap AP. The rôle of mitochondrial pyruvate transport in the stimulation by glucagon and phenylephrine of gluconeogenesis from L-lactate in isolated rat hepatocytes. Biochem J.
1981;198:551-60
41. Hers HG, Hue L. Gluconeogenesis and related aspects of glycolysis. Annu Rev Biochem. 1983;52:617-53 42. McCune SA, Foe LG, Kemp RG, Jurin RR. Aurintricarboxylic acid is a potent inhibitor of
13
43. Berry MN, Gregory RB, Grivell AR, Phillips JW, Schön A. The capacity of reducing-equivalent shuttles limits glycolysis during ethanol oxidation. Eur J Biochem. 1994;225:557-64
44. Akerboom TP, Bookelman H, Zuurendonk PF, van der Meer R, Tager JM. Intramitochondrial and extramitochondrial concentrations of adenine nucleotides and inorganic phosphate in isolated hepatocytes from fasted rats. Eur J Biochem. 1978;84:413-20
45. Dykens JA, Jamieson J, Marroquin L, Nadanaciva S, Billis PA, Will Y. Biguanide-induced mitochondrial dysfunction yields increased lactate production and cytotoxicity of aerobically-poised HepG2 cells and human hepatocytes in vitro. Toxicol Appl Pharmacol. 2008;233:203-10
46. Vanstapel F, Waebens M, Van Hecke P, Decanniere C, Stalmans W. The cytosolic concentration of phosphate determines the maximal rate of glycogenolysis in perfused rat liver. Biochem J. 1990;266:207-12
47. Mráček T, Drahota Z, Houštěk J. The function and the role of the mitochondrial glycerol-3-phosphate dehydrogenase in mammalian tissues. Biochim Biophys Acta. 2013;1827:401-10
48. Poungvarin N, Chang B, Imamura M, Chen J, Moolsuwan K, Sae-Lee C, Li W, Chan L. Genome-Wide Analysis of ChREBP Binding Sites on Male Mouse Liver and White Adipose Chromatin. Endocrinology. 2015;156:1982-94
49. Kim MS, Krawczyk SA, Doridot L, Fowler AJ, Wang JX, Trauger SA, Noh HL, Kang HJ, Meissen JK, Blatnik M, Kim JK, Lai M, Herman MA. ChREBP regulates fructose-induced glucose production independently of insulin signaling. J Clin Invest. 2016;126:4372-4386
50. Van Schaftingen E, Bartrons R, Hers HG. The mechanism by which ethanol decreases the concentration of fructose 2,6-bisphosphate in the liver. Biochem J. 1984;222:511-8
51. Chakera AJ, Steele AM, Gloyn AL, Shepherd MH, Shields B, Ellard S, Hattersley AT. Recognition and Management of Individuals with Hyperglycemia because of a Heterozygous Glucokinase Mutation. Diabetes Care. 2015;38:1383‐92 52. Otto M, Breinholt J, Westergaard N. Metformin inhibits glycogen synthesis and gluconeogenesis in cultured rat hepatocytes. Diabetes Obes Metab. 2003;5:189‐94 53. Agius L. Role of glycogen phosphorylase in liver glycogen metabolism. Mol Aspects Med. 2015;46:34‐45 54. Stincone A, Prigione A, Cramer T, Wamelink MM, Campbell K, Cheung E, Olin‐Sandoval V, Grüning NM, Krüger A, Tauqeer Alam M, Keller MA, Breitenbach M, Brindle KM, Rabinowitz JD, Ralser M. The return of metabolism: biochemistry and physiology of the pentose phosphate pathway. Biol Rev Camb Philos Soc. 2015;90:927‐63 55. Hue L. Role of fructose 2,6‐bisphosphate in the stimulation of glycolysis by anoxia in isolated hepatocytes. Biochem J. 1982;206:359‐65 56. Hunter RW, Hughey CC, Lantier L, Sundelin EI, Peggie M, Zeqiraj E, Sicheri F, Jessen N, Wasserman DH, Sakamoto K. Metformin reduces liver glucose production by inhibition of fructose‐1‐6‐bisphosphatase. Nat Med. 2018;24:1395‐1406 57. Dong Y, Chen YT, Yang YX, Shou D, Li CY. Urinary Metabolomic Profiling in Zucker Diabetic Fatty Rats with Type 2 Diabetes Mellitus Treated with Glimepiride, Metformin, and Their Combination. Molecules. 2016;21(11) 58. Argaud D, Roth H, Wiernsperger N, Leverve XM. Metformin decreases gluconeogenesis by enhancing the pyruvate kinase flux in isolated rat hepatocytes. Eur J Biochem. 1993;213:1341‐8. 59. El‐Mir MY, Nogueira V, Fontaine E, Avéret N, Rigoulet M, Leverve X. Dimethylbiguanide inhibits cell respiration via an indirect effect targeted on the respiratory chain complex I. J Biol Chem. 2000 J ;275:223‐8. 60. Bridges HR, Jones AJ, Pollak MN, Hirst J. Effects of metformin and other biguanides on oxidative phosphorylation in mitochondria. Biochem J. 2014;462:475‐87. 61. Bridges HR, Sirviö VA, Agip AN, Hirst J. Molecular features of biguanides required for targeting of mitochondrial respiratory complex I and activation of AMP‐kinase. BMC Biol. 2016;14:65.
14
62. Cameron AR, Logie L, Patel K, Erhardt S, Bacon S, Middleton P, Harthill J, Forteath C, Coats JT, Kerr C, Curry H, Stewart D, Sakamoto K, Repiščák P, Paterson MJ, Hassinen I, McDougall G, Rena G. Metformin selectively targets redox control of complex I energy transduction. Redox Biol. 2018;14:187‐197. 63. Glossmann HH, Lutz OMD. Pharmacology of metformin ‐ An update. Eur J Pharmacol. 2019;865:172782. 64. Wang Y, An H, Liu T, Qin C, Sesaki H, Guo S, Radovick S, Hussain M, Maheshwari A, Wondisford FE, O'Rourke B, He L. Metformin Improves Mitochondrial Respiratory Activity through Activation of AMPK. Cell Rep. 2019;29:1511‐1523. 65. Zhang CS, Hawley SA, Zong Y, Li M, Wang Z, Gray A, Ma T, Cui J, Feng JW, Zhu M, Wu YQ, Li TY, Ye Z, Lin SY, Yin H, Piao HL, Hardie DG, Lin SC. Fructose‐1,6‐bisphosphate and aldolase mediate glucose sensing by AMPK. Nature. 2017;548:112‐116 66. Li M, Zhang CS, Zong Y, Feng JW, Ma T, Hu M, Lin Z, Li X, Xie C, Wu Y, Jiang D, Li Y, Zhang C, Tian X, Wang W, Yang Y, Chen J, Cui J, Wu YQ, Chen X, Liu QF, Wu J, Lin SY, Ye Z, Liu Y, Piao HL, Yu L, Zhou Z, Xie XS, Hardie DG, Lin SC. Transient Receptor Potential V Channels Are Essential for Glucose Sensing by Aldolase and AMPK. Cell Metab. 2019;30:508‐524. 67. Stein BD, Calzolari D, Hellberg K, Hu YS, He L, Hung CM, Toyama EQ, Ross DS, Lillemeier BF, Cantley LC, Yates JR 3rd, Shaw RJ. Quantitative In Vivo Proteomics of Metformin Response in Liver Reveals AMPK‐ Dependent and ‐Independent Signaling Networks. Cell Rep. 2019;29:3331‐3348. 68. Neal A, Rountree AM, Philips CW, Kavanagh TJ, Williams DP, Newham P, Khalil G, Cook DL, Sweet IR. Quantification of Low‐Level Drug Effects Using Real‐Time, in vitro Measurement of Oxygen onsumption Rate. Toxicol Sci. 2015;148:594‐602 69. Boudaba N, Marion A, Huet C, Pierre R, Viollet B, Foretz M. AMPK Re‐Activation Suppresses Hepatic Steatosis but its Downregulation Does Not Promote Fatty Liver Development. EBioMedicine. 2018;28:194‐209 70. Codner GF, Mianné J, Caulder A, Loeffler J, Fell R, King R, Allan AJ, Mackenzie M, Pike FJ, McCabe CV, Christou S, Joynson S, Hutchison M, Stewart ME, Kumar S, Simon MM, Agius L, Anstee QM, Volynski KE, Kullmann DM, Wells S, Teboul L. Application of long single‐stranded DNA donors in genome editing: generation and validation of mouse mutants. BMC Biol. 2018;16:70. 71. de la Iglesia N, Mukhtar M, Seoane J, Guinovart JJ, Agius L. The role of the regulatory protein of glucokinase in the glucose sensory mechanism of the hepatocyte. J Biol Chem. 2000;275:10597‐603 72. Itaya K, Ui M. A new micromethod for the colorimetric determination of inorganic phosphate. Clin Chim Acta. 1966;14:361‐6. 73. Marin S, Lee WN, Bassilian S, Lim S, Boros LG, Centelles JJ, FernAndez‐Novell JM, Guinovart JJ, Cascante M. Dynamic profiling of the glucose metabolic network in fasted rat hepatocytes using [1,2‐ 13C2]glucose. Biochem J. 2004;381:287‐94. 74. Payne VA, Arden C, Wu C, Lange AJ, Agius L. Dual role of phosphofructokinase‐2/fructose bisphosphatase‐2 in regulating the compartmentation and expression of glucokinase in hepatocytes. Diabetes. 2005;54:1949‐57 FOOTNOTESFunding was provided by research grants from Diabetes UK (Ref 13/0004701) and MRC (MR/P002854/1) to LA. AA was funded by a Higher Committee for Education Development HCED Iraq Grant 2015-2019. MC acknowledges Agència Catalana d’Ajuts Universitaris i de Recerca (AGAUR) (2017SGR1033) and ICREA Foundation (Generalitat de Catalunya).
The abbreviations used are: ACC, acetyl-CoA carboxylase; AMPK, AMP-activated protein kinase; AOA, amino-oxyacetate; ATA, aurintricarboxylic acid; ChREBP, Carbohydrate response element binding protein; cGPDH, cytoplasmic glycerophosphate dehydrogenase; DHA, dihydroxyacetone; DNP, dinitrophenol; G3P, glycerol 3-phosphate; FBP1, fructose bisphosphatase-1; G6P, glucose 6-phosphate; mGPDH, mitochondrial glycerophosphate dehydrogenase; PFK1, phosphofructokinase-1; Pi, inorganic phosphate.
15
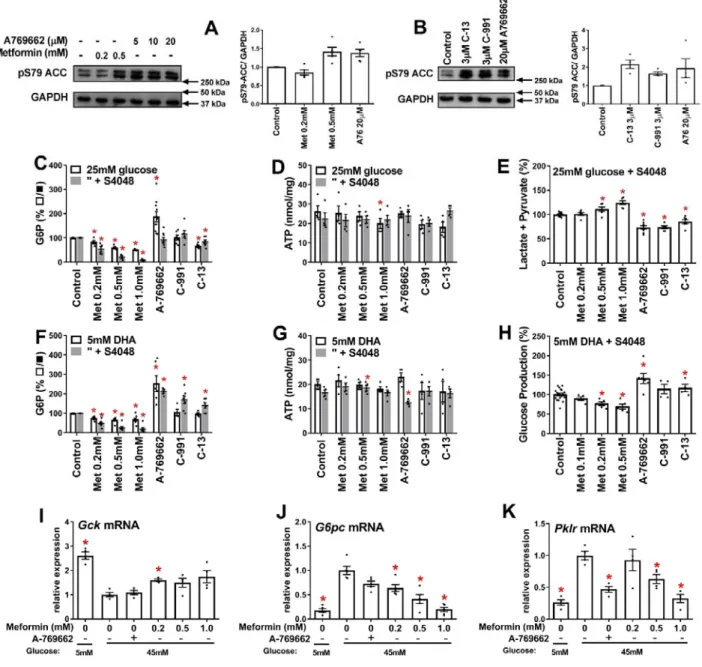
Figure 1. Metformin accumulation in hepatocytes and effects on cell G6P and ATP.
A-B. Cell metformin in mouse hepatocytes incubated in MEM with 5mM glucose and 14C-metformin at the
concentrations indicated for 2h followed by a further hour with added 25mM glucose, n=4-9. Cell metformin is expressed as nmol/mg cell protein (A) or as intracellular / extracellular concentration ratio (B).
C-N. Rat or mouse hepatocytes were incubated for 2h in MEM containing 5mM glucose and the metformin concentrations indicated without (open bar) or with (shaded bar) S4048, followed by a further 1h with the substrates indicated for determination of G6P (C-I) or ATP (J-M). Cell G6P is expressed as % control without S4048 (C,D,E) or % respective control -/+ S4048 (F,G,H,I). ATP, is expressed as nmol/mg protein. C,J- 5mM glucose, rat hepatocytes; D,K- 25mM glucose, rat hepatocytes; E,L- 25mM glucose, mouse hepatocytes; H,M-5mM glucose + 5mM-DHA; I,N-5mM glucose + 2mM xylitol. F,G are data in D,E normalized to respective control. Means ± SE, for n=3(E,I,L,N), 4(C,D,J,K), 7(H,M); hepatocyte preparations. *P < 0.05 effect of metformin (C-N); #P < 0.05 effect of S4048 (C-E).
16
Figure 2. Opposite effects of AMPK activators and metformin on glycolysis and gluconeogenesis in rat hepatocytes. Incubations with metformin or AMPK activators were for 2h followed by 1h incubation with substrate as in Fig. 1. A-B. Phosphorylation of ACC-S79 by metformin and A-769662 (A) and by the 3 AMPK activators: C13, C-991 and A-769662 (B). Representative blots and densitometry. C-E. Cell G6P and ATP and production of lactate + pyruvate with 25mM glucose. F-G. Cell G6P and ATP with 5mM DHA and 5mM glucose. H. Glucose production from 5mM DHA in glucose-free medium. I-K. Gck, G6pc and Pklr mRNA in rat hepatocytes after 4h incubation with the additions indicated at 5mM or 45mM glucose. Means ± SE, for n=4-6 (A-B); 4-10 (C-H); 4-5 (I-K), * P < 0.05 relative to respective control (C-H) or relative to
17
Figure. 3. Metformin lowers G6P in hepatocytes from AMPK-KO mice.
A.Immunoactivity to AMPK in hepatocytes from AMPKα1α2lox/lox mice (M1,M7,M8) and AMPKα1α2lox/lox
Alb-CRE (M2-M6) mice designated, AMPK-KO. B. Immunoactivity to AMPK-T172(P) after 3h incubation with metformin (0.2,0.5mM) or A-769662 (10µM) in hepatocytes from AMPKα1α2lox/lox control and
AMPK-KO mice. C. Immunoactivity to AMPK-T172(P) in hepatocytes from AMPKα1α2lox/lox incubated for 3h -/+
metformin (0.2 or 0.5mM) or A-769667 (10µM) at either 5mM glucose or 25mM glucose + S4048, representative immunoblot and densitometry for n=3 mice, *P < 0.05 vs respective control; # vs respective 5mM glucose.
D-O: Hepatocytes from AMPKlox/lox (n=3) or AMPK-KO (n=5) mice were pre-incubated for 2h -/+
metformin (0.2 or 0.5mM) or A-769662 (10µM) for 2h followed by 1h incubation in medium with either 25mM glucose -/+ S4048 or with 5mM DHA -/+ S4048: for determination of cell ATP (D-G) and G6P (H-K) expressed as nmol/mg protein; L,M: ATP from treatments with 25mM glucose + S4048 expressed as % controls without S4048; N,O. G6P from treatments with 25mM glucose + S4048 expressed as % controls with S4048. * P < 0.05 vs respective control; # vs substrate control without S4048 (S).
18
Figure 4. Rotenone, dinitrophenol and rhein mimic the G6P lowering by metformin. A. Target sites of mitochondrial inhibitors: rotenone, Complex 1 (C1); dinitrophenol (DNP), uncoupler (dissipation of proton gradient); rhein, inhibitor of nicotinamide nucleotide transhydrogenase (NNT). B-K. Incubations with metformin and mitochondrial inhibitors were for 2h followed by 1h incubation with substrate as in Fig. 1. B,C Cell G6P and ATP in rat hepatocytes incubated with mitochondrial inhibitors. Means ± SEM for n=3-15. D. Glucose oxidation in mouse hepatocytes incubated with 15mM [U-14C]glucose for 1h (after 2h -/+
metformin). Means ± SEM, for n=3. E. Rhein raises cell NADP and lowers G6P (n=5 G6P,ATP; 2 NADP). F-H. Effects of metformin and 2mM NH4Cl on NADP, G6P and ATP (n=4). I-K. Metformin lowers G6P
in hepatocytes from mice with either an intact (WT) or lacking a functional Nnt gene (Nnt-del), n=7-8 (J,K). Means ± SEM, *P < 0.05 vs respective control (B-K); #P < 0.05, 25mM vs 5mM glucose (F).