HAL Id: hal-03125671
https://hal.archives-ouvertes.fr/hal-03125671
Submitted on 29 Jan 2021
HAL is a multi-disciplinary open access
archive for the deposit and dissemination of
sci-entific research documents, whether they are
pub-lished or not. The documents may come from
teaching and research institutions in France or
abroad, or from public or private research centers.
L’archive ouverte pluridisciplinaire HAL, est
destinée au dépôt et à la diffusion de documents
scientifiques de niveau recherche, publiés ou non,
émanant des établissements d’enseignement et de
recherche français ou étrangers, des laboratoires
publics ou privés.
Towards a better description of visual exploration
through temporal dynamic of ambient and focal modes
Alexandre Milisavljevic, Thomas Bras, Matei Mancas, Coralie Petermann,
Bernard Gosselin, Karine Doré-Mazars
To cite this version:
Alexandre Milisavljevic, Thomas Bras, Matei Mancas, Coralie Petermann, Bernard Gosselin, et al..
Towards a better description of visual exploration through temporal dynamic of ambient and focal
modes. 2019 ACM Symposium on Eye Tracking Research & Applications, Jun 2019, Denver, United
States. �10.1145/3314111.3323075�. �hal-03125671�
temporal dynamic of ambient and focal modes
Alexandre Milisavljevic
Paris Descartes UniversityParis, France
Thomas Le Bras
Paris Descartes UniversityParis, France
Matei Mancas
Mons University Mons, BelgiumCoralie Petermann
Sublime Skinz Paris, FranceBernard Gosselin
Mons University Mons, BelgiumKarine Doré-Mazars
Paris Descartes UniversityParis, France
ABSTRACT
Human eye movements are far from being well described with current indicators. From the dataset provided by the ETRA 2019 challenge, we analyzed saccades and fixations during a free explo-ration of blank or natural scenes and during visual search. Based on the two modes of exploration, ambient and focal, we used the K coefficient [Krejtz et al. 2016]. We failed to find any differences between tasks but this indicator gives only the dominant mode over the entire recording. The stability of both modes, assesses with the switch frequency and the mode duration allowed to differentiate gaze behavior according to situations. Time course analyses of K coefficient and switch frequency corroborate that the latter is a useful indicator, describing a greater portion of the eye movement recording.
CCS CONCEPTS
• Mathematics of computing → Statistical paradigms; • Applied computing → Psychology.
KEYWORDS
visual processing, temporal analysis, ambient, focal
ACM Reference Format:
Alexandre Milisavljevic, Thomas Le Bras, Matei Mancas, Coralie Petermann, Bernard Gosselin, and Karine Doré-Mazars. 2019. Towards a better descrip-tion of visual exploradescrip-tion through temporal dynamic of ambient and focal modes. In 2019 Symposium on Eye Tracking Research and Applications (ETRA ’19), June 25–28, 2019, Denver , CO, USA. ACM, New York, NY, USA, 4 pages.
https://doi.org/10.1145/3314111.3323075
1
INTRODUCTION
Nowadays, we know that human gaze behavior is influenced by multiple aspects of a stimulus such as faces, shapes, colors and so on [Coutrot and Guyader 2014; Tatler et al. 2003, 2008]. In that sense, two categories of factors emerged: bottom-up and top-down
Permission to make digital or hard copies of all or part of this work for personal or classroom use is granted without fee provided that copies are not made or distributed for profit or commercial advantage and that copies bear this notice and the full citation on the first page. Copyrights for components of this work owned by others than the author(s) must be honored. Abstracting with credit is permitted. To copy otherwise, or republish, to post on servers or to redistribute to lists, requires prior specific permission and/or a fee. Request permissions from [email protected].
ETRA ’19, June 25–28, 2019, Denver , CO, USA
© 2019 Copyright held by the owner/author(s). Publication rights licensed to ACM. ACM ISBN 978-1-4503-6709-7/19/06. . . $15.00
https://doi.org/10.1145/3314111.3323075
[Helo et al. 2014; Yarbus 1967]. Bottom-up factors are low-level fea-tures describing stimuli’s physical characteristics like luminance, contrast or edges [Tatler et al. 2008]. The influence of these factors appeared to be higher at the beginning of visual exploration [Tatler et al. 2008]. In contrast, top-down factors are high-level features which represent the wide scope of cognitive processes [Hender-son and Hollingworth 1999] including the task, semantic, memory, emotions, etc [Le Meur and Coutrot 2016; Yarbus 1967]. Contrary to bottom-up factors, the influence of top-down ones is more com-plex to understand and to predict because of its nature inherent to each person [Borji and Itti 2013; Le Meur and Coutrot 2016]. Thus, bottom-up and top-down factors alternatively influence the visual exploration during its course [Henderson 2003; Torralba et al. 2006]. The reasons of the switch between the two remain uncertain but [Unema et al. 2005] showed the existence of two visual processing modes related to the two visual pathways. These visual process-ing modes were define accordprocess-ing to fixation duration and saccade amplitude parameters. The first mode is the ambient one which is defined by a short fixation (<180ms) followed by a large saccade (>5°) [Pannasch and Velichkovsky 2009; Velichkovsky et al. 2002]. Its role is to contextualize elements present within the visual scene [Pannasch et al. 2008; Velichkovsky et al. 2002]. The second one is the focal mode which is characterized by a long fixation (>180ms) followed by a short saccade (<5°) [Helo et al. 2014; Velichkovsky et al. 2002]. It allows to identify specific elements of the visual scene. As reported by [Velichkovsky et al. 2002], ambient mode is dominant during the two first seconds of the exploration while the focal mode gradually becomes dominant overt time. Therefore ambient mode was associated with bottom-up factors while focal mode seems to be related to top-down ones [Helo et al. 2014].
The interest in the dynamic of the ocular exploration and more recently in these two visual processing modes led researchers to im-plement several ratios to describe and exploit these aspects. To our knowledge, Goldberg and Kotval [Goldberg and Kotval 1999] were the first to try to represent this dynamic by describing its diversity. In their study, these authors proposed a ratio separating fixation du-ration and saccade dudu-ration, visual information processing taking place only during the fixation. However, they had limited results with this method. More recently, [Dehais et al. 2015] introduced an improved version of this ratio based on the distinction between short and long fixations.
Nevertheless, such ratios are not directly related to the two visual processing modes described here but report an interest of researchers to explain the complexity of visual exploration. To our
ETRA ’19, June 25–28, 2019, Denver , CO, USA A. Milisavljevic et al.
knowledge, the first and only ratio created in order to represent ambient and focal modes is the one proposed by [Krejtz et al. 2016]. In their work, the authors exploited the oculomotor parameters defined by [Unema et al. 2005] to identify the two visual processing modes and their respective intensity. Thereby, this ratio called K coefficient, seems to be a good global estimator while respecting the definition of the two modes given by [Unema et al. 2005].
The main goal of the present work is to assess whether the K coefficient described in [Krejtz et al. 2016] could be a good tool to understand visual behavior. That is why we introduce new analyses in which we use this coefficient and extend it with two new variables in order to give more insights into the understanding of visual exploration. These analyses can be independently used for global and temporal analyses. To demonstrate their utility, we use them to discriminate free-viewing and visual search tasks.
2
DATASET
As part of the 2019 ACM Eye-Tracking Research and Application (ETRA) conference, a new dataset composed of images and raw eye movements recordings has been released. We only describe here the subset we used for our analyses, see [McCamy et al. 2014; Otero-Millan et al. 2008] for further details.
2.1
Participants
The head of participants was placed on a chin-rest 57 cm from the video monitor (75 Hz refresh rate). Eye-tracking data were recorded from eight participants (2 women and 6 men) in three experimental sessions of 60 minutes each.
2.2
Stimuli
Stimuli were split in four categories: Blank scene, Natural scene, where is Waldo scene and picture puzzle but we only are interested in the first three. The first one was a plain 50% grey displayed on the whole screen. The second category contained 15 images of multiple scenes from flower bed to school bus. Some scenes included people and animals but never at the same time. The third category was composed of 15 where is Waldo scenes.
2.3
Tasks
Participants were asked to perform three tasks: free-viewing, visual search and fixation but we only are interested by the first two. For Natural stimuli, participants had to complete a free-viewing task while they had to search a visual target (Waldo, or another character or item) into the Waldo scene.
2.4
Experimental Design
All Participants performed all the conditions, 4 in free-viewing task and 4 in fixation task. For all the conditions, stimuli were presented during 45 seconds. In the fixation task, participants received an auditory feedback when their gaze left an area of 2 deg around the fixation cross for more than 500ms. In the visual search task for puzzle scenes and “Where is Waldo ?“ scenes, they had to click where they thought the differences or the targets were, after the 45 seconds.
2.5
Data cleaning
Our interest in this research is to study the dynamics of ocular exploration. For this reason we kept data from Blank, and Natu-ral scenes in the free-viewing condition and where is Waldo ? in the visual search condition. Provided data are samples of events recorded by the eye-tracker every 2 milliseconds. In order to aggre-gate and identify fixations and saccades, we used the identification velocity-based algorithm (I-VT) from [Salvucci and Goldberg 2000]. Then, we set a velocity threshold of 100°/s to separate fixations and saccades. Next, based on fixation duration distributions, we removed outliers by deleting every fixation under 100 milliseconds and greater than 1000 ms. Finally, we removed fixations outside the screen and re-computed saccades.
3
ANALYSES AND RESULTS
We first globally computed the K coefficient’s intensity as defined in [Krejtz et al. 2016] to understand the general tendencies across stimuli and tasks. We then completed it with other variables such as mean duration in each mode to illustrate the wide variety of possibilities brought by this same coefficient. Finally, as the visual exploration is dynamic, we selected the most interesting variables and observed them through time. We first checked that our basic statistics of eye movements were in accordance with McCamy (2014) and Otero (2008) [McCamy et al. 2014; Otero-Millan et al. 2008]. We observed similar fixation durations for Waldo stimuli (M=282.7, SD=131.8), Natural stimuli (M=287.7, SD=150.5) and Blank stimuli (M=360.7, SD=201) as well as saccades amplitudes for Waldo stimuli (M=4.41, SD=4.25), Natural stimuli (M=5.58, SD=4.81) and Blank stimuli (M=7.89, SD=6.81).
3.1
Intensity
We compute the K coefficient’s intensity as described in [Krejtz et al. 2016]. To this end and as shown in equation 1, the K coefficient is the z-scored difference between fixation duration and next saccade amplitude where µ and σ are respectively the mean and the standard deviation of fixations duration or next saccades amplitude within a trial. K= 1 n Õ n di− µd σd −ai+1− µa σa (1)
Thus, a negative value of the K coefficient means that the fixation duration di deviates from the mean duration and the next saccade
amplitude ai+1is a long saccade (>5°) which deviates from the mean amplitude of the trial. On the contrary, a positive value indicates that the fixation di and the next saccade ai+1correspond to a focal
mode.
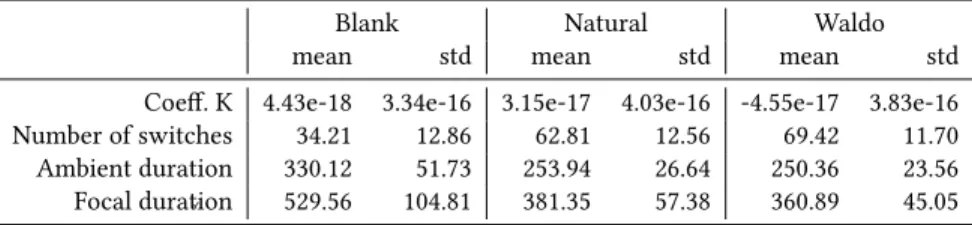
We did not found significant differences between Blank, Natural and Waldo stimuli, F (2,14) =1.38,p>.05. As seen in Table 1, means of K coefficient are very similar and close to 0, hence the fact that there is no dominant mode. For this reason, the variation of gaze behavior during the exploration added to the characteristics of tasks and stimuli do not allow to differentiate visual explorations through K coefficient.
Table 1: Means and standard deviations (std) of K coefficient, number of switches, ambient and focal durations as a function of the tasks and visual stimuli: free-viewing in Blank and Natural scenes and visual search in Waldo scenes
Blank Natural Waldo
mean std mean std mean std
Coeff. K 4.43e-18 3.34e-16 3.15e-17 4.03e-16 -4.55e-17 3.83e-16 Number of switches 34.21 12.86 62.81 12.56 69.42 11.70 Ambient duration 330.12 51.73 253.94 26.64 250.36 23.56 Focal duration 529.56 104.81 381.35 57.38 360.89 45.05
3.2
Stability
Here we extend the coefficient by computing two new variables which are the average duration per mode (ms) and the number of switches between modes. The first allows us to know the mean duration during which participants stayed in the same mode. The higher the value is, the more the time spent in each mode increases and the more stable the participant’s exploration is. To do so, we determined when a mode session started and when it finished. Then we calculated the mean duration by adding the fixation durations and saccade durations for each session. Next, we calculated the mean duration of each session in ambient mode and in focal mode as shown in Table 1. Unlike with the K coefficient, we found a sig-nificant main effect of the stimulus type on mean ambient duration. Moreover, differences on the mean ambient duration were signif-icant between the three stimuli F (2,14) = 39.61, p<.001. A Tukey test showed that differences between Blank and Waldo stimuli was significant, t(7) = 56.44, p<.001; as between Blank and Natural stim-uli, t(7) = 46.35,p.<.001. However, difference between Natural and Waldo stimuli, t(7) = 1.89,p>.05, was not significant. We observed the same significant effect on the mean duration in focal F (2,14) = 49.75,p<.001. Tukey test analyses showed again that Blank and Waldo stimuli were significantly different, t(7) = 47.24,p<.001; as well as the difference between Blank and Natural stimuli, t(7) = 36.95, p.<.001. Difference between Natural and Waldo stimuli t(7) = 4.83, p>.05, was not significant. Such analyses based on the mode stability reveal differences between visual explorations, in partic-ular for the Blank stimulus but not between Waldo and Natural scenes.
The second variable allows us to investigate another aspect of the mode stability: the number of mode switches during recording. This variable corresponds to the number of times K coefficient switches from positive to negative values or the reverse. As for mean duration per mode, we found a significant main effect of the stimulus type on the number of switches F (2,14) = 100.21,p<.001, see Table 1). Interestingly, Tukey analyses revealed differences between the three stimuli. Blank stimulus differed from Waldo stimulus, t(7)= 231.46,p<.001) as well as from Natural stimulus t(7) = 112.85,p<.001. However, the difference was significant here between Natural and Waldo stimuli, t(7) = 5.23,p<.05. Differences emerged when indicators of stability were taken into account, suggesting to turn to other analyses to better explain the dynamics of visual explorations and differentiate them as a function of each stimulus presented to the participants.
3.3
Dynamics
The mean duration of each mode and the number of switches be-tween modes change over time across the three stimuli. This pro-vides more information than global analyses which does not take into account the temporal dynamic. Thus we need to consider the dynamic of the exploration by dividing our data in time sequences and observe the time course of our variables. To minimize our data loss, we removed every records after 34s which corresponds to the shortest trial after cleaning. We then divided each trial in eight sequences of 4.25s.
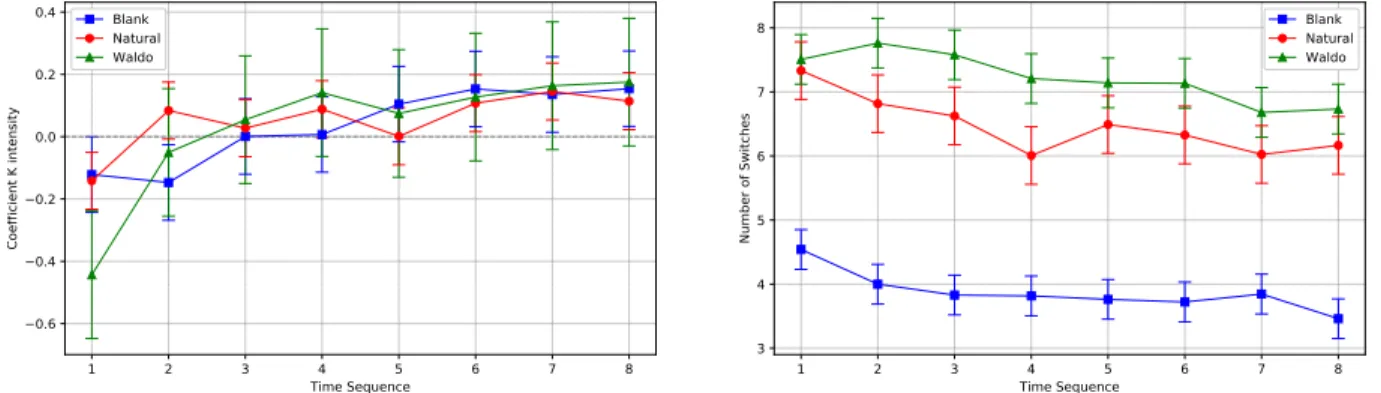
As shown in Figure 1, there is a significant effect of time on the number of switches and K coefficient F (7,49) = 7.80, p<.001 which increases over time. Moreover, the exploration of all the three stimuli begins with an ambient mode which then tend to focal mode over time. We noticed that in the first sequence, K coefficient was significantly different between Waldo stimulus and Natural stimulus t(7) = 6.82,p<.05, Waldo stimulus and Blank stimulus t(7) = 8.20,p<.05 but not between Blank stimulus and Natural stimulus t(7) =0.02,p>.05. These differences are not significant from the next sequence until the end of exploration, respectively t(7) = 1.66,p>.05 ;t(7) = 1.06,p>.05 ;t(7) = 3.32,p>.05.
When considering the number of mode switches, differences between Natural and Waldo stimuli were not significant for the first sequence t(7)=0.56,p>.05, the seventh sequence t(7) = 2.49, p>.05 and the eighth time sequence t(7) = 3.36,p>.05. For each other sequences, differences between Blank stimulus, Natural and Waldo stimuli were significant t(7) = 28.29, p<.001 ; t(7) = 106.79,p<.001.
If we put these observations in perspective, it becomes clear why the K coefficient did not discriminate visual exploration be-tween stimuli. There were two sequences of approximately 9s where K coefficient differentiated stimuli against the last six sequences covering 25.5s which did not differ. Therefore, the analysis of K coefficient through time gave new insights on how to discriminate stimuli and tasks. However, the coefficient could only discriminate 25% of the exploration. As shown in Figure 1 (right), the difference between Where’s Waldo and Natural conditions remained signifi-cant during the first half of the exploration (i.e. for each of the first four sequences). It is interesting to note that the difference is visible longer than for the K coefficient.
4
DISCUSSION AND CONCLUSION
The analyses of the K coefficient showed that a global approach is too coarse to emerge significant relationships between stimuli and modes. When analyzed statistically, the values of coefficient K for the three stimuli are close to the origin. This could be explained
ETRA ’19, June 25–28, 2019, Denver , CO, USA A. Milisavljevic et al. 1 2 3 4 5 6 7 8 Time Sequence −0.6 −0.4 −0.2 0.0 0.2 0.4 Co effi cie nt K i nte nsi ty Blank Natu al Waldo 1 2 3 4 5 6 7 8 Time Sequence 3 4 5 6 7 8 Nu mb e of Sw itc he s Blank Natu al Waldo
Figure 1: K Coefficient (left panel) and Number of switches (right panel) as a function of stimuli and time sequence ranges. by the fact that the gaze behavior is dynamic in essence and is
constantly changing between ambient and focal modes. These fluc-tuations could cancel each other and result in a coefficient near 0. This assumption is supported by the fact that significant differences appeared when the coefficient was analyzed over time. In addition, we observed a dominant ambient mode during the first sequence which turned into a focal mode during the second sequence except for Blank stimulus probably due to the fact that no visual stimulus is available and thus does not require cognitive resources. Thus, participants could stay much longer in each mode. This hypothesis is supported by the results shown in Figure 1 (right).
The analyses of mean duration in ambient and focal modes are to put in perspective with the number of switches. When the mean duration in each mode increases, the number of switches decreases and reverse. A higher mean duration in ambient implies more con-textualization from the participant and less processing but does not necessarily mean the dominant mode is ambient.
The investigation on the number of mode switches allowed us to discriminate the stimuli up to 50% of the exploration. This improve-ment suggests the number of switches could help to better explain bottom-up and top-down influences during the visual exploration. In this study, it is important to note that we were limited by the missing information about the given tasks and the target identity in Where’s Waldo condition. Indeed, we do not know when the participant found the target, impeding to take into account only the period where the participant was really performing a visual search rather than the entire recording.
We think that future works should take into account these vari-ables based on the K coefficient and their dynamic analyses, as they provide very interesting tools to better understand ocular behavior in situations differing as for visual inputs or goals.
ACKNOWLEDGMENTS
This work is supported by the French Research and Technology Association (ANRT) under Grant No.2016/0957 and the company Sublime Skinz.
REFERENCES
Ali Borji and Laurent Itti. 2013. State-of-the-art in visual attention modeling. IEEE transactions on pattern analysis and machine intelligence 35, 1 (2013), 185–207. Antoine Coutrot and Nathalie Guyader. 2014. How saliency, faces, and sound influence
gaze in dynamic social scenes. Journal of vision 14, 8 (2014), 5–5.
Frédéric Dehais, Vsevolod Peysakhovich, Sebastien Scannella, Jennifer Fongue, and Thibault Gateau. 2015. "Automation Surprise" in Aviation: Real-Time Solutions. In CHI.
Joseph H Goldberg and Xerxes P Kotval. 1999. Computer interface evaluation using eye movements: methods and constructs. International Journal of Industrial Ergonomics 24, 6 (1999), 631 – 645. https://doi.org/10.1016/S0169-8141(98)00068-7 Andrea Helo, Sebastian Pannasch, Louah Sirri, and Pia Rämä. 2014. The maturation
of eye movement behavior: Scene viewing characteristics in children and adults. Vision research 103 (2014), 83–91.
John M Henderson. 2003. Human gaze control during real-world scene perception. Trends in cognitive sciences 7, 11 (2003), 498–504.
John M Henderson and Andrew Hollingworth. 1999. High-level scene perception. Annual review of psychology 50, 1 (1999), 243–271.
Krzysztof Krejtz, Andrew Duchowski, Izabela Krejtz, Agnieszka Szarkowska, and Agata Kopacz. 2016. Discerning Ambient/Focal Attention with Coefficient K. ACM
Transactions on Applied Perception 13, 3 (2016), 1–20. https://doi.org/10.1145/
2896452
Olivier Le Meur and Antoine Coutrot. 2016. Introducing context-dependent and spatially-variant viewing biases in saccadic models. Vision research 121 (2016), 72–84.
Michael B McCamy, Jorge Otero-Millan, Leandro Luigi Di Stasi, Stephen L Macknik, and Susana Martinez-Conde. 2014. Highly informative natural scene regions increase microsaccade production during visual scanning. Journal of neuroscience 34, 8 (2014), 2956–2966.
Jorge Otero-Millan, Xoana G Troncoso, Stephen L Macknik, Ignacio Serrano-Pedraza, and Susana Martinez-Conde. 2008. Saccades and microsaccades during visual fixation, exploration, and search: foundations for a common saccadic generator. Journal of vision 8, 14 (2008), 21–21.
Sebastian Pannasch, Jens R Helmert, Katharina Roth, Ann-Katrin Herbold, Henrik Walter, et al. 2008. Visual fixation durations and saccade amplitudes: Shifting relationship in a variety of conditions. Journal of Eye Movement Research 2, 2 (2008), 1–19.
Sebastian Pannasch and Boris M Velichkovsky. 2009. Distractor effect and saccade amplitudes: Further evidence on different modes of processing in free exploration of visual images. Visual Cognition 17, 6-7 (2009), 1109–1131.
Dario D Salvucci and Joseph H Goldberg. 2000. Identifying fixations and saccades in eye-tracking protocols. In Proceedings of the 2000 symposium on Eye tracking research & applications. ACM, 71–78.
Benjamin W Tatler, Iain D Gilchrist, and Jenny Rusted. 2003. The time course of abstract visual representation. Perception 32, 5 (2003), 579–592.
Benjamin W Tatler, Benjamin T Vincent, et al. 2008. Systematic tendencies in scene viewing. Journal of Eye Movement Research 2, 2 (2008), 1–18.
Antonio Torralba, Aude Oliva, Monica S Castelhano, and John M Henderson. 2006. Contextual guidance of eye movements and attention in real-world scenes: the role of global features in object search. Psychological review 113, 4 (2006), 766. Pieter J.A. Unema, Sebastian Pannasch, Markus Joos, and Boris M. Velichkovsky. 2005.
Time course of information processing during scene perception: The relationship between saccade amplitude and fixation duration. Visual Cognition 12, 3 (2005), 473–494. https://doi.org/10.1080/13506280444000409
Boris M Velichkovsky, Alexandra Rothert, Mathias Kopf, Sascha M Dornhöfer, and Markus Joos. 2002. Towards an express-diagnostics for level of processing and hazard perception. Transportation Research Part F: Traffic Psychology and Behaviour 5, 2 (2002), 145–156.
Alfred L Yarbus. 1967. Eye movements during perception of complex objects. (1967), 171–211.