1
Electronic Supplementary Information (ESI)
Photoluminescence of Yb
2+ions doped in the perovskites CsCaX
3
and CsSrX
3(X = Cl, Br, I) – A comparative study
Markus Suta
a, Werner Urland
b, Claude Daul
band Claudia Wickleder*
aa
Inorganic Chemistry, Faculty of Science and Technology, University of Siegen,
Adolf-Reichwein-Str. 2, 57068 Siegen, Germany
b
Department of Chemistry, University of Fribourg, Chemin du Musée 9, 1700 Fribourg,
Switzerland
E-Mail:
[email protected]
, Fax: +49-271-7402555, Tel: +49-271-7404217
X-ray powder diffraction patterns of CsMX
3: 0.1% Yb
2+(M = Ca, Sr; X
= Cl, Br, I)
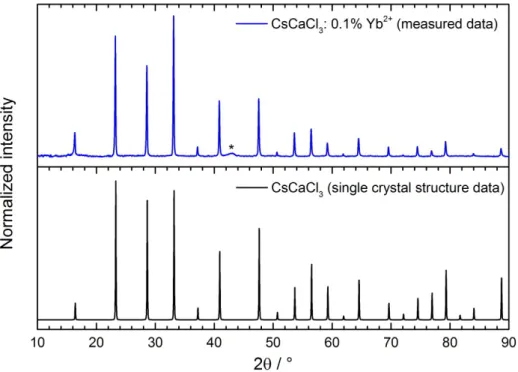
Figure S1. Measured XRD pattern of CsCaCl3: 0.1% Yb2+ (blue) compared to the diffraction pattern based on
single crystal structure data (based on reference 54 in the main article). The black asterisk marks a reflection from the silicon grease used for the sample preparation.
2
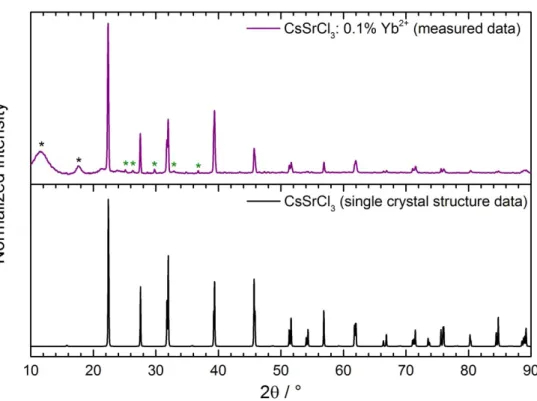
Figure S2. Measured XRD pattern of CsSrCl3: 0.1% Yb2+ (violet) compared to the diffraction pattern based on
single crystal structure data (based on reference 55 in the paper). The black asterisks mark reflections from the silicon grease used for the sample preparation. The green asterisks mark reflections arising from in situ hydrate formation during the measurement on air (they grow in intensity after subsequent measurements).
Figure S3. Measured XRD pattern of CsCaBr3: 0.1% Yb2+ (blue) compared to the diffraction pattern based on
single crystal structure data (based on reference 56 in the paper). The green asterisks mark reflections arising from in situ hydrate formation during the measurement on air (they grow in intensity after subsequent measurements).
3
Figure S4. Measured XRD pattern of CsSrBr3: 0.1% Yb2+ (violet) compared to the diffraction pattern based on
single crystal structure data (based on reference 56 in the paper). The black asterisks mark reflections from the silicon grease used for the sample preparation. The green asterisks mark reflections arising from in situ hydrate formation during the measurement on air (they grow in intensity after subsequent measurements).
Figure S5. Measured XRD pattern of CsCaI3: 0.1% Yb2+ (blue) compared to the diffraction pattern based on
single crystal structure data (based on reference 56 in the paper). The black asterisk marks a reflection from the silicon grease used for the sample preparation. The green asterisks mark reflections arising from in situ hydrate formation during the measurement on air (they grow in intensity after subsequent measurements).
4
Figure S6. Measured XRD pattern of CsSrI3: 0.1% Yb2+ (violet) compared to the diffraction pattern based on
single crystal structure data (based on reference 56 in the paper). The black asterisk marks a reflection from the silicon grease used for the sample preparation. The green asterisks mark reflections arising from in situ hydrate formation during the measurement on air (they grow in intensity after subsequent measurements).