Xiaolong Ren1,2, Linyuan Lü1, Runran Liu1and Jianlin Zhang1,2
1Alibaba Research Center for Complexity Sciences, Hangzhou Normal University, 311121
Hangzhou, Peopleʼs Republic of China
2Department of Physics, University of Fribourg, Chemin du Musée 3, Fribourg CH-1700,
Switzerland
E-mail:[email protected]
Received 5 March 2014, revised 17 April 2014 Accepted for publication 14 May 2014
Published 24 June 2014
New Journal of Physics 16 (2014) 063057 doi:10.1088/1367-2630/16/6/063057 Abstract
Recommender systems use the historical activities and personal profiles of users to uncover their preferences and recommend objects. Most of the previous methods are based on objects’ (and/or users’) similarity rather than on their difference. Such approaches are subject to a high risk of increasingly exposing users to a narrowing band of popular objects. As a result, a few objects may be recommended to an enormous number of users, resulting in the problem of recommendation congestion, which is to be avoided, especially when the recommended objects are limited resources. In order to quantitatively measure a recommendation algorithmʼs ability to avoid congestion, we proposed a new metric inspired by the Gini index, which is used to measure the inequality of the individual wealth distribution in an economy. Besides this, a new recommen-dation method called directed weighted conduction (DWC) was developed by considering the heat conduction process on a user–object bipartite network with different thermal conductivities. Experimental results obtained for three bench-mark data sets showed that the DWC algorithm can effectively avoid system congestion, and greatly improve the novelty and diversity, while retaining relatively high accuracy, in comparison with the state-of-the-art methods.
Keywords: diffusion, heat conduction, information filtering, bipartite network, congestion, recommender systems
Content from this work may be used under the terms of theCreative Commons Attribution 3.0 licence. Any further distribution of this work must maintain attribution to the author(s) and the title of the work, journal citation and DOI.
1. Introduction
With the rapid development of the internet [1] and the world wide web [2], information has exhibited explosive growth over the past few decades, bringing us into the so-called‘Big Data’ era [3]. Besides the benefits arising from the ever-decreasing costs of data storage and processing, we are also more able to quantitatively characterize the evolution of the internet and human online activities than ever before. Such progress may foster great improvements in information service technologies and thus provide significant social and economic value. To make sense of the data, the most essential problem for both scientific research and business practices is how to evaluate the reliability of information and effectivelyfind the most relevant part within a huge amount of data. Dealing with such questions calls for the further development of advanced, automatic techniques for information filtering.
In comparison to the traditional tools, such as search engines [4] (which require precise keywords) and portals (where the contents are classified by topics), recommender systems provide us with a different way tofilter information and return personalized results to different users. Recommender systems [5] use the historical track record of users’ activities and possibly personal profiles to uncover their preferences and tastes, and, on the basis on these, recommendations are made. These techniques have already found wide applications: sellers carefully study users’ previous purchases and recommend other products that the users may like —to enhance their sales (e.g., Amazon, www.amazon.com); social websites analyze users’ contact information—to help them find new friends and get them hooked into various sites (e.g., Facebook,www.facebook.com); and online radio stations remember skipped songs—in order to serve users better in the future (e.g., Pandora,www.pandora.com). In general, whenever there are plenty of diverse products and customers are not alike, personalized recommendation may help to deliver the right content to the right person.
Although originally a research field dominated by computer scientists, the study of recommender systems has attracted much attention from researchers in other disparate realms and has now also become a topic of interest for mathematicians, physicists and psychologists. Accordingly, various kinds of recommendation algorithms have been proposed, including collaborative filtering [6], content-based analysis [7], spectral analysis [8], iteratively self-consistent refinement [9] and principal component analysis [10]. Very recently, some physical dynamics, including heat conduction [11] and mass (resource) diffusion [12, 13], have also found applications in recommender systems, on the basis of the framework of a bipartite network where there are two groups of nodes that represent users and products, and edges between the two groups that indicate the purchase relationships. These physical approaches have been demonstrated to be both highly accurate and efficient (i.e., to have low computational complexity).
Most previous studies did not consider limited stocks of recommended objects and usually assumed that an object can be recommended to countless users. For example, a song (or a movie) can be simultaneously recommended to an enormous number of users on websites. In this case, the recommender systems are similar to boson gas systems, where one state (object) can be occupied by (recommended to) many particles (different users). The opposite case can be likened to fermions, where one state (object) can only be occupied by (recommended to) one particle (user); a typical example is the classical stable-marriage problem [14] where N men and N women all have their individual preferences and will be matched one to one. However, in real applications, the situations are neither boson nor fermion systems. Sometimes the recommended
objects may have occupancy constraints and thus one cannot satisfy all users’ requirements. For example, many of us will have had bad experiences of waiting for a table in a popular restaurant. This is the situation lying between the above two extremes (bosons and fermions), where an object can be recommended to an intermediate number of users. Inspired by the assignment problem [15], where agents can perform certain tasks with a certain cost and one searches for a bijective agent–task matching that minimizes the sum of the corresponding costs, Gualdi et al [16] proposed a model to address overcrowding in recommender systems by introducing crowd-avoiding recommendations, where each object can be shared by only a limited number of users or where object utility diminishes with the number of users sharing it. This model works on the basis of a priori knowledge of the constraints on each object or the utility function of users. Thus the task is converted to that of solving a constrained optimization problem in which the recommendations for users are simultaneously generated. However, this is far away from the real world, where everything evolves fast, making it difficult to obtain the exact a priori information and solve this problem in a static way.
In this paper, wefirstly introduce the concept of congestion in a recommender system and give a quantitative measurement using the Gini coefficient [17] of the recommendation frequency of objects, to evaluate algorithm performance in avoiding crowding of recommendations. Apart from presenting this new proposed metric, in contrast to Gualdiʼs work, our work proposes a new method based on the heat conduction process on user–object bipartite networks for avoiding congestion without the consideration of any a priori information. In the original heat conduction approach, each node has the same temperature and each link has the same thermal conductivity. That is to say, neither the heterogeneity of nodes nor the difference of links is considered in the systems. However, in practice, a preference usually exists. For instance, new users tend to collect popular objects and the unpopular objects are usually collected by very active users [18]. Taking link heterogeneity into account, we apply the heat conduction process to directed and weighted bipartite networks where the weight of each link is determined by its popularity (i.e., the product of the degrees of its two ends) and a tunable parameterγ regulating the strength of the correlation. Experiments on three benchmark data sets show that our method succeeds in avoiding recommendation congestion, and with the optimal parameter choice it can not only greatly improve the accuracy, in comparison with the original heat conduction method, but also generate more diverse and novel recommendations than state-of-the-art algorithms.
2. The model
A bipartite network provides us with a clear way to present the relations between two groups of entities, such as sexual relationships between men and women, purchase behaviors of customers and ratings given by web users for movies or music. Denote byG U O E
(
, ,)
a bipartite network of a recommender system, whereU ={
u u1, 2, …, um}
andO ={
o o1, 2, …, on}
are the sets of users and objects, respectively. The set E describes the relations between them (e.g., purchase, vote, like, etc). Here, we use italic letters to represent users and Greek letters to represent objects. The corresponding adjacency matrix is denoted by Am n× , where the elementaiα = 1if and only if useruihas collected objectoα, andaiα = 0otherwise. Clearly, the sum of the ith row of A, denoted aski, is the degree of userui(i.e., the number of objects that userui has collected),and the sum of theαth column, denoted askα, is the degree of objectoα(i.e., the number of users who have collected objectoα). The main task of a recommender system is to generate a ranking list of the target userʼs uncollected objects based on the observed information and to recommend the top-ranked objects to the target user.
2.1. Classic diffusion-based methods
Two classic diffusion-based methods have been proposed, respectively inspired by the mass diffusion and heat conduction processes on networks. The former is also called probabilistic spreading (ProbS) in [12]. For a specific user ui, we define an initial resource vector f by assigning each object that has been collected by ui one unit of resource, while others are assigned zero, namely =
α α
f ai . Then ProbS works according to a two-step resource allocation process [19].
Step 1: diffusion from the object side to the user side. The resource owned by an arbitrary object oα will be averagely distributed to oαʼs neighboring users. The first-step
transformation can be written as
∑
= α α α α = g a f k , (1) i n i 1where g is the resource configuration vector of users and the element gi is the resource that user
ui obtained from his or her neighboring objects.
Step 2: diffusion from the user side to the object side. Similarly, the resource of each user will be equally allocated to all of his or her neighboring objects. The transformation process can be described by
∑
= ′ α α = f a g k (2) i m i i i 1where ′f is the new resource vector of objects and the element ′fα indicates the preference score of ui for object oα. Here the basic assumption is that the larger the score, the higher the probability that ui likes oα. Finally, the recommendation list of user ui will be generated by ranking all ofuiʼs uncollected objects in descending order according to their scores. Previous
studies showed that ProbS has higher recommendation accuracy than many well-known methods [5], such as the global ranking method and collaborative filtering. However, due to it focusing on many popular objects rather than niches, ProbS has difficulty in generating diverse recommendations for an arbitrary user and between users. To improve the performance on novelty and diversity, some elaborate algorithms have been proposed [20] and their effectiveness has been shown.
The second classic diffusion-based method is called heat conduction (HeatS) in the literature [21]. HeatS represents a recommendation procedure as similar to heat diffusion on a user–object bipartite network; in it, each object selected by the target user is treated as a heat source with temperature equal to 1 (the temperature remains unchanged), while other uncollected objects are treated as cold points (i.e., at zero temperature). After a few diffusion steps, the cold points will receive some heat sources, according to which the recommendation can be made [11]. In contrast to ProbS, which works by equally distributing the resource to the
nearest neighbors, HeatS redistributes a resource via a nearest-neighbor averaging process in the following two steps.
Step 1: conduction from the object side to the user side.After one step of diffusion from the object side to the user side, a userʼs heat source equals the mean temperature possessed by his or her neighboring objects. Mathematically, this step can be written as
∑
= α α α = g a f k . (3) i n i i 1Here g is the temperature vector of users.
Step 2: conduction from the user side to the object side. In this step, objects receive back the mean of their neighboring users’ heat sources, and the final temperature of objectoαis then given by
∑
= ′ α α α = f a g k , (4) i m i i 1where ′f is the new source vector of the objects. Like ′f for ProbS, the element ′fα here indicates the preference score ofui for object oα. The larger the score, the higher the probability that ui
likesoα. Then those uncollected objects with high temperature will be placed at the top of the target userʼs recommendation list.
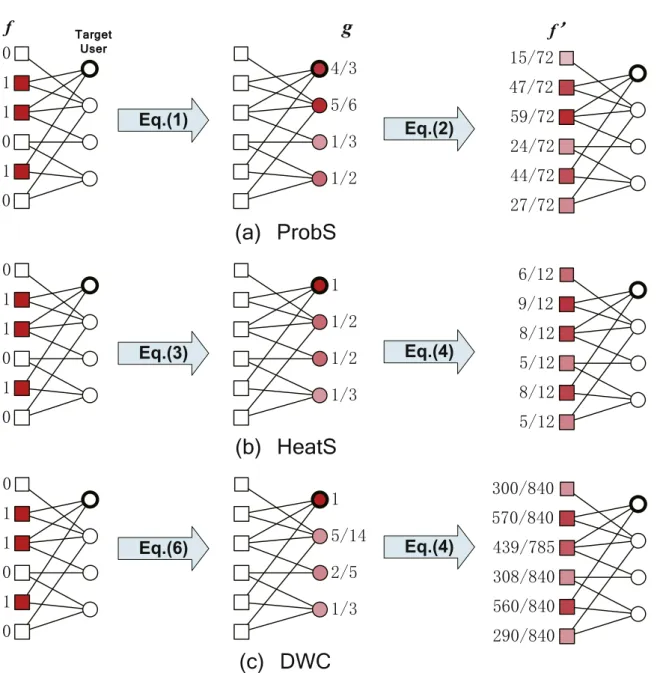
Figure1gives illustrations of ProbS (a) and HeatS (b) as well as our new proposed method (c) which will be introduced in the next subsection. In HeatS, the resource is redistributed via an averaging procedure, in which users receive an amount of resource equal to the mean of the amounts processed by their neighboring objects, and objects then receive back the mean of their neighboring users’ resources. Previous empirical studies showed that niche objects are usually collected by active users [18], who have a higher probability of accessing heat sources. Mathematically, directly from equation (4), we can see that the objectʼs final score is proportional to the reciprocal of the objectʼs degree. As a result, the niche objects are more preferred by HeatS. However, in ProbS, the initial resource of an object is evenly distributed to its neighboring users, and then the userʼs resource will be further evenly distributed to the neighboring objects. Actually, the diffusion is equivalent to a random walk process where the high degree nodes have a higher probability of being visited, and therefore popular objects are more preferred by ProbS. This conclusion is supported by real experiments. That is, the average object degrees of the userʼs recommendation list generated by ProbS are much higher than those given by HeatS (see the novelty of HeatS and that of ProbS in table 1). Clearly, in ProbS the total amount of resources in the whole system remains constant, whereas in HeatS this is not so. Compared with ProbS, HeatS has an advantage in providing diverse recommendations by giving more opportunities to niches rather than popular objects and therefore broadening the users’ vision, just like a concave lens (a metaphor given in [20]). However, the Achilles heel of HeatS is the low recommendation accuracy, which makes this algorithm unlikely to be widely used in real applications. Recently, an advanced algorithm was proposed for improving the accuracy of HeatS, by adding a ground user who was assumed to have collected all objects in the system [22]. Experiments on some benchmark data sets showed that the accuracy can be greatly improved while retaining the diversity.
The accuracy–diversity dilemma is a long-term challenge in recommender systems. An effective solution is to hybridize ProbS and HeatS by introducing a tunable parameter into the
transition matrix normalization [21]. Therefore, the two-step diffusion can be written as follows:
∑
∑
= ′ = α α α α λ λ α α α λ λ = − = − g a f k k f a g k k . (5) i n i i i m i i i 1 1 1 1Obviously, λ = 0 gives the pure HeatS algorithm and λ = 1 gives the ProbS algorithm. This approach was shown to achieve both accurate and diverse recommendations for a suitable choice of the parameter λ.
Figure 1.Illustrations of the ProbS, HeatS and DWC algorithms on user–object bipartite networks. Users and objects are represented by circles and squares, respectively. The target user is labeled with a thick edge. The color of a node indicates its amount of gathered resources at each step. The deeper the color, the greater the amount of resources that it owns. In the DWC method, we set γ = − 1, so ω =α α
−
(
k k)
i i
1
2.2. The directed weighted conduction method
Previous studies mainly focused on accuracy and diversity while neglecting another important factor,‘recommendation congestion’, which becomes serious when the recommended objects are limited resources. For a recommender system, congestion occurs when an object is recommended to an enormous number of users. For example, many people search for a good restaurant for Valentineʼs day; if a restaurant with a limited capacity of only 20 tables is recommend to 100 people, then what will happen? Many of us have had the experience of waiting for a table in a popular restaurant. This is not a successful recommendation: although people like the restaurant (i.e., the recommendation has high accuracy), they cannot get the service. Another typical example is the recommendation of a driving route—if most people choose the shortest paths, a traffic jam may occur on a road of high betweenness. These are just a few of the cases.
To avoid congestion, we propose a method called directed weighted conduction (DWC), by considering the heat conduction process on a user–object bipartite network with different thermal conductivities. Here ‘directed’ means that the thermal conductivity of a link may change depending on the diffusion direction. That is to say, for an arbitrary link, the thermal conductivity of the diffusion from object to user is different from that in the opposite direction. In thefirst step, we assign each link a weight which is proportional to the product of the degrees of the two endpoints, namely wiα =
(
k ki α)
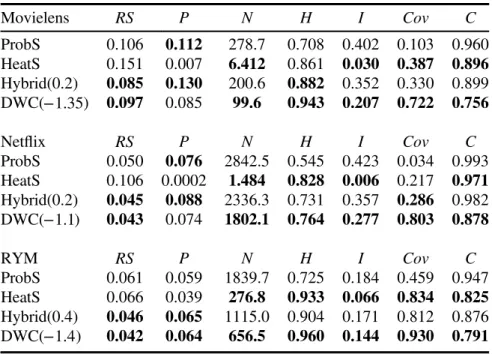
γ, where γ is a tunable parameter. Then the temperature that the users obtain is given byTable 1.The performances of different methods for three data sets, namely Movielens, Netflix and RYM. Here L = 20. For the two parameter-dependent algorithms, the results are obtained with the optimal parameters, subject to the lowest ranking score. The corresponding optimal parameter for each algorithm is labeled in brackets. For the four metrics, RS, N, I and C, the smaller the better, while for the remaining three metrics, the higher the better. The best and second best results for each metric are emphasized in bold. Movielens RS P N H I Cov C ProbS 0.106 0.112 278.7 0.708 0.402 0.103 0.960 HeatS 0.151 0.007 6.412 0.861 0.030 0.387 0.896 Hybrid(0.2) 0.085 0.130 200.6 0.882 0.352 0.330 0.899 DWC(−1.35) 0.097 0.085 99.6 0.943 0.207 0.722 0.756 Netflix RS P N H I Cov C ProbS 0.050 0.076 2842.5 0.545 0.423 0.034 0.993 HeatS 0.106 0.0002 1.484 0.828 0.006 0.217 0.971 Hybrid(0.2) 0.045 0.088 2336.3 0.731 0.357 0.286 0.982 DWC(−1.1) 0.043 0.074 1802.1 0.764 0.277 0.803 0.878 RYM RS P N H I Cov C ProbS 0.061 0.059 1839.7 0.725 0.184 0.459 0.947 HeatS 0.066 0.039 276.8 0.933 0.066 0.834 0.825 Hybrid(0.4) 0.046 0.065 1115.0 0.904 0.171 0.812 0.876 DWC(−1.4) 0.042 0.064 656.5 0.960 0.144 0.930 0.791
∑
∑
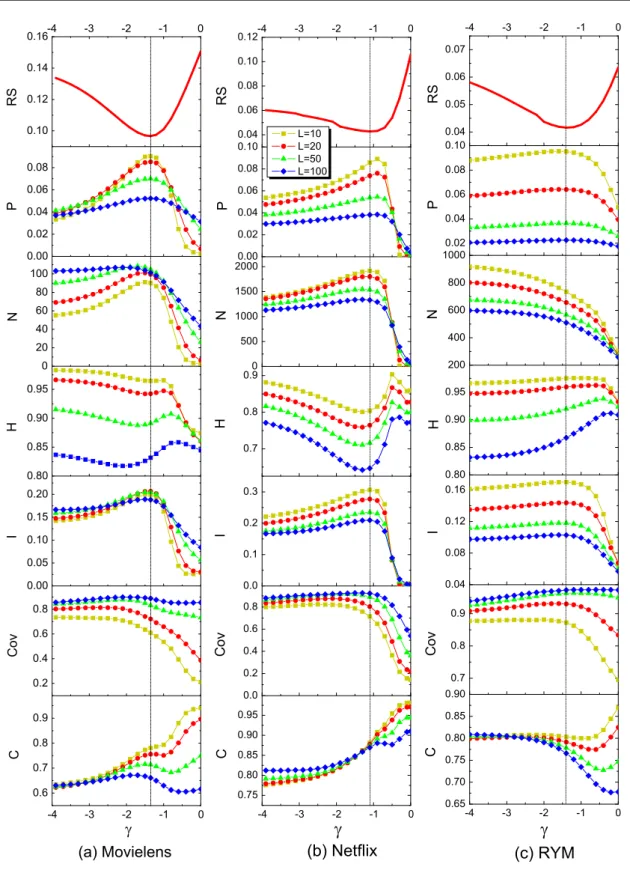
= α α α α α α α = = g w a f w a . (6) i n i i n i i 1 1In the second step, we can also introduce another parameter by means of whose tuning the accuracy can be further improved. However, after investigating the dual-parameter-dependent algorithmʼs performance, we found that the recommendation accuracy is not sensitive to the parameter of the second step, and the optimal case is obtained when the second parameter is around 0 (see the discussion in Appendix A). Therefore, in the second step, we directly adopt the unweighted heat conduction process that has been described in equation (4). Clearly, as we are setting γ = 0 in the second step, the weights of the links are identical. Note that the essential difference between the first-step diffusion and the second-step diffusion lies in the initial resource distribution. In thefirst step, the objectʼs initial resource is independent of the objectʼs degree. However, it is obvious that the selection of unpopular objects better reflects the userʼs personal taste and therefore should be emphasized. That is why we consider a weighted version with a negative parameter in the first step. Unlike in the first step, in the second step of diffusion, the users’ initial resources generated from the first step have already been negatively correlated with the users’ degrees, namely users with higher degrees have lower initial resources. This decreasing relation is in accordance with the form that we adopted in the first step. Although we can still use a parameter-dependent form in the second step, the improvement is extremely limited (see the results in Appendix A). Besides this, when γ > 0, the novelty of DWC is lower than that of HeatS, indicating that in this case the algorithmʼs preference for unpopular objects is increased. However, when γ > 0, the recommendation accuracy is even worse than that of HeatS (where γ = 0), which makes the recommendation useless. Therefore, due to the bad performance of DWC with γ > 0, we will not show the results for this case.
Experiments on benchmark data sets show that on tuning the parameterγ, DWC gives the highest accuracy subject to choosing the optimal parameter γ* at which the novelty and diversity can be greatly improved in comparison with the hybrid algorithm. Most importantly, DWC succeeds in avoiding congestion and performs even better than HeatS, which is intuitively expected to be of low congestion. Infigure1(c) we present an example of how DWC works. One can make a comparison with ProbS and HeatS, shown infigure1(a) andfigure1(b) respectively. Although both the hybrid method and the DWC method are trying to relieve the bias on unpopular objects of HeatS, their difference is obvious. DWC considers the weighted form of the heat conduction process, while the hybrid method directly combines ProbS and HeatS, so DWC has a clear intuitive physical interpretation, and the parameter of DWC relates to the conductivity of the link during the heat conduction process, while it is difficult to explain the hybrid method in terms of a physical process. The experimental results suggest that DWC outperforms the hybrid method in terms of novelty, diversity, coverage and congestion while retaining high accuracy.
3. Data and metrics 3.1. Data sets
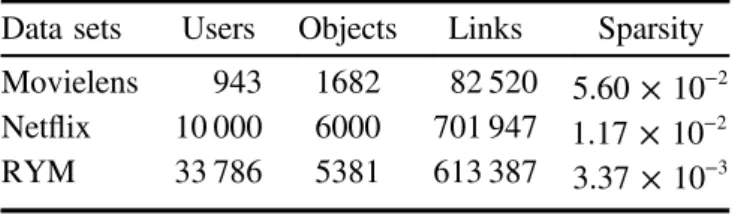
Three different benchmark data sets are used to test the algorithm performance, as follows: (i) Netflix: a randomly selected subset of a huge data set released by the DVD rental company Netflix for its Netflix Prize (www.netflixprize.com) [23]; (ii) Movielens: a movie rating data set which is provided by the GroupLens project at the University of Minnesota and can be downloaded from their website www.grouplens.org; (iii) RYM: a music rating data set which is collected by downloading publicly available data from the music ratings website www. RateYourMusic.com. In the original data sets, explicit ratings in Netflix and Movielens are given on the integer scale from 1 to 5 (i.e., worst to best), while they are rated from 1 to 10 for RYM; here we only consider ratings no less than 3 for Netflix and Movielens and ratings larger than 5 for RYM, to construct the network. Table 2 summarizes the statistical features of the three data sets.
3.2. Evaluation metrics
To test each algorithm performance, the data set is randomly divided into two parts: the training set ET contains 90% of the links and the probe set EP contains the remaining 10% of the links. The training set is treated as known information, while no information from the probe set is allowed to be used for recommendation. Note that only a user who has at least one link in the probe set will be considered when calculating the metrics. We apply six conventional metrics and our new proposed metric to evaluate algorithm performance from different aspects.
(i) Accuracy: accuracy is of prime importance when evaluating an algorithmʼs performance. Accurate methods would provide good recommendation lists where the objects that the target user likes are ranked in the top places. The ability of a recommendation algorithm to rank users’ preferable objects in higher places than the disliked ones can be measured by the ranking score (RS). For a target userui, a recommendation list is generated by ranking all his or her uncollected objects (including collected objects in the probe set) in descending order. The ranking score measures the relevant rank of each hidden object (i.e., objects in the probe set for userui) in his or her recommendation. For example, if a hidden objectoα is ranked r inuiʼs list,
then its ranking score equals RSiα = r
(
n − kiT)
, where kiT is the degree of user ui in(
)
G U O E, , T . The denominator includes bothuiʼs uncollected objects and his or her collected
but hidden objects. The mean ranking score of the whole system can be obtained by averaging
RS over all of the hidden user–object relations, namely
Table 2.Statistical properties of the three data sets used for testing. Data sets Users Objects Links Sparsity
Movielens 943 1682 82 520 × − 5.60 10 2 Netflix 10 000 6000 701 947 × − 1.17 10 2 RYM 33 786 5381 613 387 × − 3.37 10 3
∑
= α α ∈ RS E RS 1 , (7) P i E i Pwhere αi denotes the probe link connectingui andoα. Clearly, the smaller the ranking score, the higher the algorithmʼs accuracy, and vice versa.
In practice, since it is difficult for users to check all possible candidates in their recommendation lists before making a decision, the top-ranked objects are more likely to attract attention and, if predicted correctly (collected by the user), will contribute further to the accuracy. Thus a more practical approach is to focus on the top L places and to check how many objects are recommended correctly (i.e., in the probe set). Precision is the most popular metric defined in this way. For a target user ui, the precision P Li
( )
is defined as=
( )
( )
P L d L L , (8) i iwhere d Li
( )
is the number of uiʼs hidden objects (objects collected by ui and present in the probe set) in the top L places of his or her recommendation list. Averaging the individual precision values over all users with at least one hidden object, we obtain the mean precision of the system. Clearly, the higher the precision, the better the recommendation algorithm performance.(ii) Novelty: novelty quantifies the capacity of an algorithm to generate novel and unexpected recommendations which may be greatly contributed by less popular objects (i.e., objects with low degree) that are unlikely to be known previously. It can be simply measured as the average degree of the recommended objects. Specifically, for a target userui with the top-L recommendation list denoted by Li, his or her novelty is defined as [24]
∑
= α α ∈( )
N L L k 1 . (9) i LiAveraging over all users’ Ni values, we obtain the systemʼs mean value of the novelty. (iii) Diversity: unlike novelty, which refers to how different the recommended objects are with respect to what the users have already seen before, diversity refers to how different the recommended objects are with respect to each other. There are two types of diversity. One is called inter-diversity, which measures how different the recommended lists are between users. Given two different usersui and uj, taking inspiration from the Hamming distance between two strings, we can calculate inter-diversity in a similar way, as
=
( )
( )
H L D L L , (10) ij ijwhereD Lij
( )
is the number of distinct objects in their recommendation lists. If the objects inuiʼsand ujʼs lists are completely the same,Hij = 0, while if there is no common object in their lists, thenHij = 1. Clearly, the higher the value, the more personalized the recommendation given to the users. Averaging all pairs of users’ inter-diversities, we obtain the systemʼs mean value.
Another diversity metric is called intra-similarity, and is used to measure the diversity of the objects in one userʼs recommendation list. A good algorithm is expected to not only give diverse recommendations among users (i.e., have high inter-diversity), but also provide different kinds of objects for a single user. For a target userui, whose top-L recommendation list
is Li=
{
o o1, 2,...oL}
, the intra-similarity is defined as∑
= − α β∈ α β≠ αβ( )
(
)
I L L L s 1 1 , (11) i L o , i,wheresαβo is the similarity between objectsoαando . Many similarity indices have been proposedβ
[25,26]; here we consider the cosine similarity, which has been extensively used in the previous literature and is defined as
∑
= αβ α β α β = s k k a a 1 . (12) o l m l l 1(iv) Coverage: coverage measures the percentage of objects that an algorithm is able to recommend to users. It can be calculated as the ratio of the number of distinct objects in the users’ lists to the total number of objects in the system, which reads
∑
δ = α α = Cov n 1 , (13) n 1where δ =α 1 only if objectoαis recommended to at least one user (i.e.,oαappears in at least one userʼs list), and otherwise δ =α 0; also, n is the total number of objects in the system. Undoubtedly, recommendations that are centralized on popular objects will result in low coverage, which is not expected for systems that aim at providing diverse recommendations.
(v) Congestion: the concept of congestion in recommender systems has never been discussed before and this should have been taken into account as an important aspect for evaluating an algorithmʼs performance when the recommended objects are limited resources. Congestion occurs when a few distinct objects are recommended to numerous users. As a result, the users who fail to seize the limited objects, such as those who suffer a long waiting time for service in restaurants orfind that items are out of stock on e-commerce websites, will have bad experiences and may lose confidence in the recommender system. To quantify an algorithmʼs ability to avoid congestion in a recommender system, we propose an index named the congestion, C, inspired by the famous Gini index which was used to measure the inequality of individual wealth distribution in an economy. Firstly, we rank the n objects in ascending order according to the number of times that they are recommended in all users’ lists. The objects that do not appear in any userʼs list will have the top ranking. The Lorenz curve is denoted by R(x), namely the normalized cumulative number of times of recommendation, and x is the normalized rank in the range [0, 1]. Then the congestion (Gini index) is actually equal to twice the area between the upward sloping diagonal and the Lorenz curve, which reads mathematically
∫
= −
( )
C 1 2 R x d .x (14)
0 1
Clearly, C = 0 corresponds to the state where all objects have the same probability of being recommended to users. The congestion metric is a new application of the Gini coefficient (in discrete form) to recommender systems. Note that diversity and congestion are two different metrics for evaluating recommendation performance. Diversity measures the difference between users’ recommendation lists (inter-diversity) or the difference between objects within a userʼs recommendation list (intra-diversity) from the microscopic point of view, while congestion reflects the macroscopic statistical property of recommendation uniformity.
Figure 2.The performances of DWC according to all seven metrics versusγ for three data sets. Each data point is obtained by averaging ten runs, each of which has an independently random division into a training set and a probe set. The dashed lines in the graphs correspond to the optimal parameters, namely, γ = − 1.35 for Movielens,
4. Results
The recommendation performances, measured by using seven metrics, of four methods for three data sets are summarized in table 1. Each data point is obtained by averaging over ten independent runs. For the two parameter-dependent algorithms, namely the hybrid and DWC methods, the results presented are obtained with the optimal parameters, subject to the lowest ranking scores. We have tested for many different values of L, and table 1 takes L = 20 as a typical example. To show more detailed properties of DWC, the dependence of the performances measured by using the seven metrics on the parameter γ with different values of L for three data sets are shown in figure 2.
Accuracy is always the first consideration in evaluating a recommendation algorithmʼs performance. Comparing the results from the four methods, we can see that the two parameter-dependent algorithms (i.e., the hybrid and DWC ones) outperform the other two parameter-free algorithms (i.e., ProbS and HeatS) on accuracy. Generally, DWC can provide the best or very nearly the best accuracy, as measured by the ranking score. Specifically, compared with that of ProbS, the ranking score can be reduced by 8.49% for Movielens, 14% for Netflix and 31.15% for RYM. The sparser the network, the larger the reduction that can be obtained. When this comparison is against HeatS, the reductions are further enlarged, to 35.76% for the Movielens data set, 59.43% for the Netflix data set and 36.36% for the RYM data set.
Besides accuracy, novelty and diversity are two other important metrics. Previous studies have shown that the original HeatS approach prefers unpopular objects. From table1, it is clear that HeatS has the highest capacity for generating novel and unexpected recommendations, which can be demonstrated by the very small average degrees of the recommended objects (i.e., the novelty metrics): N 20
( )
= 6.412 for Movielens, N 20( )
= 1.484 for Netflix, and=
( )
N 20 276.8 for RYM. However, this method is rarely used alone in view of its extremely low accuracy. One effective way to relieve the bias of HeatS for unpopular objects is to combine it with ProbS, which has been demonstrated to be of high accuracy but low novelty and diversity. The results from this hybrid method given in table 1 show that the recommendation accuracy can be significantly improved by using the hybrid method, while retaining relatively high novelty and diversity. Our DWC algorithm provides another way of relieving the bias of the preference for unpopular objects by employing a weighted form in the first diffusion step of HeatS. Compared with the hybrid algorithm, our DWC method, taking into account a heat conduction process with different thermal conductivities, can further improve the novelty (measured by N) and diversity (measured by H and I). It provides results with a novelty close to that of HeatS and with accuracy close to that of ProbS. That is to say, DWC has a greater ability forfinding niche (unpopular) objects that the users like, and giving more personalized recommendations to target users. Besides the improvement of the metrics, DWC provides clearer physical insights than the hybrid method, which is difficult to interpret in terms of any physical process.
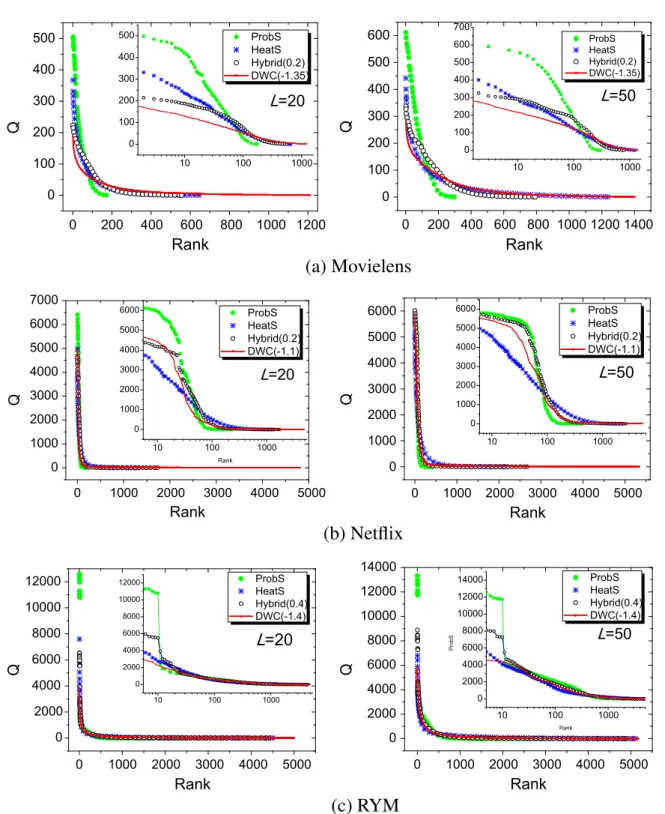
To give more evidence of the novel and diverse recommendations of DWC, we compare the algorithms according to the number of times of recommendation of objects that appear in at least one userʼs list. Specifically, for a given algorithm, we collect the top L recommended objects for each user. We denote by d the number of distinct objects among all the recommended objects. Obviously, the ratio of d to n equals the coverage of the algorithm. Then we rank the d objects according to their numbers of times of recommendation, denoted byQi
Figure 3.Relationships among the number of times of recommendation, Q, of objects and their ranks for three data sets. The insets of the six subfigures each show Q against the logarithm of the corresponding rank. Each data point is obtained by averaging the number of times of recommendation of corresponding ranks over ten independent runs.
( =i 1, …, d), in decreasing order. The relationships between Q and the ranks are shown in figure 3. We have tested for many different values of L, and here take L = 20 and L = 50 as typical examples. Fromfigure3, wefind that DWC has the highest d for all three data sets. That is to say, DWC provides a larger number of distinct objects to users than the other three algorithms. For example, in the top-20 case, for the Movielens data, ProbS can only recommend 174 distinct objects (10.3% of the total number of objects), and even HeatS, which has the highest novelty, can only recommend 650 distinct objects—no more than 40% of the total number of objects, while DWC increases this number to 1214, covering more than 70% of the objects in the data set. For Netflix data, more than 80% of the distinct objects can be recommended through the DWC algorithm; this number exceeds that for the second-best method, the hybrid one, by 180.6%. For RYM data, almost every object has a chance of being recommended by DWC (its coverage equals 0.93). In addition to its poorer coverage, ProbS has curves that are notably steeper than for the other three methods. Taking the Movielens case, for example (the case L = 20), the top-ranked object is recommended over 500 times and 12 objects are recommended over 400 times each by ProbS. Since there are only 943 users in this data set, this means that each of these movies is recommended to nearly half of the users. Moreover, the number of objects that are recommended over 400 times will increase with the increase of the recommendation list length L. By contrast, the curves of DWC slope more gently than those for other algorithms. For the case L = 20 for the Movielens data set, the most frequently recommended object is recommended to only 187 users, and there are only 26 objects recommended over 100 times, indicating that with the DWC algorithm, users are more likely to be recommended different objects. In other words, DWC can provide more personalized recommendations.
The congestion is a newly proposed index, which should have been taken into account as an important aspect for evaluating recommender systems, especially when the resources (i.e., objects) are limited. From table 1, we find that DWC is the best method for avoiding congestion, as indicated by it having the lowest C values for all three data sets. HeatS is the second best, followed by the hybrid method. ProbS is the poorest, since it overwhelmingly focuses on popular objects rather than niches. Compared with HeatS, the second-best method, DWC, decreases congestion
(
L = 20 by 15.6% for the Movielens data set, 9.6% for the Net)
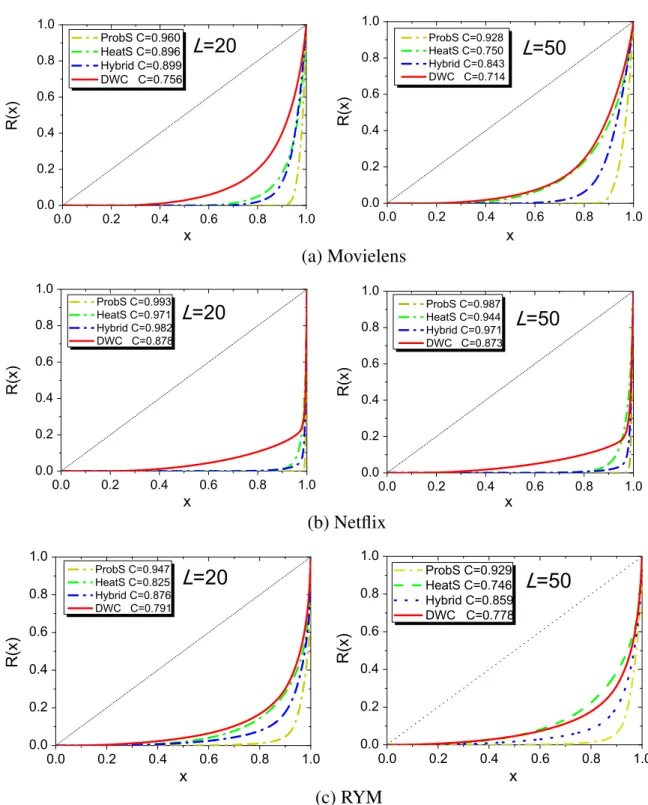
flix data set and 4.1% for the RYM data set. A more intuitive portrait of the improvement is given in figure 4, where the Lorenz curves for the four methods are presented. The value of the congestion is twice the area between the upward sloping diagonal and the Lorenz curve. Clearly, ProbS gives the most bent curve, resulting in the largest congestion value. The Lorenz curve given by DWC is generally the closest to the upward sloping diagonal, leading to the smallest area. Although with the increasing of L, the congestion of HeatS can be decreased, we still cannot say that HeatS is a good algorithm due to its very low accuracy. Therefore, with all the metrics considered, DWC performs best.5. Conclusion
Like traffic jams in transportation systems, congestion exists in recommendations when the number of cases of wanting either a product or a kind of service exceeds the occupancy constraint. This should be seriously considered in recommender systems, where the objects are limited resources. To investigate the congestion phenomenon in recommender systems, we
Figure 4.The Lorenz curves for different methods for three data sets. Each data point is obtained by averaging ten runs, each of which has an independently random division into a training set and a probe set. For the hybrid and DWC algorithms, the curves are presented for the optimal parameters, subject to the lowest ranking scores; see the exact values of the optimal parameters in the legends of figure 3. We consider L = 20 and L = 50 as typical examples. The values of the congestion (abbreviated as C) are given in the figure legends.
proposed a new metric, named the congestion, C, inspired by the Gini index, for evaluating an algorithmʼs ability to avoid crowding. Experiments on three benchmark data sets, namely the Movielens, Netflix and RYM sets, showed that the classic ProbS algorithm, focusing on popular objects rather than niches, results in high congestion, while the HeatS algorithm can avoid crowding to some extent but with very low accuracy. The hybrid method performs better overall than ProbS and HeatS but yields poor coverage of recommendations. To obtain accurate recommendations with high diversity, novelty and coverage but low congestion, we considered the heat conduction process on a directed user–object bipartite network, where the links were assigned different thermal conductivities. Compared with the state-of-the-art methods, our new proposed algorithm performs best in avoiding congestion and can also greatly improve the coverage of recommendations (e.g., for Netflix the coverage of our method exceeds that of the second-best algorithm by 180.6%). Meanwhile, our method can provide more diverse and novel recommendations than the hybrid method while retaining high accuracy.
The main contribution of this study is twofold. Firstly, the new congestion C evaluation metric was proposed for quantitatively measuring a recommendation algorithmʼs ability to avoid congestion. This index complements the evaluation system of recommendation algorithms. Secondly, the new recommendation method called directed weighted conduction was developed by considering the heat conduction process on a user–object bipartite network with different thermal conductivities. This new method outperforms the state-of-the-art algorithms. The success of the new method indicates that physics can greatly contribute to the development of information science. This study provides new insights into the related scientific problems and should aid in the development of the next generation of recommender systems, which emphasize the importance of users’ experiences in real world applications, rather than merely pursuing high accuracy in offline testing.
Acknowledgments
We thank Chuang Liu and Yanbo Zhou for providing the programs for evaluating the metrics, and Kuan Fang for helpful discussions. This work was supported by the National Natural Science Foundation of China (grant nos 11205042 and 11305042) and the Zhejiang Provincial Natural Science Foundation of China (grant nos LY12A05003 and Y6110317). LL acknowledges the research start-up fund of Hangzhou Normal University (grant no. PE13002004039) and the CCF-Tencent Open Research Fund.
Appendix A. An experiment on dual-parameter-dependent DWC
In the diffusion methods, we consider two diffusion steps. Thefirst step is from the object side to the user side, and the second step is from the user side to the object side. This two-step diffusion can be in principle controlled by two distinct parameters. We investigate here the effects of these two parameters on the recommendation accuracy. Three data sets are considered, namely the Movielens, Netflix and RYM sets, which were introduced in the data sets section. FigureA1shows the ranking scores in the two-parameter planes for the three data sets. For all three data sets, the recommendation accuracy is not sensitive to the parameter in the second step, and the optimal case is obtained when the second parameter is around 0. Therefore, on the basis of the above results, in the DWC algorithm we directly set the parameter of the
Figure A1. The ranking scores of the dual-parameter-dependent DWC method. The numerical simulations run over the parameters in the interval [−2, 2] with the step length equal to 0.2. Each point is obtained by averaging over ten independent runs.
second diffusion step equal to 0, namely we adopt an unweighted heat conduction process in the second step; see the mathematical expression in equation (4).
References
[1] Zhang G Q, Zhang G Q, Yang Q F, Cheng S Q and Zhou T 2008 New J. Phys.10123027
[2] Broder A, Kumar R, Maghoul F, Raghavan P, Rajagopalan S, Stata R, Tomkins A and Wiener J 2000 Comput. Netw.33309
[3] Mayer-Schönberger V and Cukier K 2013 Big Data: A Revolution that Will Transform How We Live (Boston: Houghton Mifflin Harcourt) p 1 (www.goodreads.com/book/show/15815598-big-data)
[4] Hanani U, Shapira B and Shoval P 2001 User Model User-Adap.11203
[5] Lü L, Medo M, Yeung C H, Zhang Y-C, Zhang Z-K and Zhou T 2012 Phys. Rep.519 1
[6] Herlocker J L, Konstan J A, Terveen L G and Riedl J T 2004 ACM T. Inform. Syst.225
[7] Pazzani M J and Billsus D 2007 The Adaptive Web4321325
[8] Maslov S and Zhang Y-C 2001 Phys. Rev. Lett.87248701
[9] Ren J, Zhou T and Zhang Y-C 2008 Europhys. Lett.8258007
[10] Goldberg K, Roeder T, Gupta D and Perkins C 2001 Information Retrieval4 133
[11] Zhang Y-C, Blattner M and Yu Y-K 2007 Phys. Rev. Lett.99154301
[12] Zhou T, Ren J, Medo M and Zhang Y-C 2007 Phys. Rev. E76046115
[13] Zhang Y-C, Medo M, Ren J, Zhou T, Li T and Yang F 2007 Europhys. Lett.8068003
[14] Laureti P and Zhang Y-C 2003 Physica A32449
[15] Burkard R E, DellʼAmico M and Martello S 2009 Assignment Problems revised reprint (Philadelphia: Siam) p 1
[16] Gualdi S, Medo M and Zhang Y-C 2013 Europhys. Lett.10120008
[17] Slottje D J and Raj B 1998 Income Inequality, Poverty, and Economic Welfare (New York: Physica-Verlag HD) p47
[18] Shang M S, Lü L, Zhang Y-C and Zhou T 2010 Europhys. Lett.9048006
[19] Liu W and Lü L 2010 Europhys. Lett.8958007
[20] Lü L and Liu W 2011 Phys. Rev. E83066119
[21] Zhou T, Kuscsik Z, Liu J-G, Medo M, Wakeling J R and Zhang Y-C 2010 Proc. Natl. Acad. Sci. USA107 4511
[22] Zhou Y, Lü L, Liu W and Zhang J 2013 PLoS ONE8 e70094
[23] Bennett J and Lanning S 2007 Proc. KDD Cup and Workshop 2007 35 ( wwww.cs.uic.edu/~liub/KDD-cup-2007/proceedings/The-Netflix-Prize-Bennett.pdf)
[24] Zhou T, Jiang L-L, Su R-Q and Zhang Y-C 2008 Europhys. Lett.8158004
[25] Zhou T, Lü L and Zhang Y-C 2009 EPJ B71623
![Figure A1. The ranking scores of the dual-parameter-dependent DWC method. The numerical simulations run over the parameters in the interval [−2, 2] with the step length equal to 0.2](https://thumb-eu.123doks.com/thumbv2/123doknet/15018202.682152/18.892.209.537.175.1037/figure-ranking-parameter-dependent-numerical-simulations-parameters-interval.webp)
