Quantitative characterization of chemical degradation of heat-treated wood surfaces during artificial weathering using XPS
Duygu Kocaefe*1, Xianai Huang1, Yasar Kocaefe1, Yaman Boluk2
1Université du Québec à Chicoutimi, Canada
555, boul. de l’Université, Chicoutimi Québec Canada G7H 2B1
2University of Alberta, Canada
3-142 Markin/CNRL Natural Resources Engineering Facility Edmonton, Alberta, Canada T6G 2W2
*Corresponding author: Tel.:+1- 418-545 5011-5215; fax: +1-418-545-5012 Email address: [email protected]
Abstract
The XPS (X-ray photoelectron spectroscopy) study of three heat-treated North American wood species (jack pine, birch and aspen) was carried out to evaluate chemical modifications occurring on the wood surface during artificial weathering for different times. The results suggest that the weathering reduces lignin content (aromatic rings) at the surface of heat-treated wood, consequently, the carbohydrates content increases. This results in surfaces richer in cellulose and poorer in lignin. Heat-treated wood surfaces become acidic due to weathering and the acidity increases as the weathering time increases. Three possible reasons are given to account for the increase of acidity during weathering. The lignin content increases whereas the hemicelluloses content decrease due to heat treatment. Heat-treated woods have lower acidity to basicity (A/B) ratios than the corresponding untreated woods for all three species because of the decrease in carboxylic acid functions mainly present in hemicelluloses. The wood composition changes
induced by weathering are more significant compared to those induced by heat treatment at wood surface. Exposure to higher temperatures causes more degradation of hemicelluloses and this characteristic is maintained during weathering. However, the wood direction has more effect on chemical composition modification during weathering compared to that of heat treatment temperature. The heat-treated jack pine is affected most by weathering followed by heat-treated aspen and birch. This is related to differences in content and structure of lignin of softwood and hardwood. The use of XPS technique has proved to be a reliable method for wood surface studies.
Keywords: Heat-treated wood, artificial weathering, chemical composition, XPS, ratio of oxygen
1. Introduction
Increased environmental demand resulted in development of wood heat treatment at high temperature as an alternative to traditional wood preservation techniques [1]. Heat-treatment process does not require any chemical addition to modify wood. Heat-treated wood is natural wood heated to temperatures of 160–230˚C, usually above 200˚C, depending on the species used and the desired material properties [2]. Heat-treated woods have been used for outdoor applications because of their new properties such as reduced hygroscopy, higher dimensional stability, improved decay resistance, and attractive dark color. Wood heat treatment has widely spread in the last few years as an industrial process [3]. A number of studies have examined extensively the chemical transformations of high temperature treated wood [4-8]. The chemical properties and characteristics of heat-treated wood surfaces differ strongly from those of untreated wood as a result of chemical changes occurring during heat treatment.
In outdoor applications, heat-treated wood which is a biological natural product subjected to various environmental conditions. This results in various surface degradations such as surface roughening, checking of surfaces and color changes in varying degrees. The surface structure and the surface composition changes of heat-treated wood during weathering are of significant practical concern since those properties are important for development of coatings which can delay the surface degradation due to UV exposure. If heat-treated woods are to have a long service life, the weathering process and the accompanied changes in the chemistry of their surfaces must be understood. The information about the chemical properties on the heat-treated wood surface is necessary in order to evaluate the influence of the weathering process on this product. Considerable research has been carried out on the chemical and physical changes of untreated wood during weathering [9-13]. Untreated wood color changes during weathering
because of the photo-degradation of lignin and wood extractives [14]. α-carbonyl, biphenyl and ring-conjugated double bond structures in lignin can absorb UV-light and react with oxygen to form chromophoric groups as carbonyl and carboxyl groups [15, 16]. Absorption of UV light results in breakage of weak chemical bonds which may lead to fading and cracking of untreated wood [13].The photo degradation of wood is a surface phenomenon. Hon and his co-workers reported the surface chemical composition of wood exposed to outdoor weathering and to UV irradiation and revealed that weathering induced oxidation reaction on wood surface and changed the chemical composition [17].
An investigation method suited for characterizing changes of the chemical composition of a wood surface is X-ray photoelectron spectroscopy (XPS). This technique covers the subsurface to a depth of about 10nm, providing information on the chemical states, surface chemical composition as well as the location of atoms types with the samples [17, 18]. It has been previously used to analyse the changes of wood surface after different treatments [19, 20] and to differentiate between softwood and hardwood [21]. Its application to the surface analysis of heat-treated wood without exposure to weathering [22] as well as weathered untreated wood [17] have been reported. To our knowledge, however, XPS investigations on weathered heat-treated wood surfaces are rare and there is no comparative study on the chemical composition modifications of the untreated and heat-treated species studied induced by artificial weathering. In this study, the changes in surface chemistry of heat-treated North American jack pine (Pinus banksiana), aspen (Populus tremuloides), and birch (Betule papyrifera) occurring during artificial weathering were investigated using XPS spectroscopy. In addition, the XPS characterization of changes in surface chemical composition was also used in order to study the effect of heat treatment conditions.
Furthermore, a quantitative study on the acid-base properties of heat-treated wood during artificial weathering using XPS technique is currently lacking in the literature. The acid-base properties of wood have a significant influence on the behavior of wood surface in contact with any liquid [21]. Determination of these properties provides a sound foundation for development of coatings and improvement of adhesion properties of heat-treated wood surface. According to Fawkes [23], the acid-base properties can be quantitatively characterized by XPS. The Holmes-Farley and Whitesides [24] divided the interfaces into three regions and they emphasized that XPS technique penetrates the subsurface to a about 10 nm depth and offers an opportunity to analyze the specific groups in the second region near the surface together with those in the outermost layer [24], in other words, to detect both the surface and the subsurface. Therefore, XPS was also used during this study for characterization of the acid-base properties in the subsurface of heat-treated woods exposed to artificial weathering.
2. Material and methods
2.1. Material
The following three species, one softwood and two hardwood, which are commonly used for outdoor applications in North America, were studied: jack pine (Pinus banksiana), aspen (Populus tremuloides), and birch (Betule papyrifera). Wood boards of approximately 6500 × 200 × 30 mm were heat-treated under different conditions in a prototype furnace of University of Quebec at Chicoutimi (UQAC), Quebec, Canada. Table 1 shows the conditions used during the heat treatments. Then, they were subjected to artificial weathering. Untreated wood boards, kiln dried with the final moisture content of about 12%, were also exposed to artificial weathering along with specimens heat-treated at high temperatures for comparison purposes. Specimens
20°C and 40% relative humidity (RH) until they were exposed to the artificial weathering and the XPS characterization tests described below.
Specimens of 70 × 65 mm cross-section on longitudinal surfaces and 20 mm in length were cut from sapwood of heat-treated and untreated wood, and then planed to have smooth surfaces. The prepared specimens of 70 × 65 × 20 mm were used in artificial weathering tests. The color evaluation was carried out on both longitudinal tangential surface ( LT ) and longitudinal radial surface (LR) of the wood samples.
2.2. Artificial weathering tests
Artificial weathering tests were conducted at the Laval University in collaboration with FPInnovation. The samples were exposed to UV light using a commercial chamber, Atlas Material Testing Technology LLC (USA) Ci65/Ci65A Xenon Weather-Ometer. A controlled irradiance water-cooled xenon arc with a CIRA inner filter and a Soda outer filter was used as the source of radiation to simulate sunlight. Tests were performed according to Cycle 1 of Standard ASTM G155: 102 min Xenon light, 18 min light and water spray (air temperature is not controlled) without dark cycle to simulate rain during natural weathering. The black panel temperature was set to 63±3˚C and the irradiance level was 0.35W/m2 at 340 nm. Heat-treated samples and untreated control samples of each species were exposed to UV light. The irradiation was interrupted after 72, 672 and 1512 hours of exposure and samples for each set of experimental conditions were taken out for evaluation of surface chemical properties.
2.3. XPS spectroscopy analysis
Small wood chips (approximately 10 mm × 10 mm of exposed surface and 1mm in thickness) were cut with a cutter blade from heat-treated and untreated wood surfaces of three species
avoiding all contact with bare hands, and the samples were immediately placed in the vacuum plastic bags. The XPS measurements were performed on AXIS Ultra XPS spectrometer (Kratos Analytical) at the Alberta Centre for Surface Engineering and Science (ACSES), University of Alberta. The base pressure in the analytical chamber was lower than 2 x 10⁻⁸ Pa. Monochromated Al Kα (hν = 1486.6 eV) source was used at a power of 210 W. The resolution function of the instrument for the source in hybrid lens mode was 0.55 eV for Ag 3d and 0.70 eV for Au 4f peaks. The photoelectron exit was along the normal of the sample surface. The analysis spot was 400×700 um. Charge neutralizer was used to compensate for sample charging during the analysis. The survey scans spanned from 1100 to 0 eV binding energy, they were collected with analyzer pass energy (PE) of 160 eV and a step of 0.35 eV. For the high-resolution spectra, the pass-energy of 20 eV with a step of 0.1 eV was used. CASA software was utilized in the data processing. A linear background was subtracted from each peak. Then the peak area was evaluated and scaled to the instrument sensitivity factors. The composition was calculated from the survey spectra with sum of all peaks after scaling equal to 100 %. The spectra fitting and component analysis were performed using the high-resolution spectra. The number of components and their binding-energy positions (shown in Table 2 below) were taken from Inari
et al. and Ahmed et al. [25, 26]. The peak widths (FWHM) of the fitted components were determined in the range of 1.1-1.5 eV for C1s and 1.4-1.8 eV for O1s.
3. Results and discussion 3.1. XPS analysis
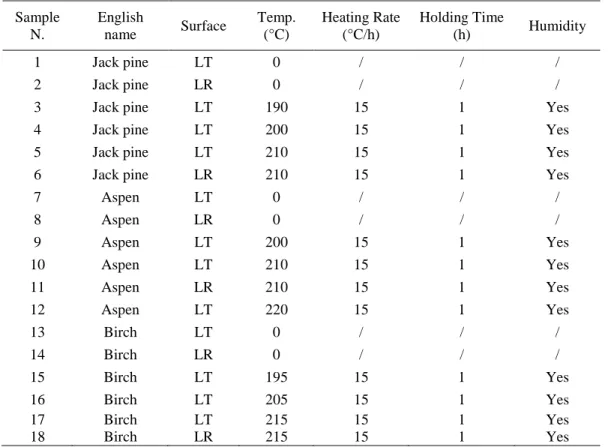
The typical XPS survey spectra of heat-treated and untreated birch wood samples before and after artificial weathering for 1512 h are shown in Fig. 1 (a-c), respectively. The survey spectra of the heat-treated and untreated jack pine and aspen exhibit the similar findings. Results of birch
were chosen to analyze. Both the spectra of untreated (see Fig. 1 (a)) and heat-treated samples (see Fig. 1 (b)) reveal presence of carbon, oxygen and small amounts of nitrogen as expected. It can be seen from the comparison of the survey spectra of heat-treated samples before and after weathering that the carbon C1s peak decreases and the oxygen O1s peak increases as a result of weathering. In this analysis, the focus was on the resolution of the C1s peak and O1s peak since these were the two elements found to be present in noticeable amount. Other elements presented lower peaks indicating that they have very low concentrations at the surface of the samples investigated in this study.
3.1.1. O/C ratios
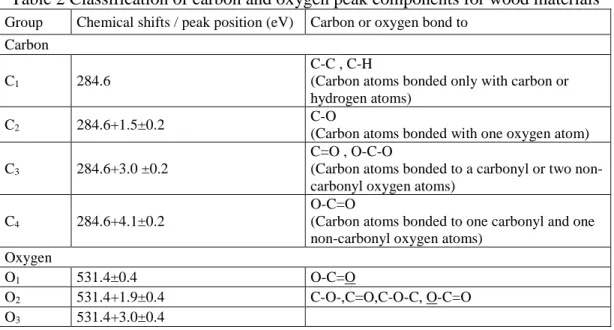
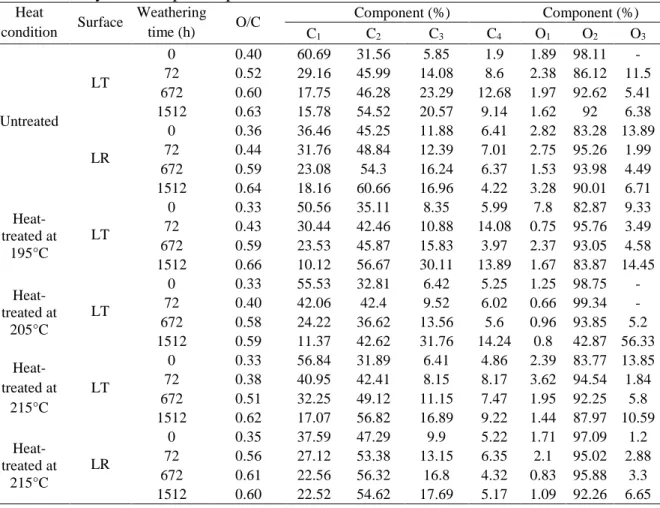
It has been previously reported that the degradation of cellulosic materials and polymers can be detected by a change in the O/C atomic ratio[25]. The O/C atomic ratio is almost always used in quantitative analysis when XPS is used to characterize wood surfaces [21]. O/C ratio can be calculated by using the total areas of peaks of different components and the respective photoemission cross-sections. The evolutions of oxygen to carbon (O/C) ratio for the three wood species studied during heat treatment and weathering are shown in Fig. 2 (a) and (b), respectively. In principle, the O/C ratio of cellulose, which has the gross formula (C6H10O5), is calculated as 0.83. Hemicellulose, which is mainly represented by glucuronoxylans, has an O/C of approximately 0.8. The contribution of lignin is more complex and therefore more difficult to calculate. The theoretical value of O/C for lignin is around 0.33 [17, 25]. Therefore, a high oxygen carbon atomic ratio reflects high cellulose and hemicellulose contents while a low O/C ratio suggests the presence of more lignin on wood surfaces. Fig. 2 (a) shows that O/C ratios reduce slightly after heat treatment for both birch and aspen samples before weathering. This is in agreement with the result of study of Nguila and Petrissans [25], which reported that O/C ratio
decreased from 0.55 to 0.44 after high temperature treatment of beech wood. Sernek [27] also showed that wood drying at high temperature between 160°C and 180°C decreased the O/C ratio of wood. This decrease in O/C ratio due to heat treatment suggests that the lignin content increases whereas the hemicelluloses content decrease on the birch and aspen sample surfaces. This finding agrees with previous studies of chemical component analysis on heat-treated woods [28]. Dehydration of polymers (cellulose and hemicelluloses) initially present in wood leading to the formation of volatile by-products and increase of lignin proportion. This explains the decrease in O/C ratio of birch and aspen wood after heat treatment. However, the O/C ratios of all heat-treated jack pine samples are higher than those of untreated samples in this study. It has been reported that the high carbon content in wood samples is also an indication of the presence of extractives on the wood surface [29]. It was also reported that the increase of the C1 component of the C1 s spectra is consistent with the chemical structure of extractives present in wood samples. Extraction of wood before XPS analysis leads to higher O/C ratios confirming the effect of extractives on the carbon enrichment of the surface [30]. In other words, this finding indicates that the presence of extractives on the wood surface increases the C1 component of the C1 s spectra, and leads to lower O/C ratios. Untreated jack pine wood is rich in carbon-rich extractives (about 6 %) of waxes, fats and terpenes and lignin guaiacyl units’ contents [1]. This can be confirmed by the lower oxygen to carbon ratio (high carbon content) of untreated jack pine compared to those of other two species (see the initial O/C ratios in Fig. 2 (a)).The increase in O/C ratio of jack pine samples is probably due to the partial removal of the abundant carbon-rich extractives in jack pine during high temperature heat treatment. The determinations of chemical component (extractive, Klason lignin, pentosan and holocellulose) content for heat-treated jack pine, aspen and birch before and after weathering were carried out and reported in
previous study [31]. The extractive and lignin contents were found to be reduced after heat treatment to different extents for all three wood species. As stated above, the changes of O/C ratio might be related to changes in the surface extractives or alternatively to the changes of chemical functional groups containing oxygen in lignin and other wood components. The different change trend of O/C ratio during heat treatment could be attributed to different content and structure of chemical components for different species.
Fig. 2 (a) and (b) indicate that the changes provoked in wood composition by weathering are more important compared to those induced by heat treatment at wood surface. As it was stated previous, O/C ratio gives a direct measurement of the surface oxygen content, and higher O/C ratio indicates higher carbohydrate contents while lower O/C ratio reflects higher lignin content and higher extractives on wood surface. Fig. 2 (b) shows that O/C ratio increases with the increasing weathering time for three heat-treated species. This means that weathering reduces lignin content and extractives, consequently, the carbohydrates content increases on all heat-treated wood surfaces during the weathering within the range studied. O/C ratios of sample surfaces of all three species after weathering for 1512 h are much higher than O/C value of lignin (0.33) and relatively close to the ESCA experimental value of 0.62 of cellulose [17, 25]. This implies that weathering resulted in wood surfaces richer in cellulose and poorer in lignin. Higher oxygen contents of weathered wood surfaces also suggest that there is oxidation reaction occurring during weathering [17]. When considering the changes in the O/C ratio during weathering, heat-treated jack pine is modified most, followed by heat-treated aspen and birch. This indicates an influence of the type of wood species on the surface modification due to weathering. Lignin content of softwood (jack pine) is higher than that of hardwood (birch and aspen) which is supported by the comparison of O/C ratios shown in Fig. 2 (b). Lignin is the
most sensitive component due to the oxidation reaction during weathering. Thus, the results showed that weathering degraded heat-treated jack pine surfaces more than the surfaces of other two species, however, the three heat-treated species studied exhibit similar O/C ratios after weathering period of more than 672 h.
The effects of treatment temperature and wood direction on O/C ratio for untreated and heat-treated birch wood during artificial weathering were studied (see Table 3-5). The O/C ratios are higher for untreated birch than for the corresponding heat-treated samples at different temperatures during weathering with the exception of untreated sample after 1512 h of weathering. This sample has slightly lower O/C ratio than that of the sample heat-treated at 195 °C (see Table 5). This suggests that the lignin content of the birch surface increases whereas the hemicelluloses content decreases after heat treatment nearly at all the weathering times. Decrease in O/C radio with the decreasing the heat treatment temperature indicates that as the heat treatment temperature increases the degradation of hemicelluloses increases and this tendency is also maintained during weathering. Chemical properties of wood are known to be a function of direction. A study on tangential surfaces (LT) and radial surfaces (LR) of the three heat-treated woods was conducted to study if the O/C radio is affected by direction during weathering (see Table 3-5). The O/C radios are found to be slightly higher on radial surfaces compared to that on tangential surfaces. This suggests the presence of higher lignin content on tangential surface for both heat-treated and untreated birch samples (see Table 5). The difference between different directions is less before weathering comparing to those after weathering of 336 h and 672 h for heat-treated birch. The O/C radios increase more on radial surfaces than on tangential surfaces for both untreated and heat-treated birch during weathering. Likewise, the heat-treated jack pine and aspen show the similar trend to that of birch (see O/C radio in Table 3-5). This might be
linked to two reasons. From an anatomical standpoint, radial surfaces have a relatively equal percentage of earlywood/latewood exposed to X-rays during the XPS measurements. The tangential surfaces could have higher percentages of earlywood/latewood and perhaps middle lamellas exposed to the X-rays. A slightly higher portion of lignin in the secondary walls of earlywood than in the corresponding wall parts of latewood was reported. It was also reported that the higher proportion of the compound middle lamella in earlywood was the reason for the higher percentage of lignin of an annual ring[32, 33]. Thus, the higher percentages of earlywood/latewood on tangential surfaces might induce the lower O/C ratios obtained in this study. Another reason might be related to the presence of different structures on surfaces at different directions. The radial ray cells present cross surfaces on longitudinal tangential surface which reduces the area exposed to artificial irradiation and oxygen, consequently, reducing the odds of oxidation reaction more significantly in this direction compared to radial surfaces during weathering process. The O/C radio differences provoked by different wood directions are larger than those caused by heat treatment temperature at the some corresponding weathering times. 3.1.2. C1s peaks
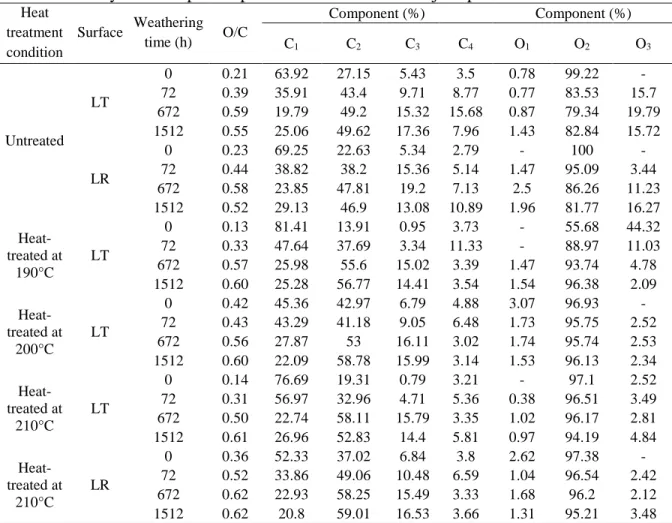
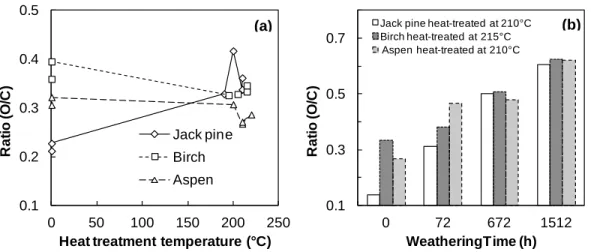
To evaluate the chemical structures of the surface of heat-treated wood, high-resolution XPS spectra of C 1s and O 1s levels was processed. Other elements have very low concentrations at the surface of heat-treated and untreated wood samples of this study which is in agreement with the results of Shen et al[21]. All of the Cls spectra were found to consist of components related to carbon-containing functional groups. The high-resolution of C 1s was fitted with their decomposition into four components according to the literature [18, 21, 25, 26, 29]. The fitted peaks are shown in Fig. 3 after curve fitting. The four peaks in deconvoluted high resolution XPS spectrum of the C1s peaks are expressed as C1-C4 and these carbon bands correspond to C-C
and /or C-H(C1), C-O(C2), C=O or /and O-C-O(C3) and O=C-O(C4), respectively, as shown in Table 2. The chemical shifts and binding energies of C1s peaks found in this study are in very good agreement with the literature values for woody materials. The high-resolution of the XPS spectra of C1s of untreated and heat-treated birch samples before and after artificial weathering for 1512 h were detected and shown in Fig. 3. Careful analysis of the line shapes and intensities of each component at weathered surfaces show that the heat-treated birch surface exhibits similar XPS patterns compared to that of untreated sample surface after weathering for 1512 h (see Fig. 3 (b) and (d)). However, the XPS patterns changed considerably due to weathering for both untreated and heat-treated birch surfaces. The contribution of C1 and C2 peaks are more important than C3 and C4 for samples before weathering indicating that they have higher concentrations at both heat-treated and untreated sample surfaces before weathering. These two peaks are modified by the weathering process. The detailed analysis of the C1s region for heat-treated and unheat-treated samples showed that the most important contributions for surfaces before weathering come from the C1 class (see Fig. 3 (a) and (c)), while the most important contributions for weathered surfaces come from the C2 class (see Fig. 3 (b) and (d)). C1 peak corresponds to carbon linked to carbon (C–C) groups present in lignin, hemicelluloses and extractives such as the fatty acids and hydrogen (C-H) groups of lignin and extractives, and C2 peak component corresponds to OCH groups of lignin and C–O–C linkages of extractives and polysaccharides of wood [25]. The chemical component analysis was previously published [31] and the composition of untreated birch before weathering was reported as 6.14% of extractive, 20.27 % of lignin, 22.77% of pentosan. The spectra of untreated birch before weathering presents an important contribution of C1 component in this study (see Fig. 3 (a)), which is in agreement with wood chemical composition. The contribution of C1 component of untreated sample reduces
after either heat treatment or weathering (see Fig. 3 (b) and (c)), which indicates that the both treatments degrade lignin or extractives or both of them. In addition, the contribution of C1 component of heat-treated birch continues to decrease during weathering (see Fig. 3 (c) and (d)). According to the result of quantitative analysis of component [31] , lignin content increases and extractive content decreases after heat treatment while the contents of both lignin content and extractive content of heat-treated sample decrease significantly after weathering. This confirms the results of XPS in this study. C1 peaks changed most significantly due to weathering according to the comparison of the C1s spectra of birch samples before and after weathering for both untreated and heat-treated samples (see Fig. 3). It appears that the C1 class is most abundant in wood before weathering while the weathered surfaces are rich in C2 class for both heat-treated and untreated birch samples. It is important to investigate the changes of C1 and C2 contributions during weathering for samples heat-treated at different temperatures to study the effect of treatment temperature on chemical elemental composition of heat-treated wood surface.
The variation in peak area contributions of C1 and C2 components as a function of weathering time for untreated and heat-treated birch samples at three different temperatures are shown in Table 5. Since cellulose have a much higher contribution from C2 than lignin and a contribution of the C1 for cellulose can be neglected [26]. Therefore, the C1 is associated with the presence of lignin and extractives on wood surface and the C2 is considered to originate mainly from cellulose and hemicelluloses. The C1 contributions decrease whereas the C2 contributions increase with increasing exposure time during weathering for all birch samples. This indicates that the lignin and extractives are more sensitive to the degradation caused by weathering than cellulose, consequently, the lignin content decreases significantly after weathering. The increase in cellulose content can be partially attributed to the preferential degradation of lignin. The
content of C1 and C2 class of weathered heat-treated sample surfaces indicates that they become richer in cellulose and poorer in lignin after weathering. Almost the same trend as C2 can be observed for C3 contribution indicating the percent contribution of the O-C-O linkages in cellulose and hemicelluloses and at a lower extend that of carbonyl groups (C=O) rise during weathering. This proves again that the weathered surfaces are poor in lignin and comparatively rich in cellulose and hemicelluloses. The C4 peak representing a carbon atom linked to a carbonyl and noncarbonayl oxygen is insignificant in all birch samples (only about 5%). This might be explained by the presence of possibly low content of carboxylic groups on the sample surfaces before and after weathering. The results showed that the effect of heat treatment on the C1s spectra of birch wood surface is less significant than that of weathering. C1 contribution decreases slightly after heat treatment (see Table 5), and C2 contribution remains almost constant. However, the difference of C1 contribution between heat-treated and untreated samples increases up to weathering time of 672 h and then decreases slightly at 1512 h. C1 contributions of heat-treated birch surfaces change less compared to that of unheat-treated sample implying that the weathering has less significant influence on the lignin component of heat-treated wood surface. The change trends of C2 contributions on heat-treated sample surfaces are similar to those of untreated ones except samples heat-treated at 205 °C which exhibits the lowest changes. This suggests that the cellulose and hemicelluloses contents of birch sample heat-treated at 205 °C are degraded by weathering less than those of untreated and other heat-treated birch samples in this study. The high-resolutions of the C1s spectra of heat-treated jack pine and aspen samples show similar change trends. The summary of XPS spectral parameters of heat-treated jack pine, aspen and birch samples were calculated and are shown in Table 3, Table 4 and Table 5, respectively.
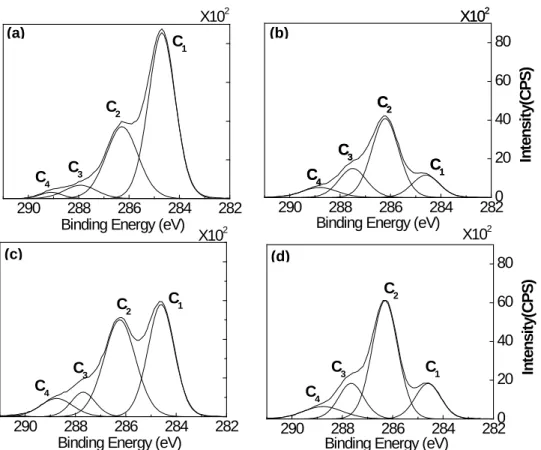
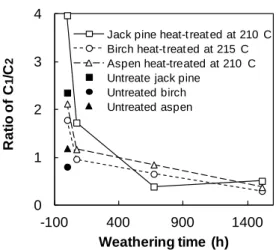
According to study of Nishimiya [34], the C1 and C2 peaks correspond to those of aromatic carbon and aliphatic carbon in wood, respectively. The relations between the weathering time and the aromatic carbons/aliphatic carbons ratio (C1/C2) of three heat-treated woods are presented in Fig. 4. These ratios might be considered as a reflection of the amount of aromatic carbons of lignin in the heat-treated wood samples. The Caro/Cali ratios of all three species rise after heat treatment at 210 and 215 °C. This is due to the decrease in aliphatic carbons leading from the degradation of in hemicelluloses and cellulose caused by high temperature treatment and the possible formation of condensed aromatic rings which might noticeably influence the weathering resistance of the wood surface. The Caro/Cali ratios of all three heat-treated species are more than 1.5 before weathering and reduce sharply after weathering for 72 h, and then continue to decrease to around 0.5 with lower rate up to 1512 h except heat-treated jack pine. The ratio of treated jack pine samples rises slightly between 672 h and 1512 h. The spectra of the heat-treated wood samples are in better agreement with expected wood chemical composition due to migration of extractives during heat treatment. Moreover, the C1 component is contributed to aromatic carbons of lignin of the heat-treated wood samples after weathering due to removal of extractives by leaching. This is confirmed by the most significant decreasing of C1/C2 ratio during the initial weathering time of 72 h. The decline in the Caro/Cali ratios during weathering is due to degradation of aromatic rings in lignin which may noticeably influence the color and the strength of the heat-treated wood surface. Differences of aromatic carbons/aliphatic carbons ratio between different heat-treated species decline with increasing weathering time. Though differences between species still exist even after the surface develops a cellulose-rich layer with regard to chemical properties, different types of wood have similar chemical structures even after artificial weathering for relatively long times such as 1512 h. Therefore, the differences in color
and other physical properties between heat-treated species are probably no longer significant at this stage which was confirmed by color measurements, contact angle tests and SEM analyses of the heat-treated wood in previous studies [28, 35]. The change of Caro/Cali ratio of heat-treated jack pine due to weathering is more significant than those of birch and aspen which is possibly due to the difference in the guaiacyl content between softwood (jack pine) and hardwood (birch and aspen). The lignin of softwood consist of guiacyl nuclei, whereas the lignin of birch and aspen is made up of a mixture of guaiacy and syringyl nuclei [36]. According to the study of Colom and his co-workers [37], the guaiacyl nuclei are more sensitive to the artificial weathering degradation process than the syringyl nuclei. In view of the literature and the study stated above, it can be said that the aromatic rings of lignin in heat-treated jack pine degrades than those of birch and aspen. Parallel to these results, the Caro/Cali ratios are found to a function of species type at different extents depending on weathering time for the heat-treated specimens tested in this study.
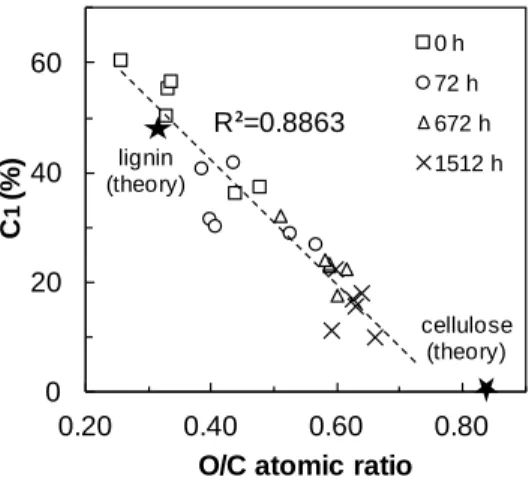
The percentage of C1 carbon for heat-treated birch wood is inversely proportional to the O/C atomic concentration ratio, as shown in Fig. 5. Also shown are theoretical points from given by Johansson et al. for wood lignin and pure cellulose, according to the chemical composition of these substances [38]. A linear correlation between the two measures can be observed, with a high correlation coefficient of 0.8863. When percentage of C1 versus O/C atomic concentration ratio is plotted for heat-treated jack pine and aspen, the following correlation coefficients of linear regression analysis are obtained: 0.9657 for heat-treated jack pine and 0.8787for heat-treated aspen. This indicates that the types of lignin present, although they might be chemically modified during weathering, are sufficiently similar to allow a consistent lignin determination on heat-treated samples used in this study. In addition, as the weathering exposure time increases, the
points of percentage of C1 carbon vs. O/C ratio shift towards the theoretical value of cellulose for all the three heat-treated species studied. This indicates that the lignin content of heat-treated samples declines during artificial weathering; consequently, specimens tend to exhibit abundant cellulose content after weathering of 1512 h. This was confirmed by the lignin determinations of heat-treated woods before and after weathering via Klason lignin in previous study [31]. The linear fit to the data of Fig. 5 is nearly parallel to the line drawn through the theoretical values for lignin and cellulose. This indicates that contamination levels on sample surfaces are constant for the data set and the relatively small variance of the plotted points can be attributed to random error.
3.1.3. O1s peaks
The electronegativity and polarizability of substituents interacting directly or indirectly with the oxygen atom result in complex shift behavior of O1s peak. In addition, the difficulty to distinguish between simple and double bonds between the oxygen and carbon atoms also leads to relatively sparse study on O1s peak of wood materials compared with the C1s peak reported in the literature [26]. It was suggested to compare the decomposition of this peak to known models [39]. For example, a binding energy of 531.6±0.4 eV was attributed to oxygen atoms between two phenolic groups or an oxygen bound to a carbon through double bond for O1 [39]. It was proposed that this component was associated to lignin and that increase in the O1 indicates a decrease in carbohydrates on the fiber surface and an increase in lignin and extractives[40]. It was also observed that eliminating lignin from the fiber surface by high temperature treatment decreased fractional area of O1 and increased that of O2[26]. All oxygen atoms of cellulose are attributed to O2 component with a binding energy of 533.2 eV by Whatman paper [26]. The phenolic oxygen is attributed to O3 of a binding energy of 534.3±0.4 eV which is mainly
associated with lignin in woody materials [39]. Consequently, the presence of O3 component in XPS spectra indicates the presence of lignin on wood surface.
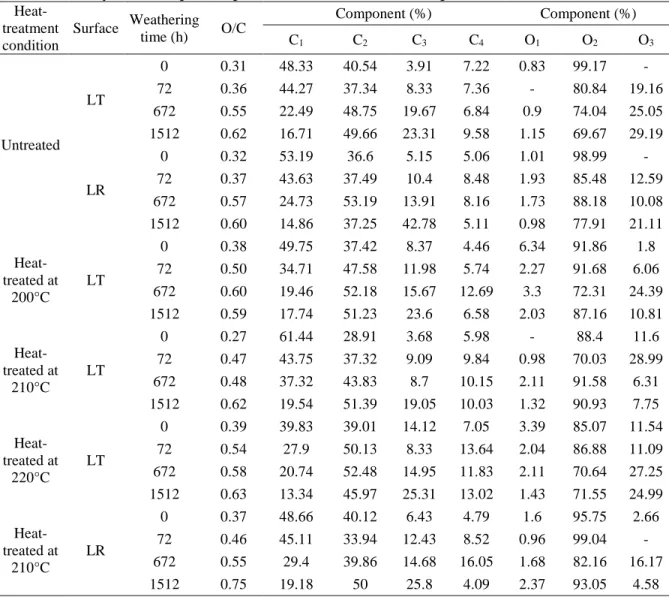
In this analysis, the high-resolution of O 1s was fitted with their decomposition into two or three components depending on samples. Fig. 6 shows examples of the O1s spectra of heat-treated birch samples during weathering. These spectra show three components: O1, O2 and O3. The binding energies of these three components are in an excellent agreement with those reported in the literature with the O1s spectra of woody material (shown in Table 2) [25, 26].The analysis of the effect of heat treatment temperature on the O1s spectra of birch samples shows that the fractional areas of the O1 and O3 components increase whereas that of O2 decrease (see Fig. 6 (a) and (b)). This is in agreement with the previous study [26]. However, the weathering shows an opposite effect on the O1s spectra of heat-treated birch wood; decreasing fractional areas of the O1 and O3 components and increasing that of O2 (see Fig. 6 (c)). Because O1 and O3 are associated to lignin and O2 to hemicelluloses (Table 2), it can be said that the heat treatment increases and weathering process decreases the lignin content of birch surface.
The analysis of spectra during weathering and heat treatment for the three species shows that it is difficult to detect the O1 or O3 peaks for some samples (see Table 3-5). This can be attributed to the low resolution of oxygen peak decomposition. Similar to birch samples, heat treatment increases the O1 and O3 components and decrease O2 component of both jack pine and aspen at various extents depending on the treatment temperature. However, the clear trends were not found for the components of O1s spectra due to weathering for untreated jack pine and aspen. Therefore, the analysis based on O1s spectra for these samples during weathering cannot be used for typical routine analysis.
3.1.4. Acid-base properties
It was reported that XPS technique can be used to characterize the acid-base properties of wood surface from the occurrence of components of C 1s [21]. Fowkes reported that the lower electron binding energies of XPS spectra can be considered as basic and electron-donating atoms [23]. Thus, the C1 group is suggested to be basic according to its lowest binding energy of the four classes. C2 is defined as acidic by the relation to OH groups and C–O groups [22, 23]. C3 is classed as basic in accordance with the C=O groups which is suggested to be electron donors and tend to form complex with acids [21, 23]. C4 is judged as acidic based on the link to acetyl groups and carboxyl groups (O=C-O) [23]. In the view of the literature and on the basis of Fowkes acid–base theory, the acidity can be calculated from the atomic concentrations of C2+C4 and the basicity from the atomic concentrations of C1+C3, respectively. The ratio of acidity to basicity (A/B) can then be expressed as (C2+C4)/( C1+C3) [21].
The evolutions of acidity to basicity (A/B) ratios of the three heat-treated woods during weathering are compared in Fig.7. Also shown are points for the three untreated woods before weathering. The results showed that the heat-treated woods have lower A/B values than the corresponding untreated woods for all three species. This indicates that the heat treatment causes a decrease in wood acidity for all species considered during this study. Acidity of wood is mainly due to hydrogen atoms present in different wood components. The carboxylic acids functions of hemicelluloses affect the acidity of wood more than the hydroxyl groups of polysaccharides which represent lower acidity [1]. Therefore, the decrease in wood acidity is might be attributed to the degradation of hemicelluloses during heat treatment leading to the decrease of carboxylic acid functions mainly present in hemicelluloses. This agrees with the findings of Philipp et al.[1]. In addition, the jack pine has a lower A/B ratio than those of aspen and birch both for untreated
and heat-treated samples. This means that total basicity of jack pine wood is stronger and its total acidity is weaker than those of aspen and birch even after heat treatment. This is probably related to the difference in lignin structure of softwood and hardwood. The basic unit of softwood lignin is guaiacyl units whilst hardwood lignin consists of the mixture of guaiacyl and syringyl units. Since jack pine belongs to softwood and the the other two species are hardwood, they exhibit different acid-basic properties. The is in agreement with the results of Shen et al. [21]. They reported that pine wood has lower acid/base ratio than three hardwood species (oak, beech and yellow poplar) they investigated.
The A/B ratios rise considerably at a weathering time of 72h but are less than 1 for all three heat-treated species studied. This means that all samples are basic at this weathering time. The ratios continue to rise to more than 1.5 up to 1512 h of weathering for heat-treated aspen and birch while that of jack pine rises more significantly to a maximum value of 1.6 at 672 h and then reduces to 1.3 at 1512 h. This indicates that the heat-treated samples become more acidic as a result of weathering and the acidity increases as the weathering time increases. Three explanations might be considered to account for the increase in acidity during weathering: the first possible reason might be related to the degradation of lignin by weathering and cellulose- rich layer left on wood surface. According to Philippe et al. and De Meijer et al. [1, 41], surface free energy electron-accepting component of cellulose (1.67) is higher than that of wood (1.1). If this is the case, the higher acidity to basicity ratios indicates higher cellulose content on wood surface after weathering. The second possible reason might be related to the cleavage of the covalent linkages between lignin and polyses when lignin was depredated by weathering. There are three most frequently suggested types of the linkages: ether linkages, ester linkages as well as glycosidic linkage [42]. The cleavage of these three linkages due to weathering might lead to
formation of O=C-O groups, CH3–OH groups and OH groups, respectively. All this acidic function groups increase the acidity of weathered heat-treated wood surfaces. The third possible reason might be that the oxidation reaction of the polysaccharides component left on weathered wood surface after the by-products, caused by degradation of lignin, have been leached away from surface by water or moisture. The hydroxyl groups of the sugar units and the reducing end-groups of polysaccharides might be subjected to oxidative attack and convert to aldehyde, keto and carboxyl groups [42] which are groups with strong acidic property. The larger rise in the A/B ratio of heat-treated jack pine then other two species (birch and aspen) up to weathering time of 672 h might be due the more sensitivity of guaiacyl units in softwood lignin against weathering, which is stated previously.
To evaluate the influence of oxygen content on the surface acid-basic properties, the ratios A/B are plotted as a function of the atomic concentration ratio (O/C) for heat-treated wood samples after weathering for different periods. Fig. 8 shows the example of a correlation plot for heat-treated birch. A linear correlation between the atomic concentration ratio O/C and the acid/ basic ratio can be observed from this figure with a correlation coefficient of 0.7882. When similar graph is plotted for heat-treated jack pine and aspen the correlation coefficients of 0.9169 and 0.7857 are obtained, respectively, from the liner regression analyses. O/C ratio gives a direct measurement of the surface oxygen content and a high oxygen content normally points to oxidation of the surface. Therefore, the results indicate that the acid/base ratio is increased proportionally as a result of oxidation caused by weathering for heat-treated species investigated in this study. This result is in conflict with the findings of Shen and his colleagues [21]. They reported that the acid/base ratio of pine wood is reduced by about 12.5% as a result of oxidation. They came to this conclusion by using the difference between two A/B values determined by the
sessile drop method and XPS. However, there are other factors which might influence the results in addition to oxidation of surface such as measuring procedure and random error. Therefore, studying representative number of points is important. The results of the present study are based on more than 72 measurements; hence, the results are representative of the wood surfaces studied.
4. Conclusions
The deleterious effects of artificial weathering on three heat-treated wood surfaces were investigated using XPS. The XPS spectra results showed that the O/C ratio increases with weathering indicating that the heat-treated wood surfaces are oxidized. The C 1s peaks imply a decrease in the area of the C1 (mainly from cellulose and hemicelluloses) indicating that the heat-treated wood surfaces become rich in cellulose and poor in lignin as a result of the oxidation caused by weathering. A decrease in the O1 peak originating from lignin and extractives detected in O 1s peaks, therefore, confirmed the trend observed for C 1s peaks. These results suggest that lignin is more sensitive to weathering than other component in heat-treated wood surfaces. Results of acidity to basicity ratios indicate that heat treatment results in a decrease of wood acidity. This might be attributed to the degradation of hemicelluloses leading to the decrease of carboxylic acid functions mainly present in hemicelluloses. However, the acid/base ratio increases proportionally as a result of oxidation caused by weathering. The influence of weathering on chemical modification of surface was found to be more significant than that of heat treatment. The measurements performed during this study under similar conditions were reproducible indicating that the contamination levels on sample surfaces are constant and the results are reliable.
Acknowledgements
The authors thank Fonds québécois de la recherche sur la nature et les technologies (FQRNT), Développement Économique Canada (DEC), Ministère du Développement Économique, de l’Innovation et de l’Exportation (MDEIE), Conférence Régionale des Élus du Saguenay-Lac-St-Jean (CRÉ), Université du Québec à Chicoutimi (UQAC), Fondation de l’Université du Québec à Chicoutimi (FUQAC), FPInnovation, Alberta Innovates, and industrial partners (PCI Ind., Kisis Technology, and Industries ISA), for their technical and financial contributions. We also thank the Alberta Centre for Surface Engineering and Science (ACSES) at University of Alberta for technical support during XPS analysis.
References
[1] P. GeÌrardin, M. PetricÌŒ, M. Petrissans, J. Lambert, J. J. Ehrhrardt, Polymer
Degradation and Stability 2007, 92, 653.
[2] D. Kocaefe, S. Poncsak, G. Dore, R. Younsi, Holz als Roh - und Werkstoff 2008, 66, 355. [3] B. M. Esteves, H. M. Pereira, BioResources 2009, 4, 370.
[4] E. Windeisen, C. Strobel, G. Wegener, Wood Science and Technology 2007, 41, 523. [5] L. Salmén, H. Possler, J. S. Stevanic, S. E. Stanzl-Tschegg, Holzforschung 2008, 62, 676. [6] D. Aydemir, G. Gunduz, E. Altuntaş, M. Ertas, H. Turgut Şahin, M. Hakki Alma,
BioResources 2011, 6, 1308.
[7] N. Brosse, R. El Hage, M. Chaouch, M. Pétrissans, S. Dumarçay, P. Gérardin, Polymer
Degradation and Stability 2010, 95, 1721.
[8] I. Tumen, D. Aydemir, G. Gunduz, B. Uner, H. Cetin, BioResources 2010, 5, 1936. [9] W. C. Feist, D. N. S. Hon, The Chemistry of Solid Wood, Ed. 1984.
[10] D. N. S. Hon, W. C. Feist, Wood Science and Technology 1986, 20, 169. [11] W. C. Feist, Structural Use of Wood in Adverse Environments 1982, 156. [12] D. N. S. Hon, Royal Australian Chemical Inst, Polymer Div, 1985, p. 373. [13] D. N. S. Hon, S. T. Chang, J. Polym. Sci. 1986, 22, 2227.
[14] W. C. Feist, R. M. Rowell, R. J. Barbour, Archaeological Wood: Properties, Chemistry,
and Preservation 1990, 263.
[15] S. Y. Lin, K. P. Kringstad, Tappi 1970, 53, 658.
[18] G. Sinn, A. Reiterer, S. E. Stanzl-Tschegg, Journal of Materials Science 2001, 36, 4673. [19] Y. Xie, P. M. A. Sherwood, Chemistry of Materials 1991, 3, 164.
[20] W. T. Y. Tze, G. Bernhardt, D. J. Gardner, A. W. Christiansen, International Journal of
Adhesion and Adhesives 2006, 26, 550.
[21] Q. Shen, P. Mikkola, J. B. Rosenholm, Colloids and Surfaces A: Physicochemical and
Engineering Aspects 1998, 145, 235.
[22] G. Nguila Inari, M. Petrissans, J. Lambert, J. J. Ehrhardt, P. GeÌrardin, Surface and
Interface Analysis 2006, 38, 1336.
[23] F. M. Fowkes, J. Adhesion Sci. Technol. 1990, 4, 669.
[24] S. R. Holmes-Farley, G. M. Whitesides, Langmuir 1987, 3, 62.
[25] G. Nguila Inari, M. Petrissans, J. Lambert, J. J. Ehrhardt, P. Gérardin, Surface and
Interface Analysis 2006, 38, 1336.
[26] A. Koubaa, B. Riedl, Z. Koran, Journal of Applied Polymer Science 1996, 61, 545. [27] M. Sernek, F. A. Kamke, W. G. Glasser, Holzforschung 2004, 58, 22.
[28] X. Huang, D. Kocaefe, Y. Kocaefe, Y. Bolukb, A. Pichette, Applied Surface Science
(revision).
[29] D. P. Kamdem, B. Riedl, A. Adnot, S. Kaliaguine, Journal of Applied Polymer Science 1991, 43, 1901.
[30] G. Nguila Inari, M. Pétrissans, S. Dumarcay, J. Lambert, J. J. Ehrhardt, M. Šernek, P. Gérardin, Wood Science and Technology 2011, 45, 369.
[31] X. Huang, D. Kocaefe, Y. Kocaefe, Y. Boluk, A. Pichette, Applied Surface Science 2012,
258, 5360.
[32] J. B. Boutelje, Sven. Papperstidn. 1972, 75, 683.
[33] D. Fengel, G. Wegener, in Wood: Chemistry, Ultrastructure, Reactions, 1984, pp. 227. [34] K. Nishimiya, Journal of Wood Science 1998, 44, 56.
[35] X. Huang, D. Kocaefe, Y. Kocaefe, Y. Bolukb, A. Pichette, Wood Science and
Technology (revision).
[36] P. A. Evans, Spectrochimica Acta Part A: Molecular Spectroscopy 1991, 47, 1441. [37] X. Colom, F. Carrillo, F. Nogués, P. Garriga, Polymer Degradation and Stability 2003,
80, 543.
[38] L. S. Johansson, J. M. Campbell, K. Koljonen, P. Stenius, Applied Surface Science 1999,
144-145, 92.
[39] A. Ahmed, A. Adnot, S. Kaliaguine, Journal of Applied Polymer Science 1987, 34, 359. [40] X. Hua, S. Kaliaguine, B. V. Kokta, A. Adnot, Wood Science and Technology 1993, 27,
449.
[41] M. De Meijer, S. Haemers, W. Cobben, H. Militz, Langmuir 2000, 16, 9352. [42] D. Fengel, G. Wegener, Wood: Chemistry, Ultrastructure, Reactions 2003, 167.
Table 1 Conditions of heat treatment Sample N. English name Surface Temp. (°C) Heating Rate (°C/h) Holding Time (h) Humidity 1 Jack pine LT 0 / / / 2 Jack pine LR 0 / / /
3 Jack pine LT 190 15 1 Yes
4 Jack pine LT 200 15 1 Yes
5 Jack pine LT 210 15 1 Yes
6 Jack pine LR 210 15 1 Yes
7 Aspen LT 0 / / / 8 Aspen LR 0 / / / 9 Aspen LT 200 15 1 Yes 10 Aspen LT 210 15 1 Yes 11 Aspen LR 210 15 1 Yes 12 Aspen LT 220 15 1 Yes 13 Birch LT 0 / / / 14 Birch LR 0 / / / 15 Birch LT 195 15 1 Yes 16 Birch LT 205 15 1 Yes 17 Birch LT 215 15 1 Yes 18 Birch LR 215 15 1 Yes
Table 2 Classification of carbon and oxygen peak components for wood materials
Group Chemical shifts / peak position (eV) Carbon or oxygen bond to Carbon
C1 284.6
C-C , C-H
(Carbon atoms bonded only with carbon or hydrogen atoms)
C2 284.6+1.5±0.2 C-O
(Carbon atoms bonded with one oxygen atom)
C3 284.6+3.0 ±0.2
C=O , O-C-O
(Carbon atoms bonded to a carbonyl or two non-carbonyl oxygen atoms)
C4 284.6+4.1±0.2
O-C=O
(Carbon atoms bonded to one carbonyl and one non-carbonyl oxygen atoms)
Oxygen
O1 531.4±0.4 O-C=O
O2 531.4+1.9±0.4 C-O-,C=O,C-O-C, O-C=O
Table 3 Summary of XPS spectral parameters of heat-treated jack pine Heat treatment condition Surface Weathering time (h) O/C Component (%) Component (%) C1 C2 C3 C4 O1 O2 O3 Untreated LT 0 0.21 63.92 27.15 5.43 3.5 0.78 99.22 - 72 0.39 35.91 43.4 9.71 8.77 0.77 83.53 15.7 672 0.59 19.79 49.2 15.32 15.68 0.87 79.34 19.79 1512 0.55 25.06 49.62 17.36 7.96 1.43 82.84 15.72 LR 0 0.23 69.25 22.63 5.34 2.79 - 100 - 72 0.44 38.82 38.2 15.36 5.14 1.47 95.09 3.44 672 0.58 23.85 47.81 19.2 7.13 2.5 86.26 11.23 1512 0.52 29.13 46.9 13.08 10.89 1.96 81.77 16.27 Heat-treated at 190°C LT 0 0.13 81.41 13.91 0.95 3.73 - 55.68 44.32 72 0.33 47.64 37.69 3.34 11.33 - 88.97 11.03 672 0.57 25.98 55.6 15.02 3.39 1.47 93.74 4.78 1512 0.60 25.28 56.77 14.41 3.54 1.54 96.38 2.09 Heat-treated at 200°C LT 0 0.42 45.36 42.97 6.79 4.88 3.07 96.93 - 72 0.43 43.29 41.18 9.05 6.48 1.73 95.75 2.52 672 0.56 27.87 53 16.11 3.02 1.74 95.74 2.53 1512 0.60 22.09 58.78 15.99 3.14 1.53 96.13 2.34 Heat-treated at 210°C LT 0 0.14 76.69 19.31 0.79 3.21 - 97.1 2.52 72 0.31 56.97 32.96 4.71 5.36 0.38 96.51 3.49 672 0.50 22.74 58.11 15.79 3.35 1.02 96.17 2.81 1512 0.61 26.96 52.83 14.4 5.81 0.97 94.19 4.84 Heat-treated at 210°C LR 0 0.36 52.33 37.02 6.84 3.8 2.62 97.38 - 72 0.52 33.86 49.06 10.48 6.59 1.04 96.54 2.42 672 0.62 22.93 58.25 15.49 3.33 1.68 96.2 2.12 1512 0.62 20.8 59.01 16.53 3.66 1.31 95.21 3.48
Table 4 Summary of XPS spectral parameters of heat-treated aspen Heat-treatment condition Surface Weathering time (h) O/C Component (%) Component (%) C1 C2 C3 C4 O1 O2 O3 Untreated LT 0 0.31 48.33 40.54 3.91 7.22 0.83 99.17 - 72 0.36 44.27 37.34 8.33 7.36 - 80.84 19.16 672 0.55 22.49 48.75 19.67 6.84 0.9 74.04 25.05 1512 0.62 16.71 49.66 23.31 9.58 1.15 69.67 29.19 LR 0 0.32 53.19 36.6 5.15 5.06 1.01 98.99 - 72 0.37 43.63 37.49 10.4 8.48 1.93 85.48 12.59 672 0.57 24.73 53.19 13.91 8.16 1.73 88.18 10.08 1512 0.60 14.86 37.25 42.78 5.11 0.98 77.91 21.11 Heat-treated at 200°C LT 0 0.38 49.75 37.42 8.37 4.46 6.34 91.86 1.8 72 0.50 34.71 47.58 11.98 5.74 2.27 91.68 6.06 672 0.60 19.46 52.18 15.67 12.69 3.3 72.31 24.39 1512 0.59 17.74 51.23 23.6 6.58 2.03 87.16 10.81 Heat-treated at 210°C LT 0 0.27 61.44 28.91 3.68 5.98 - 88.4 11.6 72 0.47 43.75 37.32 9.09 9.84 0.98 70.03 28.99 672 0.48 37.32 43.83 8.7 10.15 2.11 91.58 6.31 1512 0.62 19.54 51.39 19.05 10.03 1.32 90.93 7.75 Heat-treated at 220°C LT 0 0.39 39.83 39.01 14.12 7.05 3.39 85.07 11.54 72 0.54 27.9 50.13 8.33 13.64 2.04 86.88 11.09 672 0.58 20.74 52.48 14.95 11.83 2.11 70.64 27.25 1512 0.63 13.34 45.97 25.31 13.02 1.43 71.55 24.99 Heat-treated at 210°C LR 0 0.37 48.66 40.12 6.43 4.79 1.6 95.75 2.66 72 0.46 45.11 33.94 12.43 8.52 0.96 99.04 - 672 0.55 29.4 39.86 14.68 16.05 1.68 82.16 16.17 1512 0.75 19.18 50 25.8 4.09 2.37 93.05 4.58
Table 5 Summary of XPS spectral parameters in heat-treated birch Heat condition Surface Weathering time (h) O/C Component (%) Component (%) C1 C2 C3 C4 O1 O2 O3 Untreated LT 0 0.40 60.69 31.56 5.85 1.9 1.89 98.11 - 72 0.52 29.16 45.99 14.08 8.6 2.38 86.12 11.5 672 0.60 17.75 46.28 23.29 12.68 1.97 92.62 5.41 1512 0.63 15.78 54.52 20.57 9.14 1.62 92 6.38 LR 0 0.36 36.46 45.25 11.88 6.41 2.82 83.28 13.89 72 0.44 31.76 48.84 12.39 7.01 2.75 95.26 1.99 672 0.59 23.08 54.3 16.24 6.37 1.53 93.98 4.49 1512 0.64 18.16 60.66 16.96 4.22 3.28 90.01 6.71 Heat-treated at 195°C LT 0 0.33 50.56 35.11 8.35 5.99 7.8 82.87 9.33 72 0.43 30.44 42.46 10.88 14.08 0.75 95.76 3.49 672 0.59 23.53 45.87 15.83 3.97 2.37 93.05 4.58 1512 0.66 10.12 56.67 30.11 13.89 1.67 83.87 14.45 Heat-treated at 205°C LT 0 0.33 55.53 32.81 6.42 5.25 1.25 98.75 - 72 0.40 42.06 42.4 9.52 6.02 0.66 99.34 - 672 0.58 24.22 36.62 13.56 5.6 0.96 93.85 5.2 1512 0.59 11.37 42.62 31.76 14.24 0.8 42.87 56.33 Heat-treated at 215°C LT 0 0.33 56.84 31.89 6.41 4.86 2.39 83.77 13.85 72 0.38 40.95 42.41 8.15 8.17 3.62 94.54 1.84 672 0.51 32.25 49.12 11.15 7.47 1.95 92.25 5.8 1512 0.62 17.07 56.82 16.89 9.22 1.44 87.97 10.59 Heat-treated at 215°C LR 0 0.35 37.59 47.29 9.9 5.22 1.71 97.09 1.2 72 0.56 27.12 53.38 13.15 6.35 2.1 95.02 2.88 672 0.61 22.56 56.32 16.8 4.32 0.83 95.88 3.3 1512 0.60 22.52 54.62 17.69 5.17 1.09 92.26 6.65
1000 800 600 400 200 0 0 40 80 120 160 200 Int ens ity ( C P S )
Binding Energy (eV) X103 OKLL O1s C1s O2s 1000 800 600 400 200 0 0 40 80 120 160 200 X103 Int ens ity ( C P S )
Binding Energy (eV) OKLL O1s C1s O2s 1000 800 600 400 200 0 0 40 80 120 160 200 X103 Int ens ity ( C P S )
Binding Energy (eV) OKLL
O1s
C1s
O2s
Fig. 1 XPS survey spectra of untreated and heat-treated birch wood before and after weathering for 1512 h: (a) untreated before weathering, (b) heat-treated at 215 °C before weathering, (c) heat-treated at 215 °C and weathered for 1512 h
0.1 0.2 0.3 0.4 0.5 0 50 100 150 200 250 R a tio ( O/C )
Heat treatment temperature (°C) Jack pine Birch Aspen 0.1 0.3 0.5 0.7 0 72 672 1512 R a tio ( O/C ) WeatheringTime (h) Jack pine heat-treated at 210°C Birch heat-treated at 215°C
Aspen heat-treated at 210°C
Fig. 2 O/C ratio evolution of three wood species during (a) heat treatment and (b) weathering
290 288 286 284 282 In ten si ty( C P S ) In ten si ty( C P S )
Binding Energy (eV)
X102 C1 C2 C3 C4 290 288 286 284 2820 20 40 60 80
Binding Energy (eV)
X102 C1 C2 C3 C4 X102 C2 C1 C3 C4 290 288 286 284 282
Binding Energy (eV)
X102 C2 C1 C3 C4 290 288 286 284 2820 20 40 60 80
Binding Energy (eV)
X102
C1 C2
C3 C4
Fig. 3 C1s spectra of untreated and heat-treated birch wood before and after weathering for 1512 h: (a) Untreated before weathering, (b) untreated after weathering for 1512 h, (c) heat-treated before weathering, (d) heat-treated after weathering for 1512 h
(a) (b)
0 1 2 3 4 -100 400 900 1400 R a ti o o f C 1 /C 2 Weathering time (h)
Jack pine heat-t reat ed at 210 C Birch heat-t reat ed at 215 C Aspen heat-treated at 210 C Untreate jack pine
Untreated birch Untreated aspen
Fig. 4 Aromatic carbons/aliphatic carbons ratio (C1/C2) of heat-treated woods as a function of weathering time
0 20 40 60 0.20 0.40 0.60 0.80 C 1 (% )
O/C atomic ratio
0 h 72 h 672 h 1512 h R²=0.8863 lignin (theory) cellulose (theory)
Fig. 5 Correlation of the O/C atomic concentration ratio with the percentage of C1 carbon for heat-treated birch wood
534 532 530 528 Binding Energy (eV)
X102
O1 O3
O2
534 532 530 528
Binding Energy (eV)
X102 O2 O3 O1 534 532 530 5280 40 80 120 160
Binding Energy (eV)
X102
O2
O3 O
1
Fig. 6 O1s spectra of untreated and heat-treated birch wood before and after weathering for 1512 h: (a) Untreated before weathering, (b) heat-treated before weathering, (c) heat-treated after weathering for 1512 h
0.0 0.5 1.0 1.5 2.0 -100 400 900 1400 R at io o f aci d /b ase Weathering time (h)
Untreate jack pine Untreated birch Untreated aspen
Jack pine heat-treated at 210°C Birch heat-treated at 215°C Aspen heat-treated at 210°C
Fig. 7 Comparison of ratio of acidity to basicity (A/B) of three heat-treated woods during weathering
0.0 0.5 1.0 1.5 2.0 2.5 0.20 0.40 0.60 R at io o f aci d /b ase
O/C atomic ratio
0 h 72 h 672 h 1512 h
Fig. 8 Correlation of acidity to basicity ratio (A/B) and oxygen to carbon atomic ratio (O/C) for heat-treated birch wood during weathering