DESIGN AND ANALYSIS OF A VARIABLE-COMPRESSION
-RATIO INTERNAL-COMBUSTION ENGINE -THE ALVAR ENGINE CONCEPT by
MARCUS STEWART
B.S., Department of Mechanical Engineering University of Tennessee, Knoxville
(1995)
SUBMITTED IN PARTIAL FULFILLMENT REQUIREMENTS FOR THE DEGREE
OF THE OF MASTER OF SCIENCE IN MECHANICAL ENGINEERING at the
MASSACHUSETTS INSTITUTE OF TECHNOLOGY June 1997
© 1997 Massachusetts Institute of Technology All rights reserved
Signature of Author
---Department of Mechanical Engineering May 16, 1997
Certified by
-ictor W. Wong Lecturer, Department of Mech cal Engineering , Thesis Supervisor Accepted by
Am A. ~bnTn Chairman, Department Committee on Graduate Studies Department of Mechanical Engineering
;M":.A PSS.AfHUSETTfS INS'T TUTE
OF TECHNOLOGY
JUL 2119971
,-UIBRARIESDesign and Analysis of A Variable-Compression -Ratio Internal-Combustion Engine
-The Alvar Engine Concept
by
Marcus Stewart
Submitted to the Department of Mechanical Engineering in Partial Fulfillment of the Requirements for the Degree
of Masters of Science in Mechanical Engineering Abstract
The internal-combustion engine operates over a wide range of conditions. These conditions include boosted intake pressures and increased fuel rate to deliver maximum power output and, most of the time, part loads with emphasis on fuel efficiency. Inherent in the internal-combustion engine design is the compression ratio. The compression ratio affects engine efficiency and the charge temperature and pressure prior to ignition, and thus the engine's tendency to knock. Maximum power output of an engine is therefore influenced by the compression ratio.
The Alvar engine represents an attempt to capitalize on the benefits available from varying the compression ratio of the internal-combustion engine. One main advantage of the Alvar concept stems from the ability to operate at higher power output at a given engine size (power density) via a combination of higher intake pressure (boost) and lower compression ratio at the maximum load condition to avoid knock. Another advantage of the Alvar approach is the thermal efficiency gain by operating at higher compression ratios at part loads.
This work includes the design and analysis of the Alvar engine. Through a performance analysis using a quasi-dimensional four-stroke cycle engine simulation, the Alvar concept has been found to effectively extract the benefits associated with the compression-ratio flexibility.
The analysis included in this thesis reveals that close to six percent improvement of engine efficiency at very light load and 3.8 percent improvement in energy-weighted-average urban-driving-cycle efficiency are attainable by the Alvar engine. Furthermore, this work reveals a significant advantage in the reduction of knock likelihood in the Alvar engine during turbocharged operation, allowing an increase in power density.
This thesis recommends an optimal and practical design of the Alvar combustion chamber to be sized at 34.0 mm secondary bore and 39.9 mm secondary stroke, secondary connecting-rod length at 101.1 mm, and a clearance volume of 42.3 cc to fit onto an existing engine block of a Volvo 850 engine. Physical testing of the proposed design will further determine the success of the Alvar engine concept.
Thesis Supervisor: Dr. Victor W. Wong
Title: Principal Research Scientist -Sloan Automotive Laboratory Lecturer -Department of Mechanical Engineering
Table of Contents
Cover 1
Abstract 3
Table of Contents 5
Acknowledgments 8
Definition of Symbols and Abbreviations 9
List of Figures 11
List of Tables 14
Chapter 1 Variable Compression Ratio Background 15
1.1 Previous Variable Compression Ratio Methods 15 1.2 The Alvar Variable Compression Ratio Engine Concept 16
1.3 Objectives of the Present Study 17
1.4 Scope of Work and Approach 18
1.5 Organization of Thesis 19
Chapter 2 Validation of Engine Simulations 21
2.1 Introduction 21
2.2 The MIT Engine Cycle Simulation 22
2.3 The Alvar Engine Cycle Simulation 23
2.4 Matching MIT and Alvar Inputs 25
2.5 Comparison of MIT and Alvar Simulation Results 28 2.5.1 Comparison between MIT and Alvar (Hoglund) Simulations 28 2.5.2 Comparison of Simulations against Experimental Data 29
2.6 Summary 31
Chapter 3 Parametric Studies 33
3.1 Approach 33
3.2 Effect of Secondary Bore 35
3.3 Effect of Phase Shift 37
3.4 Summary 41
Chapter 4 Alvar Engine Design 43
42 Sco e of Work and A
h
4.3 Conventional Cylinder Head 44
4.4 Phase and Nominal Compression Ratio Requirement 45 4.4.1 Determination of Knock and Compression-Ratio Constraints 45 4.4.2 Determination of Secondary Bore, Stroke, and Clearance Volume
Combinations 47
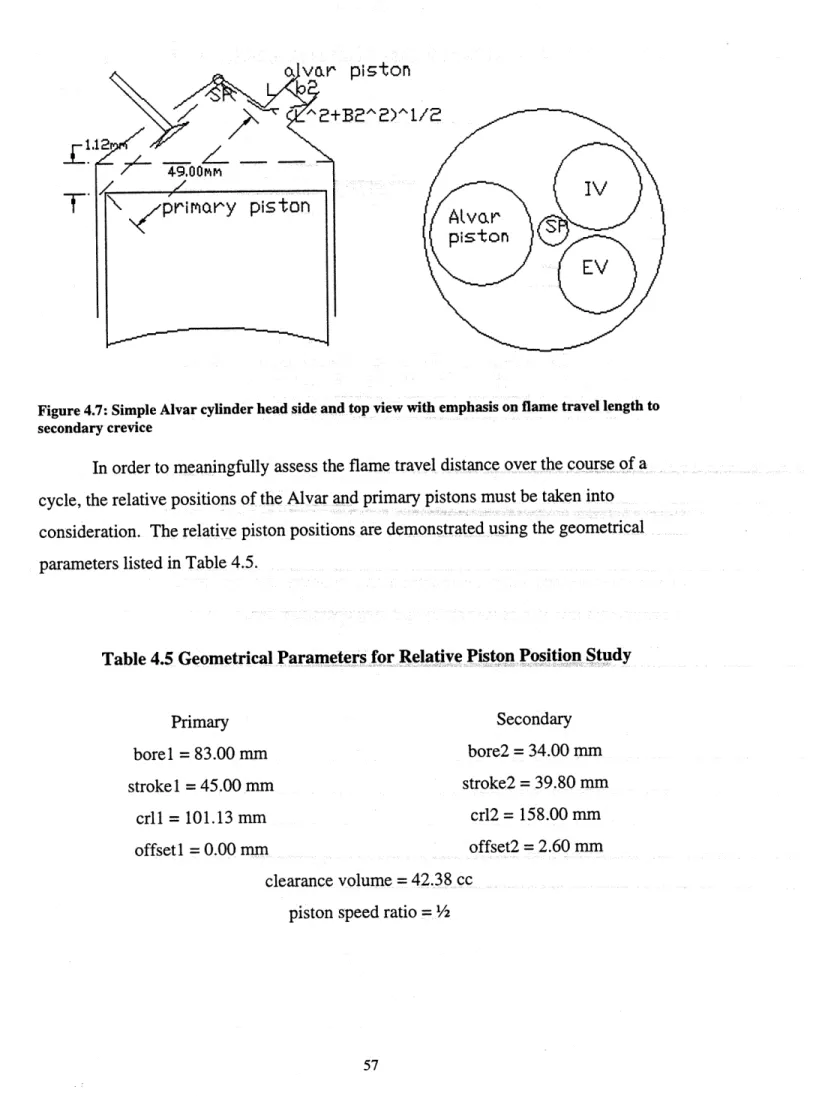
4.5 Flame Travel Requirement 55
4.6 Engine Performance Constraint 61
4.7 Alvar Piston Design 64
4.8 Obtaining Clearance Volume 64
4.8.1 Existing Geometry 65
4.8.2 Modifying Piston 68
4.8.3 Modifying Cylinder Head 70
4.9 Positioning of Alvar Piston 72
4.10 Clearance Volume Change 73
4.11 Discussion 74
4.12 Summary 75
Chapter 5 Compression-Ratio Effect on Efficiency 77
5.1 Introduction 77
5.2 Alvar-Conventional Engine Comparison at Baseline Conditions 78
5.3 Compression-Ratio Schedule 80
5.4 Alvar-Conventional Engine Comparison at Various Speed-Load
Conditions 81
5.5 Alvar-Conventional Engine Comparison for EPA Driving Cycle 83
5.6. Summary 87
Chapter 6 Turbocharged Alvar 89
6.1 Introduction 89
6.2 Knock Background 89
6.3 Modifications to Alvar Simulation & Test Runs 90
6.4 Analysis of Test Runs 92
6.5 Test Conditions
6.6 Results of Comparison 6.7 Summary
Chapter 7 Variable Engine Displacement
7.1 Introduction
7.2 Definition of Displaced Volumes 7.3 Mean Effective Pressures
7.4 Variable Engine Displacement
7.5 Summary
Chapter 8 Summary and Conclusions References
Appendices
Appendix A: Alvar Simulation Variables Appendix B: Alvar Patent
94 95 99 101 101 101 103 106 107 109 111 113 115 131
Acknowledgments
I begin this portion of my thesis by thanking God for the opportunities of life and specifically for bestowing me with the abilities necessary to accomplish the works placed in this document. Next, I extend my gratitude to my parents for serving as such inspiring role models, attesting to the benefits of perseverance and foresight. And to my brothers
and other loved ones who continuously provide encouragement, I extend thanks. To continue, I would like to acknowledge those whose direct interaction
contributed positively to this thesis. I greatly appreciate John Heywood and Victor Wong for providing the academic guidance and support that created an environment that
stretched my technical competency and therefore contributed to the evolution of a better engineer. Additionally, the remaining members of the Sloan Automotive Laboratory receive my thanks for contributing, in an aggregate sense, to the success of this work.
Last but not least, I would like to acknowledge Anders Hoglund, whose
simulation is the foundation of this work. I thank Anders for showing me the intricacies of the simulation. I thank Prof. Gunnar Lundholm for his kindness and encouragement all along. J.R. Linna was very helpful to me personally, as a friend, with his knowledge of the Volvo engine. In the final stage of the project, I had the benefit of looking at the work of Melvin Woods with Adiabatics, Inc. To all these people, I extend my gratitude.
This project is sponsored by the U.S. Department of Energy (Prime Contract Grant #01-95EE15618) and the Swedish Board for Industrial and Technical Development
(NUTEK) via a subcontract from Alvar Engine, AB.
Definition of Symbols and Abbreviations
0 -crank angle <p -fuel air ratio
y -ratio of specific heats Tic -compressor efficiency -if,i -fuel conversion efficiency 0o - crank angle at combustion start 11t -turbine efficiency
tt -induction time
a -Wiebe function constant A -area
AO -spark timing
A50 - 50 % burn duration
ABDC -after -bottom -dead -center afr -air-fuel ratio
ATDC -after -top -dead -center B -bore
bl = borel - primary bore b2 = bore2 -secondary bore
BBDC -before -bottom -dead -center BDC -bottom -dead -center
BMEP -brake mean effective pressure
Bref -reference bore c -mass burn rate constant cd -discharge coefficient
cfc 1 -primary pin friction coefficient cfc2 -secondary pin friction coefficient cfc -camshaft friction coefficient cgk -charge gas kappa value clv. -clearance volume
CMBMEP -compression stroke brake mean effective pressure
conht -heat transfer coefficient conrl -connecting rod length cpd 1 -primary crank pin diameter cpd2 -secondary crank pin diameter CR -compression ratio
CRref - reference compression ratio csd -camshaft diameter
csr -crank shaft speed ratio
cral -primary crank radius cra2 - secondary crank radius
crl 1 -primary connecting rod length crl2 -secondary connecting rod length crml -primary connecting rod mass crm2 -secondary connecting rod mass csr - crank speed ratio
cvmin - minimum compression stroke
volume
D90 - 10-90 % burn duration D99 - 1-99 % burn duration
D100 -0-100 % bum duration
deg. - degrees
DL - differential heat loss dtburn -burn duration
egk -exhaust gas kappa value EGR - exhaust gas recirculation EHL -exhaust heat loss
EPBMEP -expansion stroke brake mean
effective pressure
EVC - exhaust valve closing time EVL -exhaust valve lift
evmin - minimum exhaust stroke volume EVO -exhaust valve opening time EXBMEP -exhaust stroke brake mean
effective pressure
fhc - fuel heat of combustion fmw - fuel vapor mole weight
gpdl - primary gudgeon pin diameter gpd2 - secondary gudgeon pin diameter GIMEP - gross mean effective pressure h -convective heat transfer constant hlc -wall heat transfer coefficient IBMEP -intake stroke brake mean
effective pressure
IEF -indicated effective pressure IVC -inlet valve closing time IVL -inlet valve lift
ivmax -maximum intake stroke volume
IVO -inlet valve opening time kat -kappa activation temperature L - stroke
m -Wiebe function constant
mbdl -primary main bearing diameter mbd2 -secondary main bearing diameter N -cylinder numbers
NCR -nominal compression ratio nr -number of crank revolutions per power stroke
Nref -reference cylinder numbers ncy -number of cylinders
offset2 -secondary piston offset OR -octane requirement
ORref - reference octane number pl -compressor inlet pressure P2 -compressor exit pressure P3 -turbine inlet pressure p4 -turbine exit pressure Pamb -ambient pressure Pb -brake power
pdry -dry air pressure
pe -cylinder exhaust pressure
Pexhaust - exhaust manifold pressure pf -friction pressure
pfc 1 -primary piston friction coefficient pfc2 - secondary piston friction
coefficient
phi -fuel -air ratio pi -cylinder inlet pressure pi,wot -intake pressure at WOT Pintake -intake manifold pressure piml - primary piston mass pim2 -secondary piston mass
pivc -cylinder pressure at inlet-valve-closing
Pmax -maximum cylinder pressure Po - stagnation pressure
Ps -static pressure at restriction Pu -unburned cylinder gas pressure QHv -fuel heating value
Qw- wall heat loss R -universal gas constant rc -compression ratio
rc, ,f -reference compression ratio
rfc 1 - primary top ring friction
coefficient
rfc2 -secondary top ring friction
coefficient
rpm -revolution per minute s - crank pin to piston pin distance s 1 = stroke 1 -primary stroke s2 = stroke2 -secondary stroke T1 -compressor inlet temperature T2 -exit compressor temperature
T3 -turbine inlet temperature
T4 -turbine exit temperature
ta -Alvar induction time Tamb - ambient temperature
tbt -transmission belt tension Tb -brake torque
tc -conventional induction time tcha - charge temperature Tcw - cylinder wall temperature TER -total energy release Tfresh - charge temperature Tg - gas temperature
Thead -cylinder head temperature to - initial time
To - stagnation temperature Tpiston -piston temperature Tspark - spark timing
Tu - unburned cylinder gas temperature Tw - wall temperature
V -cylinder volume Vc -clearance volume Vd - displaced volume
vivc - volume at inlet - valve - closing vevo - volume at exhaust valve opening Wc - compressor work
wf,c - friction work through cycle WHL - wall heat loss
WI - indicated work wj - water jacket
WOT -wide open throttle
wp - pumping work
Xb - burned mass fraction
yy -piston crown to cylinder base
distance
List of Figures
Figure 2.1: Mass fraction burned versus normalized crank angle 27 Figure 2.2: Comparison of MIT and Alvar simulations to experimental Volvo data
-cylinder pressure versus crank angle for 900 RPM and part load 30 Figure 2.3: Comparison of MIT and Alvar simulation to experimental Volvo
data -cylinder pressure versus crank angle for 900 RPM and WOT 31 Figure 3.1: Brake mean effective pressure vs. secondary bore for given geometry 36 Figure 3.2: Nominal compression ratio versus secondary bore for given geometry 36 Figure 3.3: Nominal compression ratio versus phase shift for geometry 38 Figure 3.4: Brake mean effective pressure versus phase shift for given geometry 39 Figure 3.5: Indicated fuel conversion efficiency versus phase shift for given
geometry 40
Figure 4.1: Knock Requirement -compression ratio versus intake pressure
extracted from Patton Thesis 46
Figure 4.2: Nominal compression ratio versus phase shift for given geometry 49 Figure 4.3: Compression ratio range versus clearance volume 50 Figure 4.4: Secondary stroke versus secondary bore combinations meeting
compression-ratio range constraint 53
Figure 4.5: Secondary piston position at 15 degrees ATC and nominal compression ratio versus phase shift for b2 = 36.00 mm,
s2 = 35.10 mm, cr12 = 61.78 mm and clearance volume = 42.38 cc 54 Figure 4.6: Schematic of spark plug in-cylinder chamber locations 55
Figure 4.7: Simple Alvar cylinder head side and top view with emphasis
on flame travel length to secondary crevice 57
Figure 4.8: Piston position versus crank angle for phase of 0 degrees and
Figure 4.9: Piston position versus crank angle for phase of 180 degrees
and nominal compression ratio of 7:1 59
Figure 4.10: Secondary corner angular position at 15 degrees ATC versus
secondary bore for given phase shift 60
Figure 4.11: Cylinder wall heat loss versus secondary geometry for part
load and WOT operation, and engine speed of 3000 RPM 62 Figure 4.12: Torque versus secondary piston geometry for part load and
WOT operation, engine speed of 3000 RPM 63
Figure 4.13: Side view of conventional piston 65
Figure 4.14: Top view of conventional piston 66
Figure 4.15: 3-Dimensional schematic of pentroof cylinder head design 66 Figure 4.16: Combined top view of cylinder head and piston top 67 Figure 4.17: Addition to piston for purpose of reducing clearance volume 68 Figure 4.18: Side view of modified conventional piston 69 Figure 4.19: Side view of modified piston and cylinder head 70 Figure 4.20: Side view of pentroof cylinder and dimensions to cut for cylinder
head reduction 71
Figure 4.21: Side view of modified cylinder head with secondary piston 72 Figure 4.22: Top view of Alvar cylinder head with dual spark plug design 73 Figure 5.1: Brake power and torque versus engine speed for conventional
Volvo 850 engine 79
Figure 5.2: Compression ratio versus load schedule 81
Figure 5.3: Energy-weighted brake efficiencies for conventional and Alvar
engines for EPA City Driving Cycle 86
Figure 6.1: Alvar compression ratio-load schedule for turbocharged case study 95 Figure 6.2: Time required to autoignite versus boost pressure for conventional
and Alvar (CR=7.3) engines at 3000 RPM, with MBT 96 Figure 6.3: Time required to autoignite versus boost pressure for conventional
Figure 6.4: Figure 6.5: Figure 7.1: Figure 7.2: Figure 7.3: Figure 7.4:
In-cylinder unburned gas temperature versus brake power for scheduled Alvar and conventional engines at 3000 RPM, MBT Knock induction time versus brake power for Alvar and
conventional engines
Depiction of intake, compression, expansion, and exhaust displaced volumes for the Alvar engine at 0 degrees phase shift Displaced volume versus crank angle, with phase of 0 degrees and nominal compression ratio of 13:1
Displaced volume versus crank angle, with phase of 180 degrees and nominal compression ratio of 7:1
BMEP versus phase for given displaced volumes,
with engine speed of 3000 RPM, WOT operation, and MBT
98 99 102 104 104 106
List of Tables
Table 2.1 Simulation Inputs 25
Table 2.2 Simulation Test Cases 28
Table 2.3 Comparison Results 29
Table 3.1 Set Engine Parameters 33
Table 3.2 Connecting Rod Length Influence 41
Table 4.1 Conventional Engine Specifications 44
Table 4.2 Combinations for Nominal Compression Ratio -Phase Shift Study 48 Table 4.3 Additional Secondary Bore and Stroke Combinations 50
Table 4.4 Combinations that meet the Compression-Ratio Constraints 52 Table 4.5 Geometrical Parameters for Relative Piston Position Study 57 Table 4.6 Summations of Reductions for Modified Cylinder Head Approach 71 Table 5.1 Brake Power and Torque from Conventional Engine via Alvar Simulation 79 Table 5.2 Matching Alvar and Conventional Engines for Efficiency Comparison 80 Table 5.3 Conventional and Alvar (CR = 12.8) Engines at Low Load = 50 Nm 82
Table 5.4 Conventional and Alvar (12.5) Engines at Medium Load = 100 Nm 82 Table 5.5 Conventional and Alvar (CR = 10.1) Engines at High Load = 200 Nm 82
Table 5.6 EPA City Driving Cycle -Alvar CR Schedule 84
Table 5.7 Conventional Engine Under EPA City Driving Cycle 85
Table 5.8 Alvar Engine Under EPA City Driving Cycle 85
Table 6.1 Induction Time Comparison 96
Chapter 1
Variable Compression Ratio Background
The motivation to increase the efficiency and power density of the spark-ignition internal-combustion engine has fueled interest in the variable-compression-ratio engine. The primary advantages of a variable-compression-ratio engine are twofold. An ideal cycle analysis reveals that thermal efficiency increases with compression ratio [1]. The other advantage in changing the compression ratio of a spark-ignition (SI) engine lies in the ability to boost the intake pressure, thus the engine power output, without prematurely reaching knock limits. The compression ratio in an SI engine is limited by the knock phenomenon and fuel octane. Therefore, by reducing the compression ratio selectively at the high-load operating conditions, increased charge pressures may be used and increased power obtained without reaching the knock limit.
1.1 Previous Variable Compression Ratio Methods
Several methods have been used to vary the compression ratio of an internal-combustion engine. One method that has been cited and remains in use today is variable valve timing such as that used in the Miller Cycle [2]. Mazda has effectively used
variable valve timing to change the effective compression ratio. One feature of the valve-timing approach is the ability to change the effective expansion volume by moving the opening of the exhaust valve closer to or further away from bottom-dead-center (BDC). Increasing displaced volume at part loads and decreasing it at the wide-open-throttle (WOT) condition are the results. This engine achieves a high compression ratio and high boost by delaying inlet-valve-closing (IVC) and using a specially-designed compressor. However, adequate transition times are dependent on a reliable and sophisticated control system.
Another method includes the movement of an adjustable piece of the cylinder head within a secondary chamber to nominally vary the clearance volume, thus the compression ratio. This approach has been studied extensively by Volkswagen [3]. The
secondary piece recedes from the chamber to increase the clearance volume, and therefore decreases the compression ratio, during full-throttle operation. Similarly, the secondary piece moves closer towards the combustion chamber, to be flush with the cylinder head, to decrease the clearance volume, and therefore increases the compression ratio, during part-load operation. One possible problem with this technology is that consistent movement of the secondary piece may be questionable due to deposit and friction build-up.
A third method used to vary the compression ratio is to vary the crank radius in order to vary the clearance and swept volumes. A study at the Warsaw University of Technology [4] found that variation of the compression ratio could be accomplished by introducing an adjustable link between the crank and the connecting rod. However, there are foreseeable cost increases as a result of increased mechanical complexity.
Yet another method of varying the compression ratio is by varying the piston-crown height [5,6]. The complex piston has the drawback of increased weight and cost. Also, the intricacy of the piston raises concerns of production consistency and durability in operation.
Although the above methods vary in approach and application, each of the concepts attempted before has some major disadvantages. This thesis introduces an approach to achieve reliable and effective variations in compression ratio, as well as to increase the power density of the engine, hereafter called the Alvar engine, in honor of its inventor, Alvar Gustavsson.
1.2 The Alvar Variable Compression Ratio Engine Concept
The work being presented here focuses on the Alvar engine concept, which differs from the methods previously mentioned as it incorporates a moving secondary piston. The Alvar concept achieves variable compression ratios by changing the motion of a reciprocating auxiliary piston (secondary piston), which moves towards and recedes from the cylinder head. The motion of the secondary piston, in relation to that of the primary piston, is varied through a servo-control system. The control system traces a specified
of combustion within 60 crank-angle degrees is critical. In general, combustion stability increases with flame speed; an optimal flame speed would be conducive to the control of NOx emissions.
Another issue of concern in designing the cylinder head is the volumetric
efficiency. This design attempts to at least maintain, and riot deteriorate, the current level of volumetric efficiency. Volumetric efficiency is primarily governed by the design of the engine valves and ports which generate turbulence. However, adequate turbocharging (or supercharging) of the engine can alleviate some of the concerns.
One more issue of concern in designing the Alvar engine is heat transfer. Heat transfer affects not only the efficiency of the engine but also, perhaps more importantly, the structural integrity of the cylinder head due to thermal stresses.
Finally, the knock characteristics of the engine are studied in the design of the combustion chamber. Engine knock acts to limit the compression ratio, thereby limiting the engine efficiency. The determination of the likelihood of engine knock will be addressed extensively in this work.
1.4 Scope of Work and Approach
The work presented in this thesis includes an analysis of the Alvar variable-compression-ratio engine concept and the geometric factors for one Alvar engine combustion system. This work examines the Alvar engine's ability to deliver increased efficiency at part loads and increased power density at boosted intake pressures. Other characteristics of the Alvar engine are also examined.
The material presented in this thesiis is broken into two primary parts. The first
part addresses the effects of individual design parameters on the Alvar engine's performance, using appropriate cycle simulations, and the development of a
recommended Alvar-engine combustion-chamber design. The second part consists of a detailed engine-performance evaluation, including the effects of the special capabilities of the Alvar engine, such as variable-displacement-volume features.
load and speed schedule to attain the appropriate compression ratios. The crankshafts of the two pistons are linked through a pulley system, not unlike that connecting a crankshaft and camshaft, that allow a specified speed ratio of the two pistons to be maintained. The change in the relative piston motion serves to vary the clearance volume and the cylinder displacement volume.
Lia [7] performed a study on the Alvar engine concept and found that the idea was feasible and had the main advantage of eliminating the damage to the secondary piston due to deposit build-up. The main advantages of the Alvar concept over other variable-compression-ratio approaches are that: 1) the secondary piston is in constant motion so that soot and hydrocarbon deposits do not occur, 2) the Alvar system is mechanically simple, 3) the Alvar system allows for variable displacement volumes as well as variable compression ratios, and 4) the effective compression ratio can still be varied through valve-timing control.
1.3 Objective of the Present Study
The objective of this project is to develop a geometric design for a combustion chamber of an Alvar engine system. This project constitutes one task in a multi-tasked program to develop and demonstrate the feasibility of the Alvar engine system. The combustion chamber will be built into a modified cylinder head, which will fit onto an existing Volvo 850 engine cylinder block. Therefore, specifications for the primary
chamber and piston are given. The secondary chamber specifications needed to be studied include piston bore, stroke, connecting rod length and piston offset. Additionally, outside the overall design of the cylinder-head components, the phase-shift logic as a function of speed-load schedule in achieving certain variations in compression ratio is necessary. Furthermore, these efforts attempt to achieve the proper design without introducing compromises with other factors such as combustion reliability, volumetric efficiency, heat transfer, and the increased risk of engine knock.
In terms of combustion reliability, the need to produce a cylinder-head and combustion-chamber design that maintains a moderate flame travel speed and is capable
~__11___~_111_11__11I___l__~.~_l---~l~lt _ ._--I
1.5 Organization of Thesis
The next Chapter, Chapter 2, provides insight into the tools used in the analysis, namely the MIT and Alvar cycle simulations. Chapter 3 includes a parametric study of the Alvar engine concept. Next, Chapter 4 describes the design process used to develop a recommended Alvar combustion-chamber design. The subsequent chapters focus on the performance aspects of the Alvar engine. These areas include an analysis of engine efficiencies in Chapter 5 and an analysis of the turbocharged operation of the Alvar
engine for higher power density in Chapter 6. In each case, comparisons with a conventional engine are made. Next, in Chapter 7, the issue of variable displacement volume is addressed with emphasis on its effect on the mean effective pressure. The thesis concludes with a summary of this work, which is just a part of a larger program in the development of the Alvar engine.
6:i 'i:r '· it
Chapter 2
Validation of Engine Simulations
2.1 Introduction
To begin the Alvar engine analysis, two four-stroke engine simulations were used: the MIT and the Alvar simulations. The two simulations were used in order to compare the outputs and thereby confirm the reliability of the simulations. Since the MIT
simulation for conventional engines has been validated in many applications over the years, comparison of this simulation with the Alvar simulation serves to raise confidence in the simulations. The Alvar simulation will be used heavily in our subsequent analysis. The Alvar simulation is capable of simulating the operation of a conventional engine as well, as a special case. The outputs from both simulations were further validated by comparing both outputs with experimental data from a single-cylinder engine that has the combustion-chamber configuration of a Volvo-850 in the Sloan Automotive Laboratory.
The two simulations are similar in many respects. However, the MIT simulation takes into account gas-exchange processes and is slightly more comprehensive, while the
Alvar simulation focuses on the special features of the Alvar engine.
In comparing the simulations, we examine the performance of a five-cylinder engine. The gas exchange, heat transfer, and combustion processes as well as the engine thermodynamics are described here. The approaches to calculating the friction work are
also included.
2.2 The MIT Engine Cycle Simulation
The MIT simulation code is designed to simulate the spark-ignition four-stroke internal-combustion engine over a large range of operating conditions and geometric specifications. This simulation is a quasi-dimensional model in that it is designed to describe changes in the bulk properties of the cylinder contents. However, it does have a flame propagation model that describes the development of the flame front across the combustion chamber.
The cycle consists of the intake, compression, expansion (combustion), and exhaust processes which are treated as a sequence of processes within a multi-cylinder engine. The gas-exchange process calculates the mass flow rate across the valves, given
the opening area, discharge coefficient, and the pressure ratio across the valves. The gas-exchange process is governed by the following relation,
dm/dt = [cd Apo /(RT o)] * (yRTo)1/2 * [2/(y-1) * (p, /Po) * (2/y) -(ps/p o) * (y+l)/y] 1/2
where Cd represents the discharge coefficient, A represents the valve opening area, Po represents the stagnation pressure upstream of the restriction, p, represents the static pressure at the restriction, To represents the stagnation temperature upstream of restriction, y represents the ratio of specific heats, and R represents the gas constant.
The heat transfer to the cylinder walls is governed by the following relation,
dQw/dt = hA(Tg -Tw)
where h represents the convective heat transfer coefficient, A represents the cylinder wall surface area, Tg represents the gas temperature, and Tw represents the wall temperature. The heat transfer coefficient is derived from a Nusselt-versus-Reynolds-number
correlation.
In terms of combustion, the MIT simulation allows the use of a motoring-operation mode, a phenomenological flame-propagation model, or a specified bum-rate curve, which is the Weibe function and will be addressed in detail later in this chapter.
The MIT simulation incorporates friction losses in terms of rubbing and pumping losses. The MIT simulation also includes a turbulent flow model since the combustion and heat transfer models of the cycle simulation require estimates of a characteristic velocity and length scales. The turbulent flow model, which consists of a
zero-dimensional energy cascade, is used to estimate these scales while including the physical mechanisms affecting charge motion in the cylinder.
The friction work over the cycle is calculated by summing over the pressure volume curve as shown below,
Wf,c = f pf * dV
where Wf,c represents the friction work over one cycle, pf represents the frictional pressure, and dV is the swept volume. Similarly, the pumping work is obtained by calculating the net work to the piston over the exhaust and intake strokes and is reduced
as shown below,
Wp = (pi - Pe) (A
V)
where W, represents the pumping work, pi and pe represent the intake and exhaust
pressures respectfully, and AV represents the change in the volume over the compression
or expansion stroke.
2.3 The Alvar Engine Cycle Simulation
The Alvar simulation, otherwise called the Hoglund simulation, also addresses the thermodynamics of the combustion process, gas exchange, heat transfer, and friction processes. The combustion process differs from that of the MIT simulation in that there
is no option to operate in a motoring or phenomenological flame-propagation mode . The Alvar simulation uses a cosine function to specify the mass burn rate. This approach is described in more detail later in this chapter. The gas-exchange process of the Alvar simulation differs from that of the MIT simulation in that it is significantly simpler. The Alvar simulation merely takes into account the volume available in the cylinder as a function of crank angle.
The heat transfer mechanism used in the Alvar simulation does not differ from that used in the MIT simulation significantly. The heat transfer approach in the Alvar
simulation relies on a First Law energy balance that includes the heat loss through exhaust (EHL), heat loss through the cylinder wall (WHL), and energy responsible for producing the indicated work (WI). These values must continuously match the total energy released (TER) throughout the course of the four-stroke cycle. The simulation provides that the following sum must hold.
TER = EHL + WHL + WI
The cylinder-wall heat loss is calculated continuously as conditions change in the combustion chamber per crank angle. The equation below illustrates the iterative
response used in the simulation,
WHL = WHL + DL
where the differential heat loss is represented by DL. The heat loss coefficient is also treated as an input into the simulation. This value must be calibrated to produce correct heat loss values.
The friction analysis implemented in the Alvar simulation includes the frictional characteristics of both the primary and secondary chambers separately. The relationships between the brake, indicated, gross, and friction work terms are conventional. The distinguishing features of the friction calculations in the Alvar simulation are: 1) the introduction of the secondary chamber friction characteristics of the Alvar simulation,
~----1~---·*---and 2) the exclusion of a turbulent flow model by the Alvar simulation. Note that the friction coefficients of the secondary chamber can be scaled from those of the primary piston since there are no novel additional sources of friction to be considered, such as a swirl effect created by the presence of the secondary piston due to the introduction of the secondary chamber.
After the Alvar simulation was checked against the MIT simulation, it was used to gain an understanding of the Alvar engine performance as a function of geometric
changes and compression ratio shifts. These studies set the stage for a design analysis of the Alvar engine.
2.4 Matching MIT and Alvar Inputs
The Volvo 850 engine specifications that were input into both simulations are shown below in Table 2.1. The specifications below were extracted from the MIT simulation input file.
Table 2.1 Simulation Inputs
* rpm = 1600 fuel type = propane
phi = 1.00 EGR = 0.00 * Pintake = 0.65 atm Pexhaust = 1.00 atm Tfresh = 300. 00 K Tpiston = 403.00 K Thead = 373.00 K Tcw = 363.00 K conht = 0.04 fire = t (spark ignition)
IVO = 0.00 deg. IVC = 228.00 deg. EVO = 488.00 deg. EVC = 720.00 deg. Tspark = 340.00 deg. bore = 83.00 mm clv. = 53.28 cc stroke = 90.00 mm conrl = 158.00 mm Tamb = 300.00 K Pamb = 1.00 atm dtburn = 60.00 deg.
Table 2.1 shows the specifications that were input into both simulations. Note that the marked variables (*) were varied throughout the comparison and that miscellaneous parameters were excluded.
One important difference in the two four-stroke simulations is the means by which the combustion process was simulated. The MIT code relies on a bum-fraction curve
called the Weibe function, while the Alvar simulation uses a cosine function. The Wiebe is shown below.
Xb = 1 - exp[-a((-Oo)/ AO)m+l]
The cosine function used for the mass burn rate of the Alvar simulation is of the form,
mb = c{
1-Cos[n(0-80)l
/A]I
where 0 is the crank angle, 0o is the start of combustion, AO is the total combustion duration, a, c and m are constants.
The burned-fraction curves of both programs were matched. This was
accomplished by constructing a specified bum-fraction curve (curve in which the percent of mass burned was specified over a crank angle interval) and placing this specification into both simulations. The burn fraction curve is shown in Figure 2.1.
1 0.9 . 0.8 E 0.7 , 0.6 0 C-, 0.5 0.4 S0.3 E 0.2 0.1 0
.1=o0 OUuy. .JV-,, U, . a = (T-Tspark)/DTBRN .68=389 deg.
Figure 2.1: Mass fraction burned versus normalized crank angle
As shown in Figure 2.1, the mixture mass is 10 percent burned at 356 degrees of the crank angle, 50 percent burned at 362 degrees and 90 percent burned at 381 degrees. This burned-fraction curve was placed in both simulations. Also note that the heat loss coefficient of the cylinder wall is 0.08 for the Alvar simulation, and 0.04 for the MIT simulation. This coefficient is a soft constraint in that it is varied to create a reasonable heat loss percentage at a reference point. Additionally, the programs were run at
stoichiometric fuel-air ratio. Note that the following Volvo 850 geometric specifications were entered into both simulations.
stroke = 90.00 mm bore = 83.00 mm conrl = 158.00 mm clv. = 53.28 cc
Eight cases were run with data from this conventional engine. The varied parameters are listed next in Table 2.2.
Table 2.2 Simulation Test Cases engine speed, rpm 900 900 1600 1600 2400 2400 3200 3200
intake press., kPa 37.60 102.70 37.60 102.55 57.80 101.33 54.10 102.40
2.5 Comparison of MIT and Alvar Simulation Results
2.5.1 Comparison between MIT and Alvar (Hoglund) Simulations
The indicators used here to determine the correlation between the two simulations were the indicated mean effective pressures, maximum cylinder pressure and heat release results. The percent difference in values were calculated for each case. The average percent differences for the gross indicated mean effective pressure (GIMEP), heat loss,
and net indicated efficiency are 5.9, 4.8, and 0.9 percent, respectively. Table 2.3 shows impressive agreement exists for heat loss values, as these numbers do not reflect percent heat loss of chemical energy. See Table 2.3.
test casel 1 case2 case3 case4 case5 case6 case7 case8 -- --- ---·--··--- ---·-- ---~---n
Table 2.3 Comparison Results
test GIMEP, GIMEP, differ- Ht Loss,J Ht Loss,J differ- Net Net differ-kPa kPa ence ence Ind.Eff Ind.Eff ence
Hoglund MIT % Hoglund MIT % %, Hogl. %, MIT %
casel 364.80 416.50 12.40 28.28 29.51 4.17 34.30 34.20 0.26 case2 1337.50 1274.10 4.97 75.89 67.59 12.28 41.40 41.20 0.44 case3 366.20 410.60 10.81 25.39 27.22 6.72 34.40 34.30 0.41 case4 1339.80 1283.40 4.40 67.95 63.65 6.76 41.50 41.40 0.24 case5 669.40 666.70 0.41 36.70 37.12 1.13 38.90 38.30 1.46 case6 1322.80 1256.90 5.24 62.15 60.25 3.15 41.50 41.30 0.58 case7 614.80 600.50 2.39 32.54 33.51 2.89 38.40 37.50 2.51 case8 1340.90 1255.10 6.84 59.39 58.65 1.26 41.60 41.10 1.27
2.5.2 Comparison of Simulations against Experimental Data
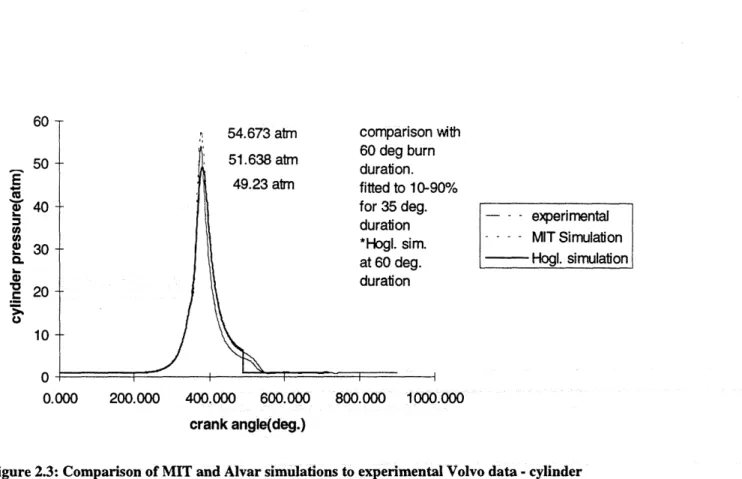
Next, the simulations were compared to experimental cylinder pressure data from the single-cylinder configuration of the Volvo 850. The MIT simulation burn duration of 60 degrees was translated to a 10-90 percent burn duration of 35 degrees and met the experimental pressure curve well. The Alvar simulation maintained the 60 degree duration and visually lags behind the experimental curve slightly more than the MIT simulation as a result. In noting the pressure curves for both part-load and wide-open-throttle operation, there exists a closer agreement at the wide-open-wide-open-throttle condition is apparent.
Propane was used at 900 rpm and part-load operation in making comparisons between the simulations and against the experimental pressure curve. See Figure 2.2 below.
comoarison with 21.730 atm 17.474 atm 14.467 atm 1 on deg. )deg. )n - experimental - - - - MIT simulation ... Hogl. simulation 0.000 200.000 400.000 600.000 800.000 1000.000 crank angle(deg.)
Figure 2.2: Comparison of MIT and Alvar simulations to experimental Volvo data -cylinder pressure versus crank angle for 900 RPM and part load
An equivalent match was made between the simulations and the experimental curve with all constraints maintained except intake pressure, which was increased to WOT. See Figure 2.3 below.
0
with )0% - - experimental ---- MIT Simulation Hogl. simulation I 0.000 200.000 400.000 600.000 800.000 1000.000 crank angle(deg.)
Figure 2.3: Comparison of MIT and Alvar simulations to experimental Volvo data -cylinder pressure versus crank angle for 900 RPM and WOT
2.6 Summary
The comparison between the Alvar and MIT internal combustion simulations proved that the two simulations sufficiently matched. The simulations were also found to match reasonably well with the experimental data. The differences in the approaches of the simulations produced anticipated differences in the results of the models, but despite the small discrepancies, the engine models correlate well. Therefore the Alvar (Hoglund) simulation should be a powerful tool in the analysis and design of the Alvar engine. Hereafter the Alvar simulation will be used.
50 E ) 40 2 30 S20 10 0
Chapter 3 Parametric Studies
The parametric study serves to gain insight into the performance characteristics of the Alvar Engine. Any trends identified here would help in understanding the behavior of the Alvar engine and thereby aid in the design process.
3.1 Approach
The approach used in the parametric study is to identify relevant parameters and vary these parameters individually from a set of baseline parameters. The studies were performed with the set of baseline parameters shown in Table 3.1. However, the two asterisks (*) denote changes at some point.
Table 3.1 Set Engine Parameters Geometry:
bore l(borl) = 83.00 mm crank rad. 1(cral) = 45.00 mm con.rod lengthl(crll) = 158.00 mm
crankshaft offset(csol) = 0.00 mm clearance vol.(clv) = 58.28 cc effective compression ratio(ecr) = 10.00
Masses:
primary piston mass (piml) = 700.00 g primary con.rod mass(crml) = 700.00 g secondary piston mass(pim2) = 200.00 g secondary con.rod mass(crm2) = 200.00 g
no. of cylinders (ncy) = 5
*bore2(bor2) = 40.00 mm *crank rad.2(cra2) = 2.00 mm con.rod length2 (crl2) = 80.00 mm
crankshaft offset(cso2) = 0.00 mm crankshaft speed ratio(csr) = 0.50
Diameters:
gudgeon pin diameterl(gpdl) = 23.00 mm crank pin diameterl(cpdl) = 53.00 mm main bearing diameterl(mbdl)= 64.00 mm
gudgeon pin diameter2(gpd2) = 12.00 mm crank pin diameter2(cpd2) = 38.00 mm main bearing diameter(mbd2) = 53.00 mm
camshaft diameter(csd) = 48.00 mm
-Friction:
piston friction coeff. 1(pfcl) = 0.05 top ring friction coeff. 1 (rfc 1) = 0.18 gudgeon pin friction coeff. 1 (gfc 1) = 0.05
crank pin friction coeff. 1 (cfc 1) = 0.01 main bearing friction coeff. 1(mfcl) = 0.01
camshaft friction coeff.(cfc) = 0.20 valve spring force(vsf) = 800.00 N
Heat Release:
spark timing(AO) = 340.00 deg. 50% burn fraction(A50) = 367.00 deg. 10 - 90% burn duration(D90) = 18.73 deg.
1 -99% burn duration(D99) = 47.00 deg. 0 - 100% burn duration(D100) = 54.00 deg.
Conditions:
engine speed(esp) = 2400 rpm ambient pressure(pamb) = 101.33 kPa
dry air pressure(pdry) = 101.33 kPa cylinder pressure @IVC(pivc) = 101.33 kPa
exhaust back pressure(pexb) = 100.33 kPa ambient temperature(tamb) = 300.00 K
piston friction coeff.2(pfc2) = 0.05 top ring friction coeff.2(rfc2) = 0.18 gudgeon pin friction coeff.2(gfc2) = 0.10
crank pin friction coeff.2(cfc2) = .01 main bearing friction coeff.2(mfc2) = .01
transmission belt tension(tbt) = 200.00 N
fuel heat of combustion(fhc) = 46.30 J fuel vapor mole weight(fmw) = 114.23 g/mole
air fuel ratio(afr) = 14.50 stoichiometric A/F(afr) = 14.50
equivalence ratio = 1.00
charge temperature(tcha) = 300.00 K wall temperature(twal) = 300.00 K cylinder wall heat transfer coeff.(hlc) = 0.08
exhaust gas recirculation(egr) = 0.00 charge gas kappa value(cgk) = 1.38 exhaust gas kappa value(egk) = 1.34 Kappa activation temp(kat) = 1500.00 K
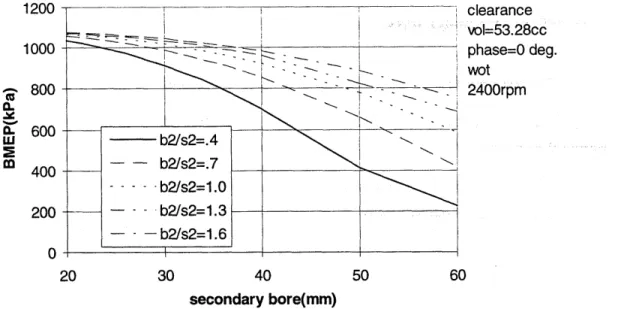
3.2 Effect of Secondary Bore
The first study focused on the effect of secondary bore on indicated mean effective pressure, brake mean effective pressure, maximum cylinder pressure, and nominal compression ratio. Note that the set parameters included clearance volume, secondary bore-stroke ratio, phase (for this section of the study), secondary connecting rod length, secondary-stroke ratio, intake pressure and engine speed. See list below for a summary of set parameters.
clearance volume phase
secondary connecting rod length (crl2) / secondary stroke (s2) intake cylinder pressure (Pintake)
engine speed
Note that the effective compression ratio differs from the nominal compression ratio because the valve timing is set to IVC at 56 degrees after BDC and EVO at 48
degrees before BDC as extracted from conventional engine specifications. Each case differs by a secondary bore-stroke ratio which ranged from 0.4 to 1.6.
Figure 3.1 illustrates the effect of secondary bore on brake mean effective pressure. Note that the shorter stroke (higher secondary bore-stroke ratio) serves to
increase the mean effective pressure as anticipated since the clearance volume remains constant as displaced volume is decreased.
clearance vol=53.28cc phase=0 deg. wot
2400rpm
40 secondary bore(mm)Figure 3.1: Brake mean effective pressure versus secondary bore for given geometry
Next, the geometrical relation between secondary bore and nominal compression ratio is illustrated as clearance volume and phase are held constant. Figure 3.2 shows that in order to maintain the clearance volume with increasing secondary bore, the
compression ratio must be increased. This is intuitive since NCR = (Vc + Vd)/Vc. Also note that decreasing stroke serves to minimize this effect.
16 16- b2/s2=.4 15- - b2/s2=.7 14 - b2/s2=1.0 --- b2/s2=1.3 13- - - b2/s2=1.6 12 10 clearance vol=53.28cc phase=0 deg. wot 2400rpm 40 secondary bore(mm)
Figure 3.2: Nominal compression ratio versus secondary bore for given geometry 1200 1000 800 600 400 200 0 ---- -
---- -
b2/s2=.4
--
b2/s2=.7
S- . b2/s2=1.0 .-.. b2/s2= 1.3 - --- b2/s2=1.6===F---
I --- 1-L-3.3 Effect of Phase Shift
The next relation covered in the parametric study is the effect of phase shift on indicated thermal efficiency (IEF), brake mean effective pressure (BMEP), maximum cylinder pressure (Pmax), and compression ratio. Recall that the phase shift is used
solely for the purpose of changing the compression ratio by changing the relative motions of the two pistons, and that this is achieved by adjusting the timing of the secondary piston. Again this study uses conventional primary chamber geometry. For each case, the secondary bore, stroke, and therefore clearance volume is set, and the ratio of
secondary connecting rod length to secondary stroke is set to 1.76. Moreover, the engine operates at WOT, 2400 rpm, and the clearance volume is set for a nominal compression ratio of 14 at a phase of 0 degrees. The following list of set and varied parameters was used.
clearance volume secondary bore (b2) secondary stroke (s2)
secondary connecting rod length (cr12) intake cylinder pressure (Pintake)
engine speed
The phase was varied from 0 to 180 degrees for each case. Below is a list of secondary bore and stroke combinations for each case.
'--;--b2 = s2 b2 = s2 = 45.0 mm b2 = s2 = 30.0 mm b2 = s2 = 20.0 mm b2 = s2 / 1.5 :40.0 mm, s2 = 60.0 mm : 30.0 mm, s2 = 45.0 mm : 20.0 mm, s2 = 30.0 mm
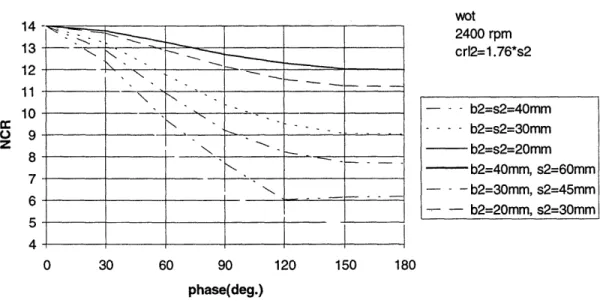
Figure 3.3 shows how the change in phase varies the nominal compression ratio. Note that the dependence of nominal compression ratio (NCR) on phase must be
calibrated into the mechanical system. Also note that the NCR rebounds to a compression ratio of 14 when phase is allowed to sweep from 180 to 360 degrees.
wot 2400 rpm crI2=1.76*s2 0 30 60 90 phase(deg.) 120 150 180
Figure 3.3: Nominal compression ratio versus phase shift for given geometry
-- - b2=s2=40mm - -- - b2=s2=30mm - b2=s2=20mm -b2=40mm, s2=60mm S- - b2=30mm, s2=45mm -- - b2=20mm, s2=30mm ----~-~~ --~-~-~`~~-- ~
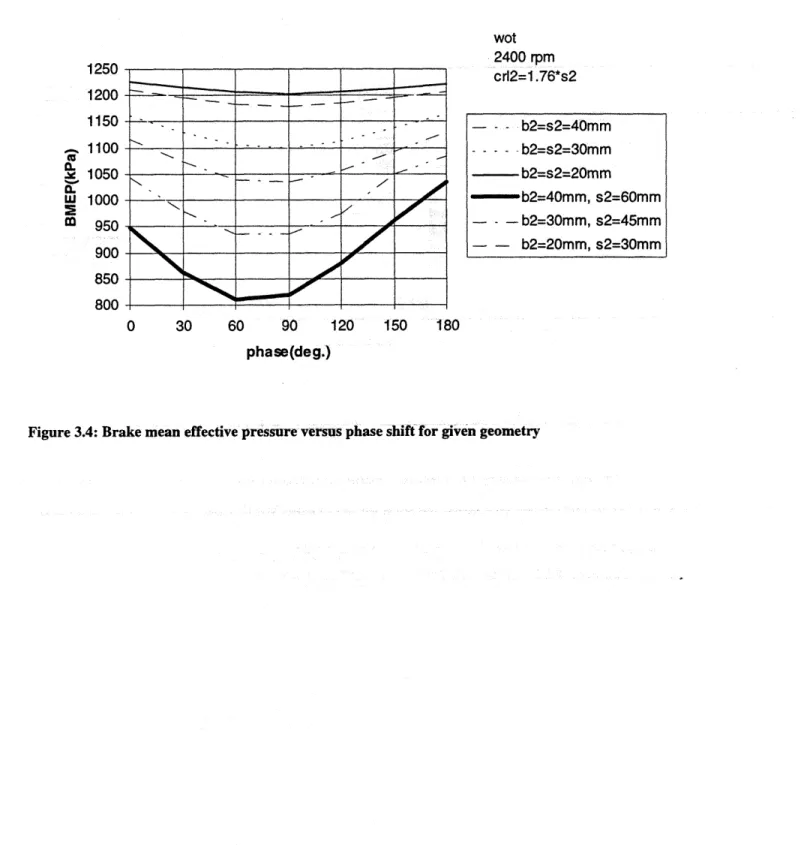
Next, the effect of phase on BMEP is shown in Figure 3.4. Again, note the symmetry as the BMEP reaches a minimum at a phase of 90 degrees. Note that the secondary piston has swept half the stroke at combustion when operating at a phase of 90 degrees. wot 2400 rpm 1 zb 1200 1150 1100 1050 1000 950
900
850 800 crl2=1.76*s2 0 30 60 90 120 150 180 phase(deg.)Figure 3.4: Brake mean effective pressure versus phase shift for given geometry
- - -b2=s2=4Omm ---- b2=s2=30mm b2=s2=20mm -b2=40mm, s2=60mm - - -- b2=30mm, s2=45mm -- b2=20mm, s2=30mm
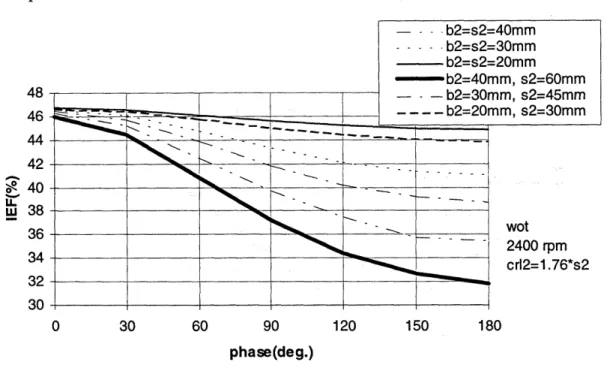
Next, in viewing Figure 3.5, note that the variance of indicated thermal efficiency as a result of phase variance is a direct result of the variance of the nominal compression ratio with phase.
-- I
I
S- - b2=s2=40mm . b2=s2=30mm b2=s2=20mm -b2=40mm, s2=60mm - - - b2=30mm, s2=45mm -- - - b2=20mm, s2=30mm wot 2400 rpm crl2=1.76*s2 30 60 90 phase(deg.) 120 150Figure 3.5: Indicated fuel conversion efficiency versus phase shift for given geometry
Finally, the effect of secondary connecting rod length is minute, as anticipated. While secondary bore and stroke were held at 30 mm, WOT operation, an engine speed of 2400 rpm, and a phase of 60 degrees, the secondary connecting rod length was varied -from a length of 40 mm to 140 mm. See Table 3.2 for results.
180
I I
~---i
i=
Table 3.2 Connecting Rod Length Influence CRL2 NCR IEF BMEP mm % kPa 40 11.83 44.83 1106.26 60 11.97 45.98 1111.87 80 12.03 45.06 1114.58 100 12.07 45.10 1116.19 120 12.10 45.13 1117.25 140 12.12 45.15 1118.01 3.4 Summary
The parametric studies in this chapter illustrate the effect of secondary bore and phase on the performance characteristics of the Alvar engine, such as efficiency and mean effective pressure. This study serves to confirm that the mechanisms that motivate this
project do exist and that the secondary chamber geometry (i.e. secondary bore and stroke) play a role in optimizing these effects.
Chapter 4 Alvar Engine Design 4.1 Introduction
One of the objectives of this project is to design the geometries of the primary and secondary (Alvar) chambers that will fit into a cylinder head ofa single-cylinder version of a Volvo 850 engine.
The Alvar engine design is to meet the following specifications.
intake pressure = 2.0 bars absolute primary piston speed = 3000 rpm maximum cylinder pressure = 100.0 bars
compression ratio range = 13 -7
4.2 Scope of Work and Approach
This thesis includes the analysis and the proposed geometric design of a single cylinder head that includes the Alvar piston shape, size of the combustion chamber, and locations of valves and spark plug(s), etc. The design considered constraints of
compression ratio range, flame travel concerns, and secondary-bore fit into the conventional cylinder head.
4.3 Conventional Cylinder Head
To begin the description of the Alvar design process it is necessary to note that the design is a derivative of the Volvo 850 cylinder head. In noting this, the existing
conventional cylinder head and piston geometry must be briefly described. The standard Volvo 850 engine has four valves per cylinder. The number of cylinders used in the engine is not a design concern as the project calls for the construction of a single-cylinder engine. See Table 4.1 for specifications of the conventional engine from which the Alvar engine design is derived.
Table 4.1 Conventional Engine Specifications
Displaced Volume (dm3)
Stroke (mm)
Bore (mm)
Connecting Rod Length (mm) Head Gasket Diameter (mm) Head Gasket Thickness (compressed-mm)
Piston Protrusion @ TDC (mm) (relative to top of liner) Clearance Volume (cc) Intake Valve Diameter (mm)
Max Inlet Valve Lift (mm) Exhaust Valve Diameter (mm) Max Exhaust Valve Lift (mm)
(5 - cylinders) 2.50 90.00 83.00 158.00 85.00 1.40 0.40 53.28 31.00 8.45 28.00 8.45
These specifications make up the existing Volvo 850 cylinder head, hereby called conventional head. These specifications make up what is referred to in this work as the primary specifications. The Alvar therefore has a primary bore of 83 mm. A secondary
4.4 Phase and Nominal Compression Ratio Requirement
4.4.1 Determination of Knock and Compression-Ratio Constraints
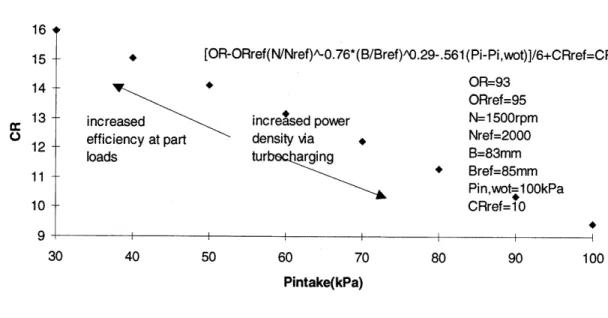
It is well understood that the compression ratio of the spark ignition (SI) engine is limited by the autoignition, or knock, phenomenon. Knock is a necessary concern in the design process of this engine. A referenced knock model was used to help determine the appropriate compression ratio range [8]. The model, shown below, relies on several empirically-based relations between the spark-ignition octane requirement (OR), piston bore (B), engine speed (N), cylinder intake pressure (Pi) and compression ratio (re).
OR = ORref (N/Nref)-007 6
(B/Bref).02 9 + 0.561(pi - Pi,wot) + 6.0(rc -rc,ref)
This relation was then used to correlate the compression ratio requirement with cylinder intake pressure. It should be noted that this knock model was used here in an approximate manner to develop a reasonable compression ratio range within the knock limits.
Next, Figure 4.1 shows the relation between the knock-limited nominal compression ratio and cylinder intake pressure.
16 1
15 -14 -13 -12 -11 -10 9-S[OR-ORref(N/Nref)A-0.76*(B/Bref)/0.29-.561 (Pi-Pi,wot)]/6+CRref=CR . OR=-93 ORref=95 Sincreased increased power N=1500rpm
efficiency at part density via Nref=2000 loads tur rging B=83mm
Bref=85mm Pin,wot=100kPa CRref=10 II I I 30 40 50 60 70 80 90 100 Pintake(kPa)
Figure 4.1: Knock Requirement -Compression ratio versus intake pressure extracted from Patton thesis
From Figure 4.1, a conservative range of 13 to 7 was extracted for the
compression ratio. A linear extrapolation in the direction of decreasing compression ratio suggests that a boosted pressure is applicable for a compression ratio of 7:1. Note that the reference parameters of bore, engine speed, cylinder intake pressure, and compression ratio are originally based on a typical four-valve spark ignition engine [8]. The reference parameters were chosen to be reasonable values for a slightly smaller vehicle operating at the world-wide-operating point.
world-wide-operating point engine speed = 1500 rpm
brake mean effective pressure = 325.00 kPa gross indicated mean effective pressure = 450.00 kPa
net indicated mean effective pressure = 400.00 kPa cylinder intake pressure = 50.60 kPa
As Figure 4.1 illustrates, these parameters produce a compression ratio range from 16.0 to 9.7. Note that the conventional engine (unmodified) operates at a compression
ratio range of 10.1. The plan to operate with more conservative compression ratios at turbocharged conditions led to the decision to design the Alvar engine for a compression-ratio range of 13 -7.
4.4.2 Determination of Secondary Bore, Stroke, and Clearance Volume Combinations
Once the compression ratio range was chosen, parametric studies were performed to determine the appropriate secondary geometry. At this stage the secondary bore (b2),
stroke (s2), and phase shift were the focus, while the secondary connecting rod length (crl2) and offset were maintained as soft constraints. To that point the secondary connecting rod length was taken in the same proportion to the secondary stroke as the following relation of the primary stroke and connecting rod length of the conventional engine.
crll / sl = 1.76 = crl2 / s2
Also note that the secondary offset was assumed to be half of the secondary crank radius or a quarter of the secondary stroke distance. This offset was chosen as it was decided that an offset would benefit the performance of the engine, particularly by reducing friction. Later studies would serve to determine the necessity of a secondary offset.
The first Alvar parametric tests were used to identify secondary bore and stroke combinations that would satisfy the compression ratios (13 to 7) specifications. To
narrow the possibilities, the nominal compression ratio was plotted against the phase shifts. Note that the phase shift serves the sole purpose of controlling the phase of the secondary piston, or its motion relative to that of the primary piston. The need to work within the constraints of the conventional cylinder head suggested that a secondary bore less than approximately 40 mm, and a secondary stroke not exceeding approximately 50 mm would fit. Therefore, the upper-most case was taken as a secondary bore of 40 mm and a secondary stroke of 50 mm. Similarly, structural integrity motivated a lower limit
on the secondary bore of 20 mm. An corresponding lower limit for the secondary stroke was taken as 10 mm. A lower combination was therefore taken with a secondary bore of 20 mm, and secondary stroke of 10 mm. The combinations of the secondary geometry used in this study are shown below in Table 4.2. Note that the clearance volume for each secondary bore and secondary stroke combination is determined by the constraint that CR = 13 at phase shift = 0.
Table 4.2 Combinations for Nominal Compression Ratio-Phase Shift Study
bore2 stroke2 conrl2 offset2 clearance vol.
mm mm mm mm cc 20.00 10.00 17.60 2.50 40.74 20.00 20.00 35.20 5.00 40.89 20.00 30.00 52.80 7.50 41.05 30.00 20.00 35.20 5.00 41.29 30.00 30.00 52.80 7.50 41.65 30.00 40.00 70.40 10.00 42.01 40.00 30.00 52.80 7.50 42.49 40.00 40.00 70.40 10.00 43.14 40.00 50.00 88.00 12.50 43.79
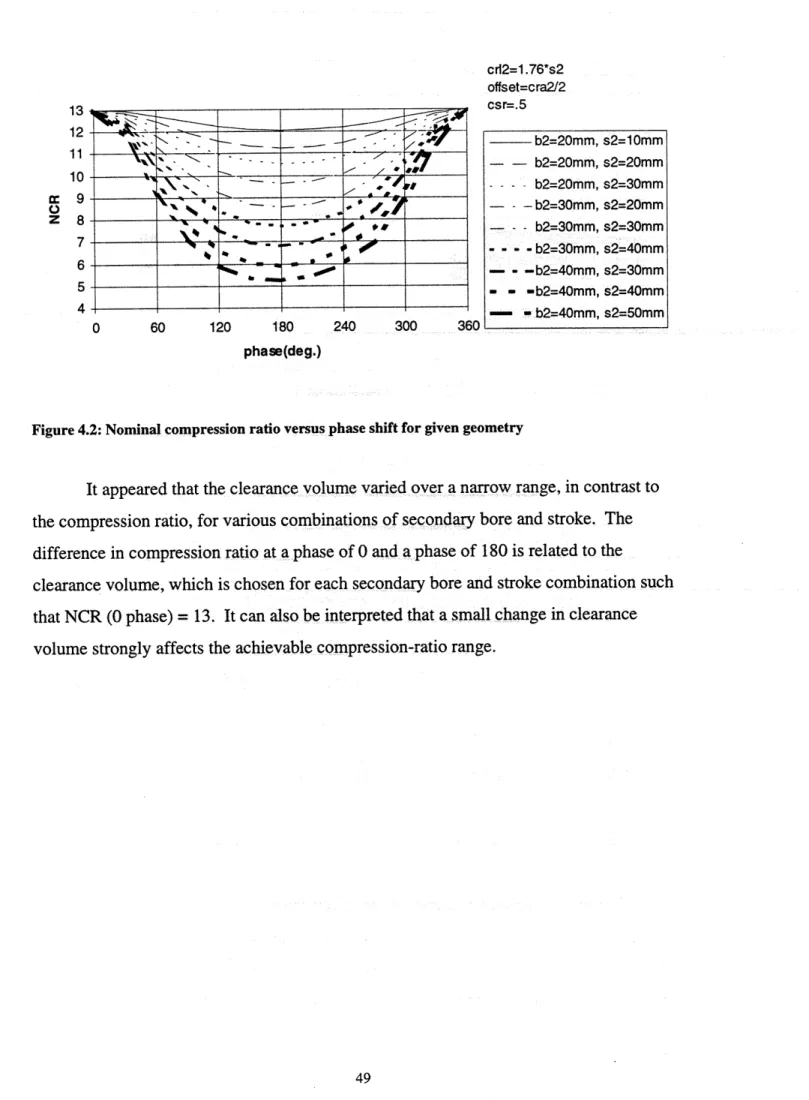
Figure 4.2 illustrates how the Alvar nominal compression ratio varies with phase shift, given these geometric parameters.
0 60 120 180 phase(deg.)
240 300 360
Figure 4.2: Nominal compression ratio versus phase shift for given geometry
It appeared that the clearance volume varied over a narrow range, in contrast to the compression ratio, for various combinations of secondary bore and stroke. The difference in compression ratio at a phase of 0 and a phase of 180 is related to the clearance volume, which is chosen for each secondary bore and stroke combination such that NCR (0 phase) = 13. It can also be interpreted that a small change in clearance volume strongly affects the achievable compression-ratio range.
crI2=1.76*s2 offset=cra2/2 csr=.5 - b2=20mm, s2=lO0mm - - b2=20mm, s2=20mm ---- b2=20mm, s2=30mm - - -b2=30mm, s2=20mm - -- b2=30mm, s2=30mm - - -- b2=3Omm, s2=4Omm - - -b2=4Omm, s2=30mm - - -b2=40mm, s2=40mm •- - b2=40mm, s2=50mm
The correlation is shown below. 8 7 6 5 4 3 2 1 0 4 43 43.5
Figure 4.3: Compression ratio range versus clearance volume
Table 4.3 lists the additional bore and stroke combinations that have been added to the above chart in an effort to confirm the clearance volume variation.
Table 4.3 Additional Secondary Bore and Stroke Combinations
stroke2 mmn 35.00 40.00 45.00 50.00 conrl2 mm 61.60 70.40 79.20 88.00 offset2 mm 8.75 10.00 11.25 12.50 clearance vol. cc 41.13 41.57 42.19 43.03
These studies provide a general depiction of the available geometry that would meet the compression ratio requirement. To set the constraint that the compression ratio range is (13 -7), it was found that each secondary bore between 20 and 40 mm could be matched with a secondary stroke that met this requirement. As secondary bore is
42 42.5 clearance vol.(cc) 0.5 41.5 bore2 mm 20.00 25.00 30.00 35.00 crl2=1.76*s2 offset=cra2/2 csr=.5 I I I I i r r
increased, the secondary stroke must be decreased and the relation is non-linear. These added combinations contributed to the following correlation between the nominal compression ratio difference and the cylinder head clearance volume. See Figure 4.3.
Ancr = 0.2(clv)3 - 24.1 (clv)2 + 1046.2(clv) - 15150.0
The following studies narrow the scope of the combinations that meet the compression ratios within +/- 0.02. It now becomes apparent that each of these
combinations require a clearance volume of approximately 42.38 cc. The variance from this clearance volume is small, (+/- 0.01). It was found that each secondary stroke between the range of 21 and 40 mm could be matched with a corresponding secondary bore that would achieve the first constraint of spanning the nominal compression ratio range of 7 to 13, if the following secondary geometrical parameters were held constant.
connecting rod length = 1.76*secondary stroke secondary offset = 1/2 secondary crank radius
clearance volume = 42.38 cc piston speed ratio = 1/2
The limiting factor of this range was the secondary stroke that would not reasonably fit within the cylinder head. This became the case at a secondary bore under
21 mm.
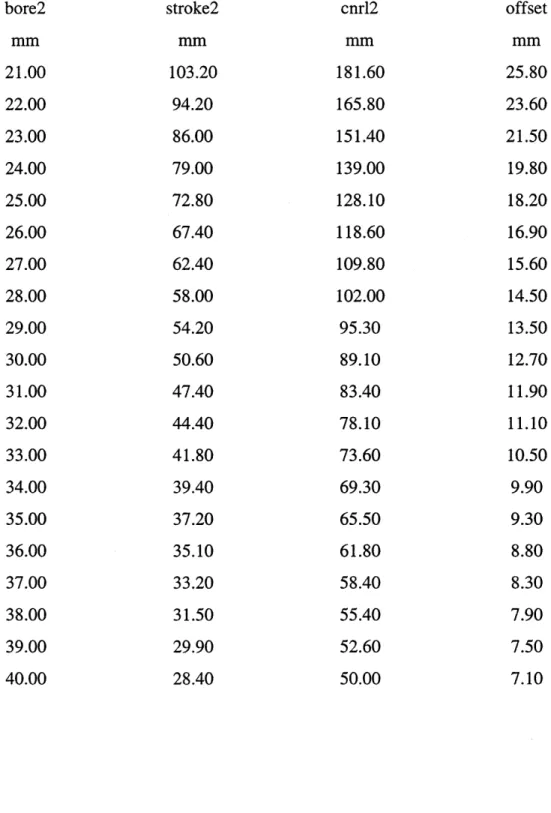
Table 4.4 below lists the combinations that were found to work. The stroke was iteratively matched to produce the desired compression ratio range of CR = 13 at phase = 0 and CR = 7 at phase = 180.
Table 4.4 Combinations that meet the Compression-Ratio Constraints bore2 mm 21.00 22.00 23.00 24.00 25.00 26.00 27.00 28.00 29.00 30.00 31.00 32.00 33.00 34.00 35.00 36.00 37.00 38.00 39.00 40.00 stroke2 mm 103.20 94.20 86.00 79.00 72.80 67.40 62.40 58.00 54.20 50.60 47.40 44.40 41.80 39.40 37.20 35.10 33.20 31.50 29.90 28.40 cnrl2 mm 181.60 165.80 151.40 139.00 128.10 118.60 109.80 102.00 95.30 89.10 83.40 78.10 73.60 69.30 65.50 61.80 58.40 55.40 52.60 50.00 offset mm 25.80 23.60 21.50 19.80 18.20 16.90 15.60 14.50 13.50 12.70 11.90 11.10 10.50 9.90 9.30 8.80 8.30 7.90 7.50 7.10
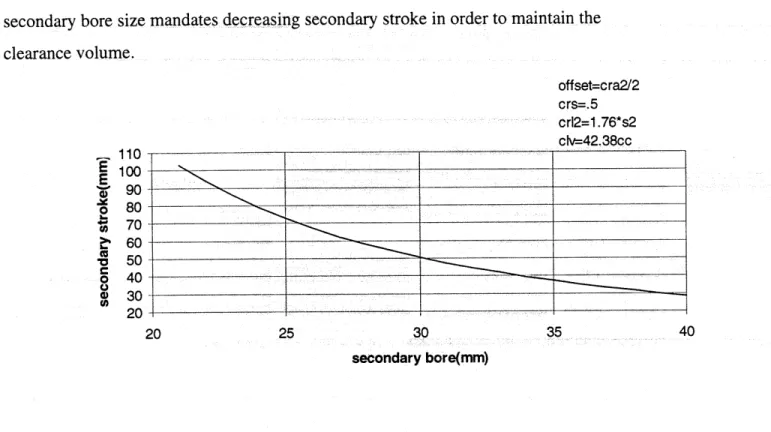
Next, Figure 4.4 relates the secondary stroke and secondary bore combinations that meet the CR constraint. This figure also illustrates the tradeoff as increasing secondary bore size mandates decreasing secondary stroke in order to maintain the clearance volume. 110 100 90 80 70 60 50 40 30 20 off set=cra2/2 crs=.5 crl2=1.76*s2 clv=42.38cc 25 30 35 secondary bore(mm)
Figure 4.4: Secondary stroke versus secondary bore combinations meeting compression ratio range constraint
While this relation may be intuitive, it is a direct result of the following relationship between the cylinder bore and stroke at a given clearance volume (vc), cylinder volume (v), connecting rod length (conrl), and distance between crank shaft axis
and piston pin axis (s).
8(v-vc)/ItB2 -2(conrl) + 2s = L,
In order to illustrate that the current selected geometries meet the CR constraint, the nominal compression ratio is plotted against the phase for the following derived combination.
bore2 = 36.00 mm stroke2 = 35.10 mm
connecting rod length2 = 61.80 mm clearance volume = 42.38 cc
offset2 = 8.80 mm
It's worth noting that any other combination of secondary bore and stroke given in Table 4.4 will sweep the same relation between the nominal compression ratio and the phase. A variance from the noted clearance volume, however, will alter the relation and create a combination that does not fall in line with the combinations shown in the earlier figure. This relation between nominal compression ratio, phase and piston position at 15 degrees ATC is shown below in Figure 4.5. Note that the introduction of a secondary offset is responsible for the asymmetry, and therefore causes the minimum nominal compression ratio to occur at a phase slightly under 180 degrees.
4U 35 E E o 0 25 onor 20 . S- position 15 0 10 5 m 0 0 60 120 180 240 300 360 phase(deg.)
Figure 4.5: Secondary piston position at 15 degrees ATC and nominal compression ratio versus phase shift for b2 = 36.00 mm, s2 = 35.10 mm, cr12 = 61.78 mm and clearance volume = 42.38 cc
I1, 12 11 10 z 9 8 7 6