HAL Id: hal-01053691
https://hal-univ-tln.archives-ouvertes.fr/hal-01053691
Submitted on 1 Aug 2014HAL is a multi-disciplinary open access archive for the deposit and dissemination of sci-entific research documents, whether they are pub-lished or not. The documents may come from teaching and research institutions in France or abroad, or from public or private research centers.
L’archive ouverte pluridisciplinaire HAL, est destinée au dépôt et à la diffusion de documents scientifiques de niveau recherche, publiés ou non, émanant des établissements d’enseignement et de recherche français ou étrangers, des laboratoires publics ou privés.
Monoclinic superstructure in the orthorhombic
Ce10W22O81 from transmission electron microscopy
L. Patout, D. Jacob, Madjid Arab, Carlson Pereira de Souza, Christine Leroux
To cite this version:
L. Patout, D. Jacob, Madjid Arab, Carlson Pereira de Souza, Christine Leroux. Monoclinic superstruc-ture in the orthorhombic Ce10W22O81 from transmission electron microscopy. Acta crystallographica Section B: Structural crystallography and crystal chemistry, International Union of Crystallography, 2014, 70, pp.268. �10.1107/S2052520613034252�. �hal-01053691�
Monoclinic superstructure in the orthorhombic Ce
10W
22O
81from transmission electron microscopy
Loïc Patout,
a* Damien Jacob,
bMadjid Arab,
aCarlson Pereira De Souza,
cand
Christine Leroux
aaUniversité de Toulon, CNRS, IM2NP, UMR 7334, BP 20132, F- 83957 La Garde
Cedex, France
bUnité Matériaux Et Transformations, Université Lille 1, CNRS UMR 8207, 59655
Villeneuve d'Ascq, France
cDEQ/PPGEQ-LMNRC, Universidade do Rio Grande de Norte, Natal, Brazil
Correspondence e-mail: [email protected]
Synopsis - A monoclinic superstructure occurring in a Ce10W22O81 compound was identified
by transmission electron microscopy. The partial oxidation of Ce3+ along with interstitial
oxygen ions could explain this superstructure.
Abstract - A complex rare earth tungstate structure, present in a two-phased powder, was solved by electron diffraction, precession and high resolution electron microscopy. The orthorhombic space group Pbnm and the atomic positions deduced from X-rays diffraction experiments were confirmed for Ce10W22O81. A C2/c monoclinic superstructure, with cell
parameters a = 7.8 Å, b = 36.1 Å, c = 22.2 Å and β = 100.2°, was evidenced and attributed to a partial oxidation of Ce3+ leading to interstitial oxygen ions.
Keywords: Precession electron diffraction, high-resolution electron microscopy, superstructure, image processing, simulation
1. Introduction
Rare earth (RE) tungstates are mostly based on the system RE2O3-WO3. Studies about RE
= Ce, La, Nd, Sm, and Pr [1,2] evidenced stable compounds with molar ratios 3/1, 1/1, 1/2 and 1/3. The latter correspond to the RE2(WO3)4 compounds, which crystallize in a
monoclinic structure for light RE and in an orthorhombic structure for heavy RE [3]. Abundant literature can be found about these compounds that display negative thermal expansion [4]. Other compositions can be found, depending on the RE cation nature. For example, a compound with molar ratio 2/1 exists with Nd but not with Pr [5]. Compounds with ratios lower than 1/3 were found for RE = La, Pr, Nd and Ce. A first identification of such low RE content tungstates was done in the Ce2O3-WO3 system [2], and led to a molar
ratio of 2/9, corresponding to the Ce10W22O81 phase. For RE2O3 based compounds the RE
cation is in a nominal 3+ valence state. Since Ce2O3 easily oxidizes in CeOx or CeO2, it could
be theoretically possible to synthesize a cerium tungstate with Ce in a 4+ valence state, or at least, a compound with a mixture of Ce4+ and Ce3+. In that sense, cerium tungstates should be
considered as part of the CeO2-Ce2O3-WO3 system. Starting from Ce2O3 and WO3 oxides, the
compounds are synthesized by co-fusion, or conventional solid state chemistry [6]. CeO2 and
WO3 oxides, mixed and annealed under vacuum, thus under reducing atmosphere, led to
Ce10W22O81 [7]. Up to now, no attempt was done to obtain rare earth tungstates at a
submicronic or nanometer scale, excepted the work of Furukawa et al [8] about amorphous cerium tungstates powders with grain sizes around 15 nm. On the other hand, tungsten alloys are already available at a nanometer scale [9-10].
In a previous work, Ce2(WO4)3 was successfully synthesized for the first time by the
EDTA - citrate method [11], with grain sizes around 100 nm. In an attempt to synthesize a new cerium tungstate phase with a molar ratio 1/4, a two-phased powder was obtained, namely a mixture of Ce2(WO4)3 and a cerium tungstate phase presenting similarities with
RE10W22O81. Previous studies showed the last one was orthorhombic, with cell parameters a =
3.88 Å, b = 35.9 Å and c = 21.9 Å, although authors disagreed about the space group. Pbcn (n°60) [1], Pbcm (n°57) [6] and Pbnm (n°62) [7] were proposed for Nd10W22O81 or
Ce10W22O81. These results were mainly obtained by Rietveld refinement of X-rays diffraction
patterns on small monocrystals. Electron diffraction is an alternative technique in case of nano-powders and poly-phased materials, that provides diffraction information at a very local scale [12].
In this work, we characterized the structure of the cerium tungstate phase Ce10W22O81 by
combining energy dispersive spectroscopy (EDS), conventional electron diffraction (ED), precession electron diffraction (PED), high resolution transmission electron microscopy (HREM), images processing and X-rays diffraction (XRD).
2. Experimental procedure 2.1. Sample Preparation
The cerium tungstate was synthesized using the complexing method combining ethylenediaminetetracetic acid (EDTA) and citrate ions as described in a previous work [11]. Cerium (III) nitrate was dissolved in deionized water. The solution was added to a previously prepared solution of 1 g of EDTA and 10 ml of ammonium hydroxide (NH4OH) (27%).
Tungsten trioxide WO3 powder was then added to the solution. After 15 min of stirring at
40°C, citric acid was added with a molar ratio of 1:1 with respect to the metal element; the pH of the solution was adjusted to 10 using NH4OH at a temperature of 80°C. After 4 hours, a
gel-like precipitate was formed. The gel was heat-treated in an oven for 3 h at 230°C in order to eliminate the excess of water, ammonium and organic parts. The precursor powder was annealed several hours at 1100°C to crystallize the desired phase.
The electron-microscopy specimens were prepared by crushing a low amount of the powder in an agate mortar and dispersing it in ethanol. The suspension was then dropped on a holey carbon film supported by a copper grid.
2.2. TEM
PED patterns were acquired with a LaB6 FEI CM30 TEM operated at 300 kV and equipped with a Nanomegas Spinning Star precession device. The precession semi-angle was taken between 1,5 and 2 degrees in order to significantly increase the number of observed reflections. HREM images, ED patterns and EDS analyses were obtained with a LaB6 FEI Tecnai TEM operated at 200 kV. The supertwin objective lens has a 0.25 nm point-to-point resolution. Crystallographic image processing (CIP) was applied to HREM images with the software CRISP [13]. Theoretical HREM images and ED patterns were simulated with JEMS [14]. The aberration coefficients of the supertwin lens are Cs = 1,2 mm and Cc = 2 mm. The
other imaging parameters used for simulations were an energy spread of ∆E=1,6 eV, a half-convergence angle of 0,35 mrad, and a defocus spread of 16 nm. Several thicknesses (from t = 1 to 40 nm) and defocus values (from ∆f = -120 to 2 nm in increments of 5 nm) were calculated using the multislice method. FOLZ reflections in ED pattern simulations have been taken into account by using a large deviation parameter ∆s.
2.3. X-rays diffraction
XRD data for structure identification were collected on a PANalytical Empyrean diffractometer working in a θ-2θ rotating mode, with a CuKα radiation source operating at 45 kV and 35 mA. The diffraction data were collected in the 5–80° 2θ range with a continuous scan and processed using the High Score software package.
3. Results
3.1. Space group identification by ED, PED and XRD
The EDS analyses over many grains of the powder only gave two different compositions, with atomic ratios of Ce/W ~ 2/3 and ~ 1/2 respectively. The first one corresponds to the stoichiometry of the well known Ce2(WO4)3 phase while the only phase reported in literature
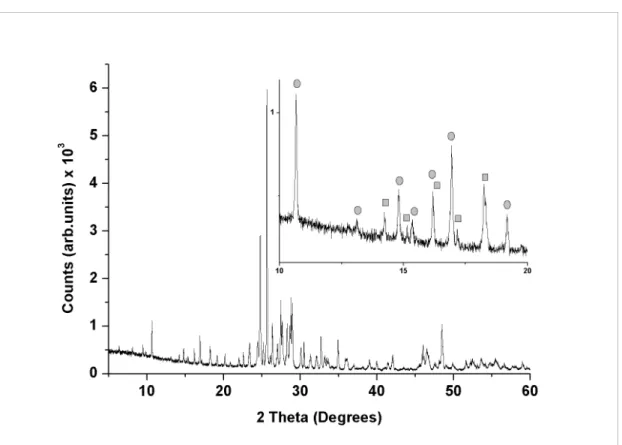
with the second ratio is Ce10W22O81. Fig.1 reports the XRD diagram of the powder. Phase
identification showed that the diffraction peaks could be indexed using both the Ce10W22O81
96-200-2722) structures, with a score matching for both phases about 50%. By comparing the relative intensities of the peaks, the Ce10W22O81 phase appears to be the major phase. The obtained
pattern, with two identified phases, is very similar to the one reported by R. S. Barker et al. [7]. Careful comparison nevertheless reveals intensity differences, especially at low angles (less than 20°), for peaks attributed to Ce10W22O81 (see insert in Fig.1). The additional peaks,
for example those at 2θ = 14.25° and 18.25°, are attributed to the monoclinic Ce2(WO4)3
phase. From High Score software package, a semi-quantitative analysis led to the mass fractions of the identified phases using the scale factor and the reference intensity ratio values from the database. We obtained 70% of the orthorhombic phase and 30 % of the monoclinic phase.
ED patterns were collected on grains of the Ce10W22O81 phase for various directions and
the highest symmetry zone axes are presented in Fig.2. Each of the patterns shows 2 orthogonal mirrors compatible with an orthorhombic crystal system. The intense spots could be indexed using the cell parameters of the orthorhombic structure previously found in literature for Ce10W22O81 : a = 3.88 Å, b = 35.9 Å and c = 22,2 Å. The reflection conditions for
the 3 published space groups, namely Pbnm, Pbcn and Pbcm, are listed in Table 1. For these space groups, 0kl reflections occur when k even, thus the [100] diffraction pattern (Fig.2b,e) does not allow to discriminate the three possible space groups. The reflection condition h00: h even, exists for Pbnm and Pbcn but not for Pbcm, thus the absence of h00: h odd in the experimental ED pattern [001] (Fig.2c,f) rules Pbcm out. The [010] ED pattern (Fig.2a,d) have h0l rows of spots that satisfy h+l even and this is characteristic of Pbnm, as Pbcn and Pbcm would have h0l rows with l even. In the experimental pattern taken along the [001] zone axis (Fig.2c,f), all the hk0 reflections appear although those with h+k odd are much weaker than those with h+k even. These weak hk0 reflections can be attributed to the orthorhombic Pbnm or to the monoclinic superstructure (see 3.3).
Apart from intense spots, rows of weak spots can be observed in [010], leading to a doubling of the cell parameter a. In PED patterns, the reflection intensities are integrated along the deviation from the exact Bragg orientation and recorded intensities are much less dynamical than using conventional electron diffraction [15, 16]. PED patterns were acquired along [010] (Fig.3a) and [uv0] zone axes (Fig.3b,c). ED patterns were calculated with the JEMS software, using the known Ce10W22O81 structure with the space group Pbnm [7]
(Fig.3d,e,f). Simulated patterns show great similarities with the experimental ones. Weak reflections were also observed in experimental PED patterns that are not reproduced on simulated patterns. Contrary to the intense spots, they appear to be linked together by an inversion centre only (see arrow Fig.3a) and are related to a superstructure as will be discussed in the last part of the paper.
3.2. Space group and atoms coordinates determination from HREM
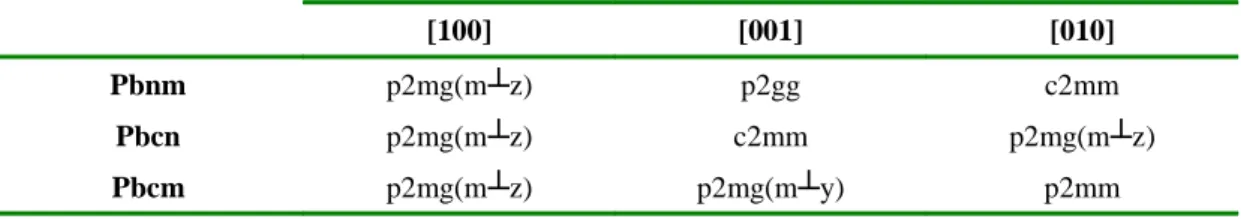
Space group determination can also be done using HREM images taken along low indices zone axes. Table 3 shows the planar symmetry projections of the space groups Pbnm, Pbcn and Pbcm. For these space groups, the [100] projection will show the same planar symmetry p2mg(m┴z), thus will not allow to discriminate between them. The [010] projection exhibits a centred symmetry for Pbnm, but not for Pbcn neither for Pbcm. Along the [001] orientation, a centred pattern will only be seen for the Pbcn space group.
Using the software CRISP, for each symmetry projection, the values of averaged phase errors (Ψres residual phase) of symmetry-related reflections are calculated. Table 2 shows the highest symmetry projections with the lowest Ψres obtained from HREM images taken along [100], [010] and [001]. The results are in agreement with the 3 possible orthorhombic space groups (see Table 3). A centred projection can be ruled out for [100], but for [010] and [001], p2mm, p2mg, p2gg and c2mm are possible symmetries. The density maps obtained from HREM images by imposing the projection symmetries of the published orthorhombic space groups for Ce10W22O81 are in accordance with the experimental images.
Apart from symmetry information, reduced atomic coordinates were extracted from HREM images. Fig.4 shows experimental HREM images taken along [100] (Fig.4a), [001] (Fig.4d) and [110] (Fig.4g), and processed ones after imposing the projection symmetries of Pbnm (Fig.4b,e,h). Images (Fig.4c,f,i), simulated with JEMS using the known structure of Ce10W22O81 [7] are in good agreement with experimental and processed image. Atomic
coordinates could be deduced from the HREM image taken along [100]. The black spots were attributed to heavy atoms. Atomic coordinates were refined using the software CRISP and found to be similar to those obtained from X-rays diffraction [6] (see Table 4). The non-equivalent atomic positions of Ce atoms, WO5, WO6 and WO7 groups are shown in
Fig.4a,b,c. The HREM images taken along [001] and [110] could not be used to solve the x atomic coordinates due to overlapping. However, the corresponding simulated HREM maps from the known structure [7] are in good agreement with the experimental and processed images.
3.3. Identification of a superstructure cell
The [010] PED pattern in Fig.3a shows supplementary rows of weak reflections, parallel to c*, related by an inversion centre and leading to a doubling of the a cell parameter. Fast Fourier Transform (FFT) performed on various regions of HREM images taken along the [010] orientation also exhibited these weak spots (Fig.5). FFT of images taken along the [110] direction also reveals supplementary rows of weak spots but in this case, the inversion centre is not as clearly evidenced as on [010] patterns. No domains boundaries or stacking faults
were observed in the direct images. Dynamical simulated ED patterns in orientations around the [010] zone axis, using the known structure of Ce10W22O81 [7], do not show reflections
located between the rows 00l and h0l, ruling out the possibility of an overlapping of different patterns. These extra reflections can be indexed in a monoclinic superstructure C2/c with cell parameters close to those of the orthorhombic structure, except for a which is two times larger: am = 7.8 Å, bm = 36.1 Å, cm = 22.2 Å and β = 100.2°. The experimental diffraction
patterns are then made of the superposition of patterns coming from both the orthorhombic structure and the monoclinic superstructure. The crystallographic relationship between both phases are:
The experimental ED patterns in Fig.2b,e correspond to the superposition of the [100]o
orthorhombic zone axis and the [100]m one in the monoclinic superstructure. The HREM
images taken along this orientation may have a symmetry projection p2gg (see Table 2), in good agreement with the C2/c space group. The experimental ED patterns identified as [010]o
in Fig.2.a,d and [001]o in Fig.2c,f can be indexed respectively as [010]m (Fig.6) and [102]m
(Fig.7) in the monoclinic structure. The weak supplementary rows pointed by red arrows in Fig.2.d can only be indexed in the monoclinic structure. The overlapping of FOLZ and HOLZ close to the center of the pattern in Fig.6 is related to the very small reciprocal vector b* = 0,27 nm-1 of both structures. For the orientation [001]
o // [102]m (fig. 7), the monoclinic
structure alone does not account for all the reflections observed on the experimental pattern and the orthorhombic structure still has to be considered. This indicates that the monoclinic superstructure is not homogeneously found in the sample. The monoclinic phase is then not strictly speaking a superstructure but should be more considered as a polymorph of the orthorhombic structure [17]. The simulated [102]m whole pattern (Fig.8) exhibits a shift
between rows of reflections coming from the ZOLZ and the FOLZ. The shifted rows of the FOLZ are clearly observed on the experimental pattern taken along this direction (Fig.2c). .
Supplementary spots were already observed in rare earth tungstates. Weak superstructure reflections occurred in ED patterns of Nd10W22O81, leading to a doubling of the short cell
parameter [6]. They were attributed to slight changes in the oxygen positions. In the case of Na7Nb15W13O80, that has a similar structure to Nd10W22O81, weak extra reflections on ED
patterns, doubling the short cell 3.9 Å parameter were also mentioned [18]. These reflections were attributed to a short-range order among the Na cations. In this study, the Ce10W22O81
powder was synthesized under air, starting from a precursor with Ce3+, that is easily oxidised
−
=
o o o m m mc
b
a
c
b
a
1
0
1
0
1
0
0
0
2
into Ce4+. Partial oxidation of cerium along with interstitial oxygen were already observed in
another cerium compound CeTaO4 [19]. Thus, the monoclinic superstructure in Ce10W22O81
could be due to a partial oxidation of Ce3+ into Ce4+ with interstitial oxygen ions. This
oxidation phenomenon, limited to the grain surface, explains the contribution of both structures to the experimental ED patterns.
4. Conclusion
The powder synthesized by the complexing method of EDTA - citrate is mainly composed of the Ce10W22O81 phase and contains also the Ce2(WO3)4 phase. The high resolution
electron microscopy study combined with electron diffraction confirms the Pbnm space group and the heavy atoms coordinates previously found for Ce10W22O81 [7]. A weak monoclinic
superstructure of space group C2/c with cell parameters a = 7.8 Å, b = 36.1 Å, c = 22.2 Å and β = 100.2° was evidenced in the orthorhombic Ce10W22O81. A partial oxidation at the surface
Figure 1 XRD diagram of the two-phased powder. The inset shows low angles diffraction peaks of Ce10W22O81 (dots) and Ce2(WO4)3 (squares).
Figure 2 ED patterns of high symmetry indexed in the orthorhombic structure along [010](a,d), [100](b,e), and [001](c,f) zone axes; (a-c) : whole pattern and (d-f) : zoom on the central part of the pattern. The red arrows on (c) and (d) point to rows of weak superstructure reflections.
Figure 3 Experimental PED patterns along [010] (a), [110] (b), [410] (c) and the respective simulated patterns (d,e,f) using the known Ce10W22O81 structure [7]. The green and blue arrows on
Figure 4 HREM images of Ce10W22O81 along [100](a-c), [001](d-f) and [110](g-i) zones axes.
Experimental (a,d,g), processed (b,e,h) and simulated images at ∆f=-60 nm, t=1 nm (c), t=9 nm (f), and t=6 nm (i). The columns of Ce atoms (green), WO5 (yellow), WO6 (violet) and WO7 (blue) groups are
superimposed to the HREM image in the [100] projection.
Figure 5 Experimental HREM images of Ce10W22O81along the [010] (a) and [110] (c) zone axes,
with the corresponding FFT (b,d). The red arrows on FFT patterns indicate the rows of weak superstructure reflections.
Figure 6 Experimental (a) and simulated (b) ED pattern along [010]m indexed in the monoclinic
Figure 7 Simulated (a) and experimental (b) ED patterns along the [102]m zone axis of the
Figure 8 Simulated ED pattern along the [102]m zone axis of the monoclinic superstructure showing
reflections of the ZOLZ (red spots) and FOLZ (green spots). The FOLZ reflections are observed in the experimental ED pattern along the [001]o zone axis (Fig.2c).
Table 1 Reflection conditions of the 3 space groups Pbnm, Pbcn and Pbcm. Pbnm Pbcn Pbcm h00 : h = 2n h00 : h = 2n 0k0 : k = 2n 0k0 : k = 2n 0k0 : k = 2n 00l : l = 2n 00l : l = 2n 00l : l = 2n hk0 : h + k = 2n h0l : h + l = 2n h0l : l = 2n h0l : l = 2n 0kl : k = 2n 0kl : k = 2n 0kl : k = 2n
Table 2 Ψres values obtained for each symmetry projection and orientation.
[100] [001] [010]
Symm. Ψres. Symm. Ψres. Symm. Ψres.
- - p2mm 11.5 p2mm 22.7
p2mg(m┴z) 18.9 p2mg(m┴y) 11.4 p2mg(m┴z) 21.8
p2gg 19 p2gg 11.4 p2gg 22.4
c2mm 19.4 c2mm 11.1 c2mm 22.9
Table 3 Planar symmetries for three orthorhombic space groups and main orientations.
[100] [001] [010]
Pbnm p2mg(m┴z) p2gg c2mm
Pbcn p2mg(m┴z) c2mm p2mg(m┴z)
Pbcm p2mg(m┴z) p2mg(m┴y) p2mm
Table 4 Atomic coordinates in the [100] projection refined from the processed HREM image, compared to atomic coordinates obtained by X-rays diffraction [6].
HREM X-rays [6] at. y z y z Ce1 0.52 0.385 0.518574 0.383 Ce2 0.171 0.25 0.174596 0.25 Ce3 0.329 0.478 0.329476 0.478941 W1 0.348 0.333 0.352772 0.335884 W2 0.557 0.25 0.557183 0.25 W3 0.279 0.25 0.276904 0.25 W4 0.257 0.395 0.252483 0.395114 W5 0.363 0.616 0.365272 0.616924 W6 0.447 0.474 0.446074 0.473846 W7 0.438 0.25 0.442194 0.25
Acknowledgements - This work was developped in the general framework of a project CAPES & ARCUS (Brazil) and COFECUB (France). We gratefully acknowledge the Provence-Alpes-Côte d'Azur Regional Council, the Nord-Pas-de-Calais Regional Council and the European Regional Development Fund (ERDF).
References
[1] Yoshimura, M., Morikawa, H. & Miyake, M. (1975). Mater. Res. Bull., 10, 1221-1224.
[2] Yoshimura, M., Sibieude, F., Rouanet, A., & Foex, M. (1976). J. Solid State Chem., 16, 219-232. [3] Sumithra, S., & Umarji, A.M. (2004). Solid State Sciences, 6, 1313–1319.
[4] Peng, J., Wu, M., Wang, H., Hao,Y., Hu, Z., Yu, Z., Chen, D., Kiyanagi, R., Fieramosca, J., Short, S., & Jorgensen, J. (2008). Journal of Alloys and Compounds, 453, 49-54.
[5] Shimazaki, T., Yamazaki, T., Terayama, K., Ishiguro, T., & Yoshimura, M. (1999). Journal of Alloys and Compounds, 112-118.
[6] Grenthe, C., & Sundberg, M. (2002). Journal of Solid State Chemistry, 167, 412 - 419. [7] Barker, R.S., & Evans, I.R. (2008). Acta Crystallographica, B64, 708-712.
[8] Furukawa, S., Masui T., & Imanaka, N. (2006). Journal of alloys and compounds, 418, 255-258. [9] Naik, S.J., Subramanian, U., Tangsali, R.B., & Salker, A.V. (2011). Journal of physics D-Applied physics, 44, 115404.
[10] Koseva, I., Nikolov, V., Yordanova, A., Tzvetkov, P. , & Kovacheva, D. (2011). Journal of Alloys and Compounds, 509, 7022-7026.
[11] Arab, M., Lopes-Moriyama, A.L., Renovato dos Santos, T., Pereira de Souza, C., Gavarri, J.R. & Leroux, Ch. (2013). Catalysis Today, 208, 35-41.
[12] Bougerol-Chaillout, C. (2001), Micron, 32, 473-479. [13] Hovmö11er, S. (1992). Ultramicroscopy, 41, 121-135. [14] Stadelmann, P.A. (1987). Ultramicroscopy, 21, 131-145.
[15] Vincent, R., & Midgley, P.A. (1994). Ultramicroscopy, 53, 271-282.
[16] Own, C.S., Subramanian, A., & Marks, L.D. (2004). Microsc. Microanal., 10, 96-104. [17] Montanari, E., Righi, L., Calestani, G., Migliori, A., Gilioli, E., & Bolzoni, F. (2005). Chem. Mater . , 17 , 1765 - 1773 .
[18] Marinder, B.O., & Sundberg, M. (1984). Acta Cryst., C40, 1303 - 1306.
[19] Thompson, J.G., David Rae, A., Bliznyuk, N., & Withers, R.L. (1999). Journal of Solid State Chemistry, 144, 240 - 246.
![Figure 3 Experimental PED patterns along [010] (a), [110] (b), [410] (c) and the respective simulated patterns (d,e,f) using the known Ce 10 W 22 O 81 structure [7]](https://thumb-eu.123doks.com/thumbv2/123doknet/14636108.734869/10.892.136.760.175.589/figure-experimental-patterns-respective-simulated-patterns-using-structure.webp)
, [001](d-f) and [110](g-i) zones axes.](https://thumb-eu.123doks.com/thumbv2/123doknet/14636108.734869/11.892.139.760.142.515/figure-hrem-images-ce-w-o-zones-axes.webp)
![Figure 6 Experimental (a) and simulated (b) ED pattern along [010] m indexed in the monoclinic superstructure](https://thumb-eu.123doks.com/thumbv2/123doknet/14636108.734869/12.892.262.606.125.557/figure-experimental-simulated-ed-pattern-indexed-monoclinic-superstructure.webp)
![Figure 7 Simulated (a) and experimental (b) ED patterns along the [102] m zone axis of the monoclinic superstructure](https://thumb-eu.123doks.com/thumbv2/123doknet/14636108.734869/13.892.276.618.137.811/figure-simulated-experimental-patterns-zone-axis-monoclinic-superstructure.webp)
![Figure 8 Simulated ED pattern along the [102] m zone axis of the monoclinic superstructure showing reflections of the ZOLZ (red spots) and FOLZ (green spots)](https://thumb-eu.123doks.com/thumbv2/123doknet/14636108.734869/14.892.278.617.105.433/figure-simulated-pattern-monoclinic-superstructure-showing-reflections-zolz.webp)