HAL Id: hal-01764177
https://hal.inria.fr/hal-01764177
Submitted on 11 Apr 2018
HAL is a multi-disciplinary open access
archive for the deposit and dissemination of
sci-entific research documents, whether they are
pub-lished or not. The documents may come from
teaching and research institutions in France or
abroad, or from public or private research centers.
L’archive ouverte pluridisciplinaire HAL, est
destinée au dépôt et à la diffusion de documents
scientifiques de niveau recherche, publiés ou non,
émanant des établissements d’enseignement et de
recherche français ou étrangers, des laboratoires
publics ou privés.
Distributed under a Creative Commons Attribution| 4.0 International License
CAD Assembly Retrieval and Browsing
Matteo Rucco, Katia Lupinetti, Franca Giannini, Marina Monti,
Jean-Philippe Pernot
To cite this version:
Matteo Rucco, Katia Lupinetti, Franca Giannini, Marina Monti, Jean-Philippe Pernot. CAD
Assem-bly Retrieval and Browsing. 14th IFIP International Conference on Product Lifecycle Management
(PLM), Jul 2017, Seville, Spain. pp.499-508, �10.1007/978-3-319-72905-3_44�. �hal-01764177�
adfa, p. 1, 2011.
© Springer-Verlag Berlin Heidelberg 2011
CAD Assembly retrieval and browsing
M. Rucco1, K. Lupinetti1, 2, F. Giannini1, M. Monti1, J.-P. Pernot21IMATI- CNR Genova, Italy
[email protected], [email protected], [email protected], [email protected]
2LSIS - Arts et Métiers ParisTech, Aix-En-Provence [email protected]
Abstract. This paper presents a method for the retrieval and inspection of
simi-lar CAD assemblies in a database according to a user query. The method ex-ploits the information on components’ shape and relationships (e.g. contacts and regular patterns) automatically extracted from the STEP descriptions of CAD assemblies and stored in the so-called Enriched Assembly Model. It eval-uates the similarity among assemblies in terms of the components’ shapes and joints. A graphical interface highlighting the elements in the assembly similar to the query has been developed to facilitate the inspection of the obtained results.
Keywords: Assembly retrieval, shape matching, information visualization
1
Introduction
The large use of CAD (Computer Aided Design) and CAM (Computer Aided Manu-facturing) systems in industries has generated a number of 3D databases making available a large amount of 3D digital models. The reuse of these models, either sin-gle parts or assemblies, and the exploitation of the knowledge associated with them are becoming an important way to facilitate new designs. To track and organize data related to a product and its lifecycle, modern CAD systems are integrated into PDM (Product Data Management) and PLM (Product Lifecycle Management) systems. Among others, the associated data usually involve the technical specifications of the product, provisions for its manufacturing and assembling, types of materials used for its production, costs and versioning. These systems efficiently manage a search based on textual metadata, which cannot be sufficient to effectively retrieving the searched data. Actually, standard parts, text-based annotation and naming convention are com-pany- or operator- specific, thus difficult to generalize as search keys. To overcome these limitations, content-based algorithms for 3D model retrieval are being devel-oped based on shape characteristics. A wide literature is available and some
commer-cial systems provide shape-based model retrieval. [1-3] provide an overview of the 3D shape descriptors most used in the CAD domain. However, these descriptors focus solely on the shape of a single component, which is not adapted for more complex products obtained as assemblies. An effective assembly search cannot be limited to simple shape comparison among components, but requires also information that is not always explicitly encoded in the CAD models, e.g. the relationships and the joint constraints between assembly components.
In this paper, we present methods for the retrieval of globally and/or partially similar assembly models according to different user-specified search criteria [9] and for the inspection of the provided results. The proposed approach creates and exploits an assembly descriptor, called Enriched Assembly Model (EAM), organized in several layers that enable multi-level queries and described in section 4.1. The rest of the paper is organized as follows. Section 2 provides an overview of related works. Issues related to assembly retrieval are described in Section 3, while Section 4 presents the assembly descriptor and the comparison procedure. Section 5 reports some of the obtained results, focusing on the developed inspection capabilities. Section 6 con-cludes the paper discussing on current limits and future work.
2
Related works
Shape retrieval has been investigated far and wide in the recent years [1, 2, 3, 4]. However, most of the work present in literature deal with the shape of a single com-ponent and do not consider other relevant information of the assembly such as the relationships between the parts. One of the pioneer works dealing with assembly re-trieval was presented by Deshmukh, et al. [5]. They investigate the possible usage scenarios for assembly retrieval and proposed a flexible retrieval system exploiting the explicit assembly data stored in a commercial CAD system. Hu et al. [6] propose a tool to retrieve assemblies represented as vectors of watertight polygon meshes. Iden-tical parts are merged and a weight based on the number of occurrences is attached to each part in the vector. Relative positions of parts and constraints are ignored, thus the method is weak in local matching. Miura and Kanai [7] extend their assembly model by including structural information and other useful data, e.g. contact and interference stages and geometric constraints. However, it does not consider high-level infor-mation, such as kinematic pairs and some information must be made explicit by the user. A more complete system is proposed by Chen et al. [8]. It relays on the product structure and the relationships between the different parts of the assembly. The adopt-ed assembly descriptor considers different information levels including the topologi-cal structure, the relationships between the components of the assembly, as well as the geometric information. Thus, the provided search is very flexible accepting rough and incomplete queries. Anyhow, most of the work require user support for the insertion of the required information and weakly support the analysis and browsing of the ob-tained results, which for large assemblies can be very critical. To overcome these limitations, in this paper, we present an assembly descriptor (i.e. the Enriched Assem-bly Model), which can support user requests based on different search criteria not
restrained to the identification of assembly models with the same structure in terms of sub-assemblies, and tools for facilitating the inspection and browsing of the results of the retrieval process.
3
Assembly retrieval issues
Retrieving similar CAD assembly models can support various activities ranging from the re-use of the associated knowledge, such as production or assembly costs and operations, to part standardization and maintenance planning. For instance, know-ing that a specific subassembly, which includes parts havknow-ing a high consumption rate due to their part surrounding and usage, is present in various larger products may help in defining more appropriate maintenance actions and better planning of the ware-house stocks. Similarly, knowing that different products having problems share simi-lar configurations can help in detecting critical configurations. Considering these scenarios, it is clear that simply looking for products (i.e. assemblies) that are com-pletely similar to a given one is important but limited. It is therefore necessary to have the possibility to detect if an assembly is contained into another as well as local simi-larities among assemblies, i.e. assemblies that contain similar sub-assemblies. These relations can be described using the set theory. Being ≅ the symbol indicating the similarity according to given criteria, given two assemblies A and B, we say that:
A is globally similar to B iff for each component ai ∈ A, ∃ bh ∈ B s.t. ai ≅ bh, for
each relation (ai, aj) ∈ A, ∃ (bh, bk) ∈ B s.t. (ai, aj) ≅ (bh, bk) where ai ≅ bh andaj ≅ bk
A is partially similar to B iff it exists A’ ⊆ A s.t. for each component ai ∈ A’, ∃ bh
∈ B s.t. ai ≅ bh, for each relation (ai, aj) ∈ A, ∃ (bh, bk) ∈ B s.t. (ai, aj) ≅ (bh, bk) where ai
≅ bh andaj ≅ bk
A is locally similar to B iff it exists A’ ⊂ A and B’ ⊂ B s.t. for each component ai
∈ A’, ∃ bh ∈ B’ s.t. ai ≅ bh, for each relation (ai, aj) ∈ A, ∃ (bh, bk) ∈ B s.t. (ai, aj) ≅ (bh,
bk) where ai ≅ bh andaj ≅ bk
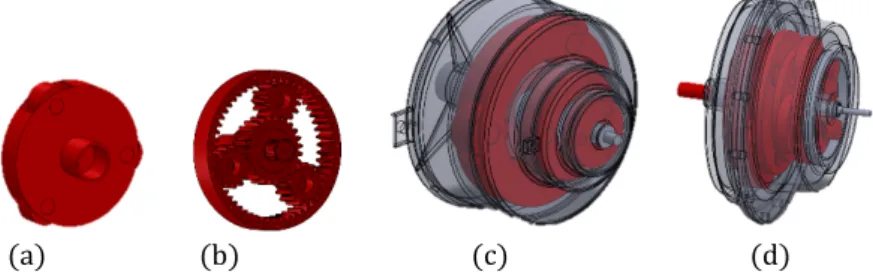
The different types of similarities are depicted in figure 1. According to the given definitions, the models in Fig. 1(a) and Fig. 1(b) are globally similar, while both of them are partially similar comparing with the models in Fig. 1(c) and Fig. 1(d). In the end, model in Fig. 1(c) and Fig. 1(d) are locally similar, since they share a similar component.
(a) (b) (c) (d) Fig. 1. Example of different type of similarities
Depending on the retrieval purpose, not only the criteria change but also the inter-est on the similarity among the parts or on their connections can have different priori-ty. It is therefore important to provide flexible retrieval tools that can be adapted to the specific need and thus able to consider the various elements characterizing the assembly despite on how the assembly was described by the user (e.g. structural or-ganization) or on the information available on the CAD model itself (e.g. explicit mating conditions).
In addition, it might be difficult to assess the effective similarity when various el-ements contribute to it. It is crucial to provide tools for gathering results according to the various criteria and for their inspection. This is very important in the case of large assemblies, where detecting the parts considered similar to a given assembly might be particularly difficult.
4
The proposed approach
Based on the above considerations, we propose a method for the comparison of as-sembly models exploiting various levels of information of the asas-sembly. Differently from most of the work presented in literature, our method can evaluate all the three types of similarity described above. It uses a multilayer information model, the so-called Enriched Assembly Model (see section 4.1), which stores the data describing the assembly according to three different layers, in turns specified at different level of details thus allowing a refinement of the similarity investigation. Depending on the type of requested similarity, an association graph is build putting in relation the ele-ments of the EAM of two CAD models to be compared. The similar subset of these two models are then corresponding to the maximal clique of the association graph (see section 4.2). To analyze the retrieved results, a visualization tool has been devel-oped; it highlights the correspondences of the parts and provides statistics on the matched elements (see section 4.3).
4.1 Enriched Assembly Model (EAM)
The EAM is an attributed graph, where nodes are the components and/or compos-ing sub-assemblies while arcs represent their adjacency relations. It uses four infor-mation layers: structure, interface, shape and statistics [9].
The structural layer encodes the hierarchical assembly structure as specified at the design stage. In this organization, the structure is represented as a tree where the root corresponds to the entire assembly model, the intermediate nodes are associated with the sub-assemblies and the leaves characterize the parts. Attributes to specify parts arrangement (regular patterns of repeated parts) are attached to the entire assembly and to its sub-assemblies [10]. The organization in sub-assemblies is not always pre-sent and may vary according to the designer’s objectives.
The interface layer specifies the relationships among the parts in the assembly. It is organized in two levels: contacts and joints. The first contains the faces involved in the contact between two parts and the degree of freedom between them. The joint
level describes the potentially multiple motions resulting from several contacts be-tween two parts [11].
The shape layer describes the shape of the part assembly by several dedicated de-scriptors. Using several shape descriptors helps answering different assembly retrieval scenarios, which can consider different shape characteristics and at different level of details. They include information like shape volume, bounding surface area, bounding box and spherical harmonics [12].
The statistics layer contains values that roughly characterize and discern assembly models. Statistics are associated as attributes to the various elements of the EAM. For the entire assembly and for each assembly, they include: the numbers of sub-assemblies, of principal parts, of fasteners, of patterns of a specific type, of a specific joint type. To each node corresponding to a component, the statistics considered are: percentage of a specific type of surface (i.e. planar, cylindrical, conical spherical, toroidal, free form), number of maximal faces of a specific type of surface. Finally, for each arc corresponding to a joint between parts, the stored statistics include the number of elements in contact for a specific contact type.
The E.A.M. is created using ad hoc developed modules [9, 10, 11], which analyze the content of the STEP (ISO 10303-203 and ISO 10303-214) representation of the assembly and extract the required information.
4.2 EAM comparison
Adopting this representation, if two models are similar, then their attribute graphs must have a common sub-graph. The similarity assessment between two EAMs can then be performed by matching their attribute graphs and finding their maximum common subgraph (MCS). The identification of the MCS is a well-known NP-hard problem and among the various techniques proposed for its solution [13] we chose the detection of the maximal clique of the association graph, since it allows identifying also locally similarities.
The association graph is a support graph that reflects the adopted high-level simi-larity criteria. Each node in the association graph corresponds to a pair of compatible nodes in the two attributed graphs according to the specified criteria. Associated arcs connect nodes if they have equivalent relations expressed as arcs connecting the cor-responding nodes in the attribute graphs.
A clique is a sub-graph in which for each couple of nodes a connecting arc ex-ists. For the clique detection we applied the Eppstein-Strash algorithm [14]. This al-gorithm represents an improved version of the alal-gorithm by Tomita [15], which is in turn based on the Bron-Kerbosch algorithm for the detection of all maximal cliques in graphs [16]. As far as we know, Eppstein-Strash algorithm is up to now the best algo-rithm for listing all maximal cliques in undirected graphs, even in dense graphs. The performances of the algorithm are in general guaranteed by the degeneracy ordering.
The algorithm of Eppstein-Strash improves Tomita’s algorithm by using the con-cept of degeneracy. The degeneracy of a graph G is the smallest number d such that every subgraph of G(V, E) contains a node of degree at most d. Moreover, every graph with degeneracy d has a degeneracy ordering: a linear ordering of the vertices
such that each node has at most d neighbors after it in the ordering. Eppstein-Strash algorithm first computes the degeneracy ordering; then for each node v in the order, starting from the first, the algorithm of Tomita is used to compute all cliques contain-ing v and v’s later neighbors. Other improvements depend on the use of adjacency lists for data representation. For more details we refer to [14].
Among all the maximal cliques present in the associated graph, we consider as in-teresting candidates of the similar sub-graphs only those having: 1) the majority of arcs corresponding to real joints between the corresponding components, 2) a number of nodes bigger than a specified value. In this way, priority is given to sub-graphs which contain a significant number of joined similar components, thus possibly corre-sponding to sub-assemblies. Then, for each selected clique, a measure vector is com-puted. The first element of the vector indicates the degree of the clique, while the others report the similarity of the various assembly characteristics taken into consid-eration for the similarity assessment. Depending on the search objectives the set of characteristics to consider may change. The default characteristics are the shape of the components and the type of joint between them. The examples and results discussed in the next section consider the default characteristic selection.
5
Result visualisation
The proposed retrieval system has been implemented in a multi-module prototype system. The creation of the EAM description is developed by using Microsoft Visual C# 2013 and exploiting the Application Programming Interface (API) of the commer-cial CAD system SolidWorks. The matching and the similarity assessment module is developed by using Java and is invoked during the retrieval as a jar file. In the end, to analyze the obtained results, a browser view has been implemented. It is obtained by multiple dynamic web pages that are based on HTML5, jQuery, Ajax and PHP. Moreover, Mysql is used as database system, while X3D library is used for the STEP model visualization.
The system has been tested on assembly models obtained from on-line repositories [17, 18, 19] and from university students’ tests.
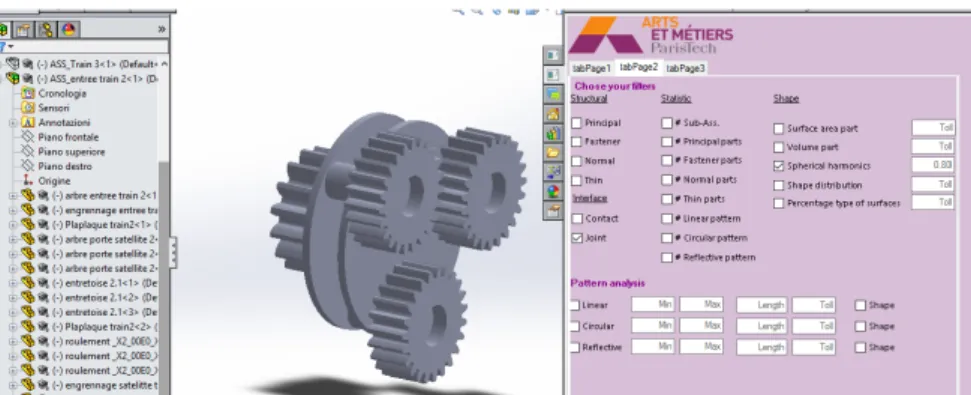
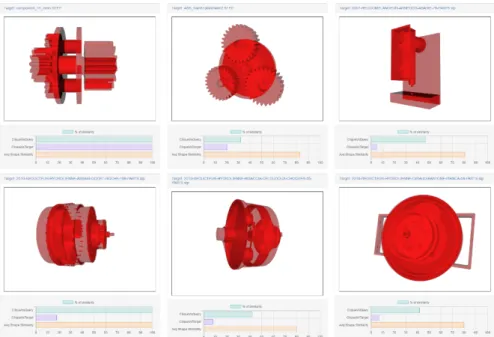
Figure 2 shows an example of the developed user interface, where the design can choose an assembly model as query and set the required criteria of similarity. In this example, it is required to retrieve models similar for shape and joint. Some results of this query are shown in Fig. 3. The first model in the picture (top-left) coincides with the query model. The retrieved models are gathered together in the other views of Fig. 3. Each retrieved and displayed assemblies has a clique that has been detected in the association graph and satisfies the required conditions. The assemblies are visualized in X3D view that allows rotating, zooming and selecting the various 3D components of the retrieved assembly. Components are visualized in the transparency mode to make possible to see also the internal ones. Under each model, three bars are shown to quickly get an idea of how similar to the query the retrieved assemblies are. The first two indicate the percentage of coverage (i.e. percentage of matched elements) with respect to both the query and target model. Thank to these bars, the user can see the type of similarity (i.e. global, partial or local). If the green is not complete, it means that just a subset of the query model is matched, thus the similarity is locally. The global similarity is shown by the purple bar, if this bar is not complete, then the simi-larity is partial. The last bar shows the average shape simisimi-larity among the compo-nents associated with the displayed clique. Simply looking at the reported model and checking the purple bar, the user can notice that (except the first model which repre-sents the query model) no models are globally similar to the query one according to the criteria he/she has specified. The first model in the second row is partially similar with the query one, since the query is completely included in it (see the green bar). Other models are locally similar with the query model, thus just a subset of the query model is included in them.
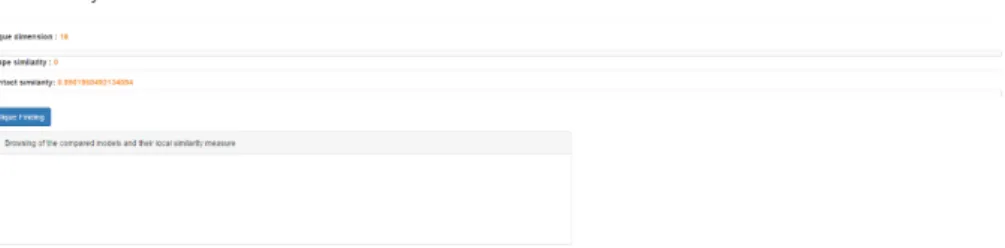
If the user wants to further analyze the levels of similarity of the chosen character-istics or to visualize all the subsets of matched parts, he/she can select one of the re-trieved assemblies and a new browser page is prompted. Once selected, a new page as in Fig. 4 is available, where the user can get the list of all the interesting clique, using the sliders at the top of window. With these sliders, the user can choose some thresh-olds that the proposed results have to satisfy. In particular, they refer to the dimension of the matched portion, the shape similarity measure and the joint similarity measure. After the setting of those parameters, the button “Clique finding” can be pressed to get the results displayed in a table as visible on the left of Fig. 5.
Fig. 4. Initial page for investigating the model similarity
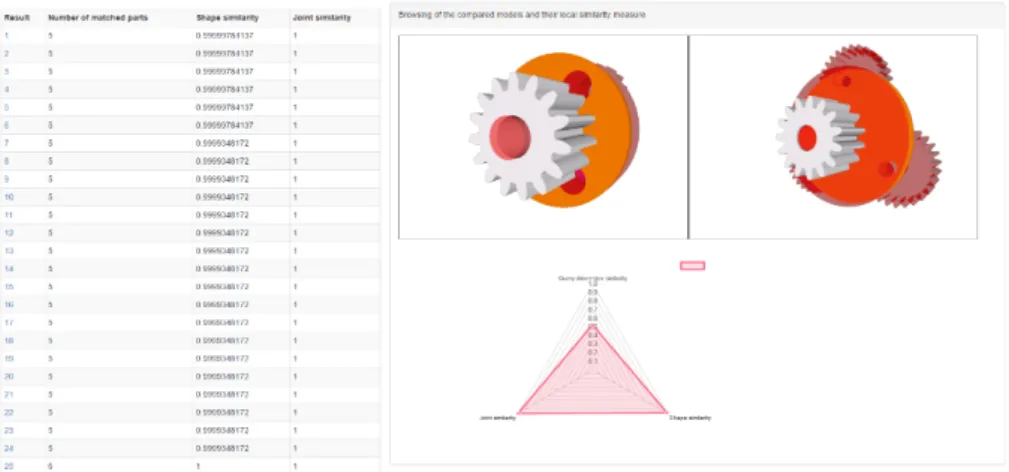
The rows of the table gather together all the matching portions that satisfy the re-quired criteria. In this example, four information are accessible for each matching portion: an identification number, the number of matched parts, the shape similarity and the joint similarity. Selecting one of them, the corresponding clique is visualized within the assembly. It highlights the component correspondence with the query mod-el using same colors for corresponding components in the two objects, as shown on the right part of Fig. 4. To easy the comparison according to several available criteria (here reported just the default ones), a radar chart is used. It illustrates the shape and joint similarities among the overall assembly in relation to the clique degree. This type of visualization is very useful to compare multiple data and to have a global evaluation in just a look. Moreover, the radar charts are convenient to compare two or more models on various features expressed through numerical values. The larger is the covered area, the more the two assemblies are similar. In the reported case, the user can observe immediately that the two models are not completely matched, even if they look very similar. This is because the gears in the two models have a signifi-cant different shape, which avoids including those parts among the matched one, thus decreasing the global level of similarity. On the other side, the retrieved portion com-pletely satisfies the requests, thus reporting an assemment of 1.
Fig. 5. Example of matching browsing
6
Conclusions
In this paper, methods for the identification and evaluation of similarities between CAD assemblies are presented. While almost all of the products are made of assem-bled parts, most of the works present in literature are addressing the problem of simi-larity among single parts. For assemblies, the shape of the components is not the only characteristic to be considered. Increasing the number of elements to consider, aug-ments from the one hand the possibility of adapting the search to specific user needs, and on the other hand the difficulty to evaluate the results. The method here described can consider all or a subset of the various aspects of the assembly, namely the shape of the components, their arrangements (i.e. patterns), their mating contacts and joints. The evaluation of the retrieved results is supported by exploiting colour variations in the 3D visualisation of the components in correspondence between the compared assemblies. Measures and statistics quantifying the similarity of the overall assem-blies and of the matched subparts are reported according to the various considered characteristics.
In future work, we plan to introduce graph databases, such as Neo4j, for speeding-up the search of local similarity among big assembly models. We also intend to improve the clique-finding algorithm by allowing it to select automatically the dimension of the biggest clique. Moreover, we intend to involve the definition of a single measure for the overall ranking of the retrieved assemblies similar to a query one. This information will be displayed in an ad-hoc infographics, which will be de-veloped for improving the user-experience.
References
1. Biasotti, S., Cerri, A., Aono, M., Hamza, A.B., Garro, V., Giachetti, A., Giorgi, D. , Godil, A., Li, C. Sanada, C., Spagnuolo, M., Tatsuma, A., Velasco-Forero. S.: Retrieval and
clas-sification methods for textured 3D models: a comparative study. The visual computer ISSN: 0178-2789 Springer. (2015) DOI: 10.1007/s00371-015-1146-3
2. Cardone, A.; Gupta, S. K.; Karnik, M.: A survey of shape similarity assessment algorithms for product design and manufacturing applications, Journal of Computing and Information Science in Engineering, 3(2), 2003, 109-118.
3. Iyer, N., Jayanti, S., Lou, K., Kalyanaraman, Y., Ramani, K.: Three-dimensional shape searching: state-of-the-art review and future trends In: Computer-Aided Design, vol. 37(5), pp. 509-530 (2005)
4. Tangelder, J. W., Veltkamp, R. C., (2008), A survey of content based 3D shape retrieval methods, In: Multimedia tools and applications, vol. 39(3), pp. 441-471
5. Deshmukh, A. S., Banerjee, A.G., Gupta, S. K. , Sriram, R. D.: Content-based assembly search: A step towards assembly reuse In: Computer-Aided Design, vol. 40(2), pp. 244-261 (2008)
6. Hu, K-M., Wang, B., Yong, J-H., Paul, J-C.: Relaxed lightweight assembly retrieval using vector space model In: Computer-Aided Desing, vol. 45(3), 2013, 739-750.
7. Miura, T., Kanai, S.: 3D Shape retrieval considering assembly structure In: Proceedings of Asian Symposium for Precision Engineering and Nanotechnology 2009 (ASPEN 2009) 8. Chen, X., Gao, S., Guo, S., Bai, J.: A flexible assembly retrieval approach for model reuse
In: Computer-Aided Design, vol. 44(6), pp. 554-574 (2012)
9. Lupinetti K., Giannini F., Monti M., Pernot J.-P.: CAD assembly descriptors for knowledge capitalization and model retrieval, Proceedings of the eleventh Symposium on Tools and Methods of Competitive Engineering - TMCE 2016, May 09-13, Aix-en-Provence, France (2016)
10. Lupinetti K., Chiang L., Giannini F., Monti M., Pernot J.-P.: Use of regular patterns of re-peated elements in CAD assembly models retrieval In Computer-Aided Design and Appli-cations, Vol. 14 (4), (2017)
11. Lupinetti K., Giannini F., Monti M., Pernot J.-P.: Automatic Extraction of Assembly Component Relationships for Assembly Model Retrieval, Procedia CIRP, Volume 50, 2016, Pages 472-477, ISSN 2212-8271 (2016)
12. Kazhdan M., Funkhouser T., Rusinkiewicz S.: Rotation invariant spherical harmonic rep-resentation of 3 d shape descriptors. Symposium on geometry processing. Vol. 6. 2003. 13. Bunke, H.; Foggia, P.; Guidobaldi, C.; Sansone, C.; Vento, M.: A comparison of
algo-rithms for maximum common subgraph on randomly connected graphs, in Structural, Syn-tactic, and Statistical Pattern Recognition, T. Caelli et al. (Eds.): SSPR&SPR 2002, LNCS 2396, 2002, Springer, p. 123–132 http://dx.doi.org/10.1007/3-540-70659-3_12
14. Eppstein, D., and D. Strash: Listing all maximal cliques in large sparse real-world graphs." International Symposium on Experimental Algorithms. Springer Berlin Heidel-berg, 2011.
15. Tomita, E., Tanaka, A., Takahashi, H.: The worst-case time complexity for generating all maximal cliques and computational experiments. Theor. Comput. Sci. 363(1), 28–42 (2006)
16. Bron, C., Kerbosch, J.: Algorithm 457: finding all cliques of an undirected graph. Com-mun. ACM 16(9), 575–577 (1973)
17. http://help.solidworks.com, Solidworks industrial designer (visited on 20/02/2017) 18. http://www.grabcad.com/. GrabCAD Workbench (visited on 22/02/2017)
19. http://www.tracepartsonline.net/ Product content everywhere (visited on 22/02/2017)