HAL Id: hal-02910264
https://hal.archives-ouvertes.fr/hal-02910264
Submitted on 1 Aug 2020HAL is a multi-disciplinary open access archive for the deposit and dissemination of sci-entific research documents, whether they are pub-lished or not. The documents may come from teaching and research institutions in France or abroad, or from public or private research centers.
L’archive ouverte pluridisciplinaire HAL, est destinée au dépôt et à la diffusion de documents scientifiques de niveau recherche, publiés ou non, émanant des établissements d’enseignement et de recherche français ou étrangers, des laboratoires publics ou privés.
Combined growth of α-Al and Bi in a Al-Bi-Cu
monotectic alloy analyzed by in situ X-ray radiography
Marcella G.C. Xavier, Rodrigo A.V. Reyes, Leonardo Gomes, José Spinelli, N.
Mangelinck-Noel, Henri Nguyen-Thi, Guillaume Reinhart
To cite this version:
Marcella G.C. Xavier, Rodrigo A.V. Reyes, Leonardo Gomes, José Spinelli, N. Mangelinck-Noel, et al.. Combined growth of α-Al and Bi in a Al-Bi-Cu monotectic alloy analyzed by in situ X-ray radiography. Journal of Crystal Growth, Elsevier, 2020, 536, pp.125592. �10.1016/j.jcrysgro.2020.125592�. �hal-02910264�
1
Combined growth of
α-Al and Bi in a Al-Bi-Cu monotectic alloy
analyzed by in situ X-ray radiography
Marcella G. C. Xavier a, Rodrigo A. V. Reyes a, Leonardo F. Gomes a, José E. Spinelli a,b,*, N.
Mangelinck-Noël c, Henri Nguyen-Thi c, Guillaume Reinhart c
a Federal University of São Carlos, Graduate Program in Materials Science and Engineering, 13565-905 - São Carlos, SP, Brazil.
b Department of Materials Engineering, Federal University of São Carlos, São Carlos, SP 13565-905 Brazil. c Aix Marseille Univ, Université de Toulon, CNRS, IM2NP, Marseille, France.
Abstract
Al-based monotectic alloys show an interesting combination of wear resistance and mechanical strength. While self-lubricating bismuth (Bi) guarantees an adequate wear resistance, the modification with copper (Cu) can increase the ability to support load. Tailoring the micromorphology of the α-Al phase as well as the distribution of the inclusions of Bi embedded in the α-Al matrix is of prime importance in order to improve the properties. In this paper, various solidification experiments are performed with the Al-3.2wt.%Bi-3wt.%Cu monotectic alloy. Real-time radiographs could be acquired during solidification by using the laboratory device SFINX (Solidification Furnace with IN situ X-radiography). The processing conditions could be chosen in such a way that both cellular and dendritic morphologies of the α-Al phase could be clearly seen in a single test. Micromorphological transitions from dendrites to cells are recognized for samples solidified from different cooling rates, i.e. 0.025 K/s and 0.01 K/s. Measurements of the α-Al dendrite velocity and growth parameters of the Bi droplets during solidification have also been extensively performed. A comprehensive model for the cellular-to-dendritic (CDT) transition of Al-based monotectic alloys is outlined. The model considers the interaction between α-Al and Bi droplets during solidification and its impact on the microstructure.
Keywords: A1. Solidification; A1. Interfaces; A2. Growth from melt; B1. Alloys.
(*) Corresponding author E-mail address: [email protected]
1. Introduction
Monotectic alloys could replace materials for advanced bearings in car engines in the near future. Indeed, aluminum based immiscible monotectic alloys have significant potential for practical applications including self-lubricated bearings, electrical contact materials and the fabrication of porous materials [1,2]. These alloys with bismuth, lead or tin dispersed in the matrix show propitious applications in automotive components because of their tribological characteristics, since such
2
dispersion of low melting temperature elements exhibits low hardness and eased flow under sliding conditions [3]. Nowadays, the alloys based on bronze with lead distributed irregularly are used in most of the car engines. New car developments request bearing materials with wear resistance, lower coefficient of friction and complying higher dynamically pressures when compared with bronze-lead alloy properties [4]. New alternative advanced bearing alloys may benefit from the use of Al based because of the resulting light weight of the parts. Moreover, such alloys should avoid the usage of lead, which has a harmful environmental impact because of its devastating effects on the human health.
Various microstructures can be obtained during monotectic alloy solidification depending on the solidification velocity and on the temperature gradient ahead of the solid-liquid interface. During the equilibrium monotectic transformation, the liquid phase (L1) decomposes at the monotectic
temperature concurrently into a solid phase of practically pure solid phase (A) and a liquid (L2): L1
A + L2. Fibers of the L2-phase embedded into the solid A can be obtained for low growth rate range.
The L2-phase is possibly found in the form of irregularly arranged strings of pearls or droplets for
higher growth rates at the same temperature gradient [5].
Silva et al. [6] performed directional solidification experiments under unsteady-state regime with hypermonotectic Al-5.0wt.%Bi and Al-7.0wt.%Bi alloys. These authors found that the interphase spacing (i.e. the distance between Bi particles) decreases with increasing alloy solute content under similar growth conditions. The authors showed as well that more concentrated hypermonotectic alloys develop more enriched layers of L2 in the liquid immediately ahead of the solidification front.
Consequently, coarser Bi droplets may result with increasing alloy solute content.
Most studies related to monotectic alloys have applied the directional solidification (DS) technique to evaluate the inherent impact of the process parameters on the final microstructure features [4,5], i.e. mainly: grain size, α-Al morphology, monotectic element distribution, porosity and inclusions. More generally, an accurate control of growth processes is decisive in engineering. Indeed, the final properties of metal alloys are strongly dependent on the characteristics of the grain structure forming in the course of the solidification phase [7–10]. An extensive variety of solidified microstructures are observed in casting, welding and other solidification processes [7,8]. The change in solidification process parameters modifies the structure and, consequently, changes the mechanical properties of the solidified alloy. For several decades, metallurgists, physicists and mathematicians concentrated their efforts on understanding and characterizing solidification interface morphologies, among which one of the most complex morphology - also the most predominant form of crystallization – is the dendritic microstructure. Resulting from the solidification process, the cellular and dendritic spacings are crucial microstructure parameters, significantly influencing the casting properties. The microstructure also affects the segregation at the microscopic level which takes place at the level of the cellular and dendritic ramifications and can also influence the final macroscopic mechanical behavior [9].
3
Depending on the characteristics of the employed solidification technique, it is possible to control, within certain limits, the main parameters that interfere in the solidification microstructure establishment of the analyzed alloy, such as the growth speed (V) and the thermal gradient at the solid / liquid interface (G) [8].
In situ and real-time imaging by X-Ray radiography coupled with a directional solidification
furnace is a method of choice to disclose the dynamical evolution of solidification fronts grown from the melt and microstructure formation during the solidification of metal alloys [10–14]. Moreover, it has the advantage to be non-destructive [15]. It has already proved its potential to obtain unique information on the physical phenomena taking place during the solidification of aluminum-based alloys and to investigate the micromorphology of the α-Al phase in Al-based alloys [16].
Aluminum-based binary monotectic alloys such as Al-Bi have been studied so far using the aforementioned methods, especially with respect to their microstructural and morphological development. Schaffer et al. [17,18] performed experiments using X-ray radiography and a Bridgman type furnace to study the solidification of a hypermonotectic Al-8wt.%Bi alloy. It was demonstrated that while small droplets are engulfed, larger droplets are generally pushed by the monotectic front; contradicting the general understanding from literature in which it is believed that large droplets may be more easily engulfed. According to this investigation, the large droplets are kept in motion (preventing their engulfment) due to solutal Marangoni effects in combination with repulsive diffusion-driven effect. Both depletion and consumption of Bi in the growth of already formed droplets at the monotectic front rapidly decreases the supersaturation in Bi in the adjacent liquid L1. Consequently, undercooling is locally decreased in the vicinity of newly formed droplets.
In comparison to the binary monotectic systems, systematic studies regarding the ternary metallic monotectic alloys are scarce. However, the addition of elements to Al alloys can, for example, improve the ability of these materials to resist loads without fracturing [19,20] but modifies at the same time their solidification microstructures so that their solidification have to be studied in more details.
According to Gröbner and Schmid-Fetzer [20], Al-Bi-Cu and Al-Bi-Zn monotectic systems alloys may allow the occurrence of a ternary monotectic reaction involving two liquids and two solids. It was demonstrated that up to four phases (L1 = L2 + (Al) + S2) can be obtained [21]. Unique
microstructural arrangements can be developed considering the desired application characteristics. These systems also allow the simultaneous occurrence of liquid separation with the formation of intermetallic particles or other equilibrium phases. These alloys have an extremely pronounced miscibility gap, reaching in binodal temperatures much higher than those observed in the Al-Bi system. This characteristic provides a high separation capacity of the liquid phases. For the Al-Bi-Cu alloy, the equilibrium ternary monotectic reaction is given by L1 = L2 + Al2Cu + (Al) occurring at 544
4
The present study reports on the vertical directional solidification (DS) of the ternary Al-3.2wt.%Bi-3.0wt.%Cu alloy observed in situ utilizing the SFINX (Solidification Furnace with IN-situ X-radiography) IM2NP laboratory device. Cellular/dendritic transitions during the DS were observed. Quantitative measurements of the α-Al dendrite velocity and the radii of the Bi droplets were performed. Furthermore, samples were characterized by SEM-EDS technique after solidification to determine the main evolution of Bi and Cu composition profiles along the axial length.
2. Experimental procedure A - Solidification setup
The SFINX (Solidification Furnace with IN situ X-radiography) is a Bridgman type directional solidification device connected to an X-ray monitoring system, which enables the direct observations of the growth morphology of the phases forming during aluminum-based alloy solidification. The system is built with a two-zone furnace separated by an adiabatic gap. Temperatures up to 750 °C can be applied to the heater elements and cooling rates Ṫ between 0.01 and 1.5 K/s can be imposed. Two K-type thermocouples are inserted in both heaters to measure the temperature close to the crucible. The X-radiography technique allows the characterization of metal solidification in situ and in real time. The projected images have a field of view (FOV) of about 5 x 5 mm2 with a sufficient spatial resolution (pixel size: 3.85 µm) to distinguish the microstructure features
and are recorded every half second. The contrast obtained in the X-ray radiography images is always related to the relative absorption of X-rays when crossing the different phases and depends on their composition density, and is also related to the thickness of these regions. In this particular alloy, the main contribution to the contrast is related to the composition and density difference between the different phases. A good contrast between the growing solid and the surrounding liquid phases can be obtained for the alloy under study because of the absorption difference between Al-α and Bi phases. Image processing is used to improve the quality of the radiographs by removing the detector background and sample environment artefacts by applying a flat-field correction using an image recorded with the sample in the fully liquid state in the field of view [10].
The Al-3.2wt.%Bi-3.0wt.%Cu alloy samples (50 mm in length and a width of 5 mm) were extracted from a previously solidified ingot by using a wire spark-erosion machining with high precision geometry. Each sample was mechanically polished down to the desired thickness (about 200 µm) and then placed between two flexible glassy carbon sheets with a stainless-steel frame. Then, the crucible was positioned inside the furnace.
The SFINX device was positioned to ensure that the solidification occurs parallel to the gravity vector g and in the opposite direction, i.e., solidification from bottom to the top. A constant temperature gradient was applied between the heater elements by setting a temperature Thot = 700ºC to
5
applying the same cooling rate on both heater elements after the sample was firstly completely melted in the field of view. Sequences of melting/solidification cycles were achieved with different cooling rates (Ṫ): 0.01 K/s; 0.025 K/s; 0.5 K/s and 1.0 K/s. These solidification conditions were chosen to analyze the growth of the liquid Bi droplets as well as the formation of the α-Al dendrites and cells under slow and fast cooling rates.
According to the evolution of the phase fractions in equilibrium conditions extracted from the phase diagram calculation by using Thermo-Calc (Figure 1), the range of temperatures chosen to be analyzed varies from 650 to 600°C. Furthermore, the experimental area fraction variations of the Bi droplets become negligible for lower temperatures.
(a) (b)
Figure 1. (a) Equilibrium phase fractions of the Al-3.2wt.%Bi-3wt.%Cu alloy as a function of the temperature, computed using TCAL5 database of the Thermo-Calc software and (b) detailed view
of the same plot for mass fractions lower than < 0.06.
B - Image and sample analysis
Successive images of the solid-liquid interface were recorded in order to display the temporal evolution of Al-3.2wt.%Bi-3.0wt.%Cu alloy solidification. Some characteristic images are shown in Figure 2. It was possible to identify the contrast characterizing two main regions, which are the α-Al dendrites (light grey) surrounded by a solute-containing liquid (dark grey) as can be seen for example in 2a. Due to solute rejection during solidification, the solute-enriched boundary layer (dark grey) is visible just ahead of the solidification front. The changes in the solidification microstructure and morphology during growth are visible. The Bi liquid droplets formed from the monotectic reaction Liquid 1 (Al-Bi-Cu) Liquid 2 (Bi) + α-Al are evidenced in the images as black spots (Figure 2b).
6 Figure 2. Typical X-ray radiographs of the Al-3.2wt.%Bi-3.0wt.%Cu alloy solidification under a
cooling rate of 0.025 K/s and an applied temperature gradient of 7.5 K/mm: (a) growing α-Al dendrites at t = 33 s after the start of cooling down (t); (b) Bi droplets dispersed within the α-Al at t =
231 s and (c) tracking of the solidification front based on three lines along the field of view (F1, F2, F3).
Quantitative analysis was performed using the radiograph sequences. Various microstructure features and thermal parameters can be derived from the in situ images, that is, the α-Al growth rate, the thermal gradient, and the Bi radius. During the experiments, a constant temperature gradient, G, is imposed. Several cooling rates are applied to induce the solidification of the samples. The instantaneous growth rate V(y,t) is measured using the solidified transverse lengths in two successive X-ray radiographs as a function of time. For each experiment (i.e. for each cooling rate), three α-Al dendrites are tracked, and their velocity measured (Figure 2c). The local thermal gradient can be estimated by using the equation G = Ṫ/V (1) with Ṫ, the cooling rate and V, the growth rate. It is essential to emphasize that such correlation is only applicable during stationary growth after the initial transient step. Additionally, the growth of Bi droplets was correlated with temperature. The value of the Bi droplets radius was deduced by the measurement of the areas occupied by the corresponding liquid phase. The average areas occupied by the droplets of Bi were determined by counting the area fractions using the ImageJ processing software, which is an open source Java image processing program inspired by NIH Image [24]. These areas are assumed to be spherical as a first approximation. After solidification, concentration profiles of Bi and Cu were determined. Special attention was given for the samples revealing the cellular to dendritic transition. In this case, the chemical compositions related with the shift in the α-Al morphology were assessed. For this purpose, the instrument used was a Philips SEM (XL-30 FEG) equipped with an energy dispersive X-ray spectrometer (EDS).
7 3. Results and discussion
A - Growth of α-Al cells and dendrites under slow and fast cooling rates
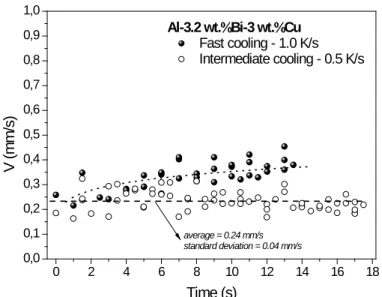
Tracking α-Al dendrite fronts for four tests on different samples with distinct cooling rates allowed plotting the average α-Al dendrite velocities as a function of time as can be seen in Figures 3 and 4. The experiments have been categorized as intermediate/fast cooling for higher cooling rates (0.5 K/s and 1.0 K/s) in Figure 3 and as slow cooling for lower cooling rates (0.01 K/s and 0.025 K/s) in Figure 4.
Although some unavoidable experimental fluctuations in V values can be seen in Figure 3, the process under intermediate/fast cooling conditions appears to be rather stable as concerns this parameter. For example, α-Al growth velocities range from 200 to 300 µm/s for the sample solidified at a rate of 0.5 K/s. Neither acceleration nor deceleration of the α-Al front can be noted here. All chosen dendritic fronts demonstrated a similar profile in value and evolution of V. In contrast, the growth velocity profile related with the sample solidified at 1.0 K/s clearly exhibits an initial acceleration until stabilizing to V values around 400 µm/s. However, it is worth noting that the growth velocity plateau is attained as soon as after 6 seconds of cooling down when the experiment lasts about 14 s. The acceleration is due to the transient step when the cooling rate is applied soon followed by stationary growth.
The behavior is different for the measured α-Al velocities in the samples solidified under slow cooling rates as observed in Figure 4. The growth rate decreases during the experiments. The continuous build-up of solutes (Bi and Cu which are both denser elements compared to Al) in the liquid immediately ahead the solidification front can contribute to the growth rate deceleration.
In the case of fast and intermediate cooling rates, the solutal accumulation at the solid-liquid interface is not sufficient to induce a decrease of the growth velocity during the growth of the dendritic front and the effect of convection is dampened due to the high velocity compared to the convective flow [25].
On top of the aforementioned dendrite solidification tendencies, it is worth noting that a reversal of the V trend occurs after about 100 s and 200 s in samples solidified at 0.025 K/s and 0.01 K/s, respectively. The growth velocity suddenly increases before returning to the general trend evolution, i.e. a decrease of V until the end of the solidification within the field of view. Such features can be clearly observed in Figure 4b. V values return to their earlier values at about 350 s and 500 s, respectively. This evolution can be related to the cellular-to-dendritic transition and to the Bi-droplet formation and will be explained in details in the following sections.
8 0 2 4 6 8 10 12 14 16 18 0,0 0,1 0,2 0,3 0,4 0,5 0,6 0,7 0,8 0,9 1,0
Al-3.2 wt.%Bi-3 wt.%Cu Fast cooling - 1.0 K/s Intermediate cooling - 0.5 K/s V ( mm/ s) Time (s) average = 0.24 mm/s standard deviation = 0.04 mm/s
Figure 3. Experimental plots of velocity profiles with time measured across the FOV of the Al-3.2 wt.%Bi-3 wt.%Cu alloy cooled at rates of 0.5 K/s and 1.0 K/s (i.e. intermediate and fast regimes,
respectively). 0 100 200 300 400 500 600 700 800 900 100 0.000 0.005 0.010 0.015 0.020 0.025 0.030 0.035
Al-3.2 wt.%Bi-3 wt.%Cu Slow cooling - 0.025 K/s Slow cooling - 0.01 K/s V ( mm/ s) Time (s) 0 100 200 300 400 500 60 0.000 0.002 0.004 0.006 0.008 0.010 0.012 0.014 0.016 0.018
Al-3.2 wt.%Bi-3 wt.%Cu Slow cooling - 0.025 K/s Slow cooling - 0.01 K/s V ( mm/ s) Time (s) (a) (b)
Figure 4. Velocity profiles measured for the slow-cooling rate solidification with Al-3.2 wt.%Bi-3wt.%Cu alloy samples: (a) general view and (b) zoom for t < 600 s highlighting the reversal of the
velocity trend for both 0.01 K/s and 0.025 K/s experiments.
Moreover, the dendrite trunks are thinner and in higher number for the sample solidified at 1.0 K/s if compared to those solidified at 0.5 K/s and 0.01 K/s (Figure 5) as the primary dendrite spacing is inversely proportional to the growth rate for a given temperature gradient and thus to the cooling rate [26,27]. Another feature to be considered is the shape of the solid-liquid interface constituted of α-Al dendrites as a function of the imposed cooling rate. Figure 5 shows that a flatter interface characterizes the sample solidified at 1.0 K/s compared with the uneven interface associated with the sample solidified at 0.01 K/s. The effect of the melt convection and solute segregation strongly depend on the ratio of the convection velocity, U, to the solidification velocity, V. Camel and Dupouy [28] defined an adimensional number, Γ, in order to compare easily these two velocities : Γ = U/V,
9
where U is the interdendritic flow velocity induced by natural convection and V is the growth rate. According to this model, if Γ < 1 the growth regime is said to be diffusive because the effect of convection is negligible and the microstructure at the interface is uniform. However, if Γ >> 1, growth regime is dominated by convection and lateral segregation able to create lateral liquid and later eutectic regions can establish due to convective flows. For higher V in our experiments, Γ < 1 and the interface is regular and homogeneous, which is an indication of the absence of lateral solute segregation.
Moreover, because of the lower permeability of the mushy zone for the highest cooling rate (Figure 5), the interaction of these thinner growing structures with the interdendritic fluid flow is less effective.
Figure 5. Radiography images recorded in the first stages of growth for samples cooled at rates of (a) 0.01 K/s and (b) 1.0 K/s.
B – Cellular-to-dendritic transition
Although various investigations have been performed in order to better understand the distinct morphologies of the minority phase obtained by the monotectic reaction [5,29–37], until recently very few has been carried out in the domain of micromorphology description of the leading α-Al phase during monotectic growth. The present investigation using X-radiography enables us to focus on this scarcely studied issue.
The present experimental results allow determining the parameters of the micromorphological transition in the Al-based monotectic alloys of interest. From these experiments, a diagram of the cellular-to-dendritic transition as a function of V and G was obtained. It is demonstrated that columnar dendrites develop for higher growth velocities and lower thermal gradients whereas cellular structures develop for lower V and higher G, as solidification progresses as also shown in the literature [38,39].
10
This work made possible to determine with quite good precision the transition in α-Al as a function of the local solidification conditions. The proposed growth map of the Al-3.2wt.%Bi-3wt.%Cu alloy can be seen in Figure 6. The region delimited by dashed lines represents an extrapolation of the experimental data. Regions of dendritic (D) and cellular (C) microstructures are delimited.
Overall, this growth map is a useful way to categorize the influence of the solidification conditions on the α-Al morphology in this alloy.
100 2x100 3x100 4x100 10-3 10-2 10-1 100
D
D
G
ro
w
th
v
elo
city
, V
(
m
m
/s
)
Thermal gradient, G (K/mm)
Al-3.2wt.%Bi-3wt.%Cu alloyD
C
D - dendritic growth C - cellular growthFigure 6. G-V diagram with the indications of D - dendritic morphology and C- cellular morphology of the α-Al based from in situ observation of the solidification of the Al-3.2wt.%Bi-3wt.%Cu alloy.
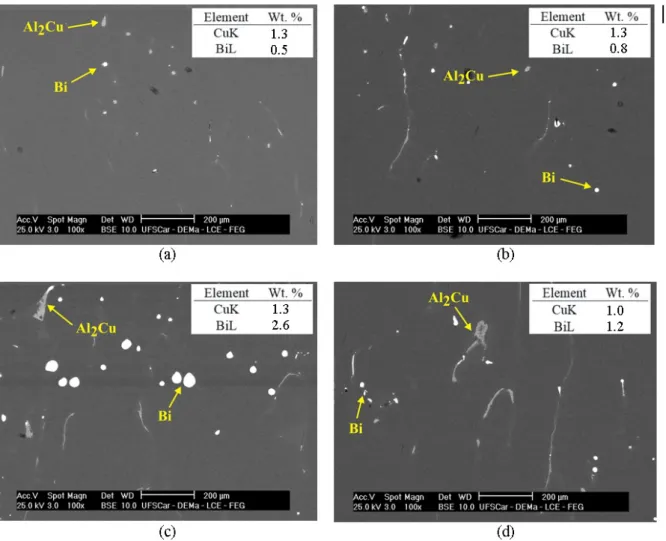
Besides, SEM/EDS data for the sample solidified at 0.01 K/s are shown in Figure 7. The compositions were measured using EDS in these areas. Four transverse images within the X-ray imaging FOV were used for these measurements. The microstructure is constituted of an α-Al matrix with embedded Bi areas (white spots in Figure 8) and Al2Cu particles (light gray in Figure 8). The
compositions were assessed either for regions close to the bottom of the X-ray imaging experimental FOV (1 mm: first stages / dendrites – Figure 7a) or for regions at a later stage during solidification (4 mm: last stages / cells – Figure 7d).
The tables within each micrograph in Figure 7 show the average compositions of Bi and Cu. Both Bi and Cu contents increase as solidification progresses until approximately 3 mm from the bottom of the FOV, as can be seen in Figures 7a and b. This is due to the enrichment in solute in the liquid immediately ahead the solidification front according to the phase diagram in Figure 1. Considering the experimental configuration set as vertical upward solidification, when both solutes (Cu and Bi) are rejected to the interdendritic regions, a denser interdendritic liquid than the nominal composition liquid metal is established and, an enriched-solute layer is formed above the interface as evidenced experimentally by the darker contrast just above the interface in Figures 2 and 5.
11
The region above 4 mm is characterized by a reduction of both Cu and Bi compositions (Figures 7c and d). The solute-enriched region at approximately 3 mm from the bottom of the FOV can be directly correlated with the regions in which the α-Al growth velocity reverses its tendency and starts to accelerate until coming back to the regular trend as observed in Figure 4b. The associated times related with this feature range from 200 s to 500 s.
Figure 7. SEM-EDS composition measurements and typical SEM images along the FOV in the sample solidified at 0.01 K/s (axial solute contents for Cu and Bi). The images and compositions are
related to the positions (a) 1 mm; (b) 2 mm; (c) 3 mm and (d) 4 mm from the bottom of the FOV.
C - Growth of the minority phase: Bi
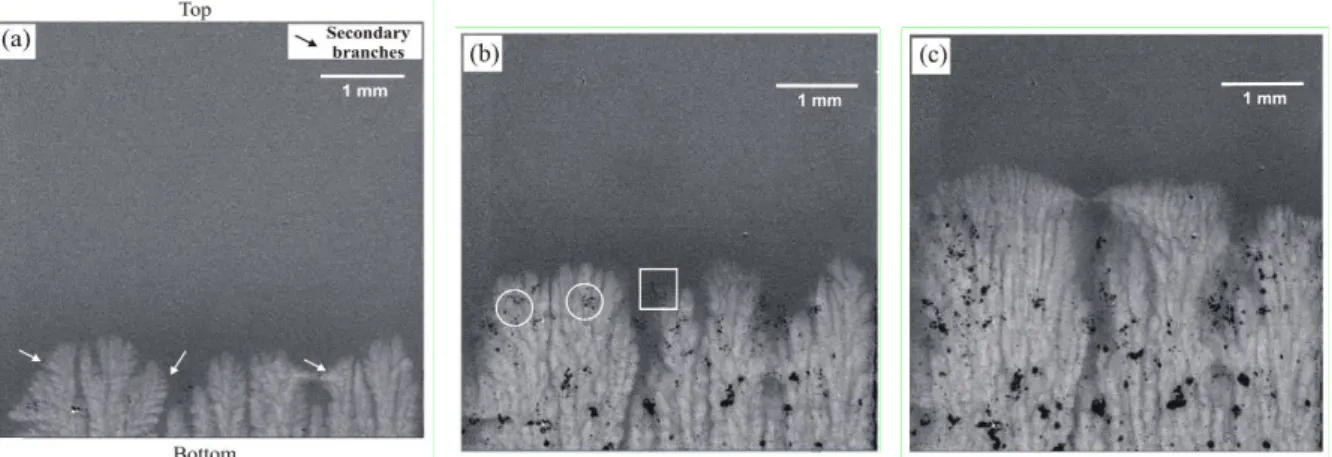
The sequence of images recorded during the growth of the α-Al phase shows the prevalent morphologies for the different stages during the solidification at 0.01 K/s (Figure 8). The dendritic morphology at the early stages gradually evolves into finer parallel cellular stems (Figure 8c). An image taken during the transition stage is shown in Figure 8b (V = 3.1 µm/s and G = 2.5 K/mm). The sequence of images examined here is representative of the behavior in various experiments for slow cooling rates of 0.01 K/s and 0.025 K/s.
12
During the first stages of growth very few Bi droplets can be observed as shown in Figure 8a. Bi droplets develop only after few millimeters of solidification. This is due to the fact that solidification starts with a transient stage during which the liquid undercooling might not be sufficient to induce the nucleation of Bi-droplets.
The area outlined by a square in Figure 8b shows the early growth of Bi droplets just above the interface. The nucleation occurs close to the dendrite tip but also in the upper part of the interdendritic channel. If the monotectic reaction is reached, L1 decomposition explicitly forces L2 to
nucleate. The nucleation is said heterogeneous if it starts on a pre-existing α-Al front, or homogeneous if the monotectic reaction is initiated in the liquid L which seems to be the case here.
The regions defined by circles show, as an alternative, the growth of Bi droplets occurring below the interface. So, the monotectic reaction conditions are attained in various sites as solidification progresses.
As concern the Al2Cu phase, in the alloy under study (Al-Bi-Cu), the Al2Cu phase is foreseen
to start to grow at a temperature around 475ºC as can be seen in Figure 1. As such, this phase does not take part into the monotectic reaction as the formation of Bi droplets is observed at higher temperatures.
Figure 8. Sequence of radiographs recorded during directional solidification of the Al-3.2wt.%Bi-3.0wt.%Cu alloy for a cooling rate of 0.01 K/s applied on both heaters showing the occurrence of a
dendritic-to-cellular transition: (a) dendritic microstructure (t = 188.5 s; V = 3.8 µm/s and G = 2.7 K/mm); (b) transition step (t = 484.0 s; V = 3.1 µm/s and G = 2.5 K/mm) and (c) cellular
microstructure (t = 753.5 s; V = 2.2 µm/s and G = 4.2 K/mm).
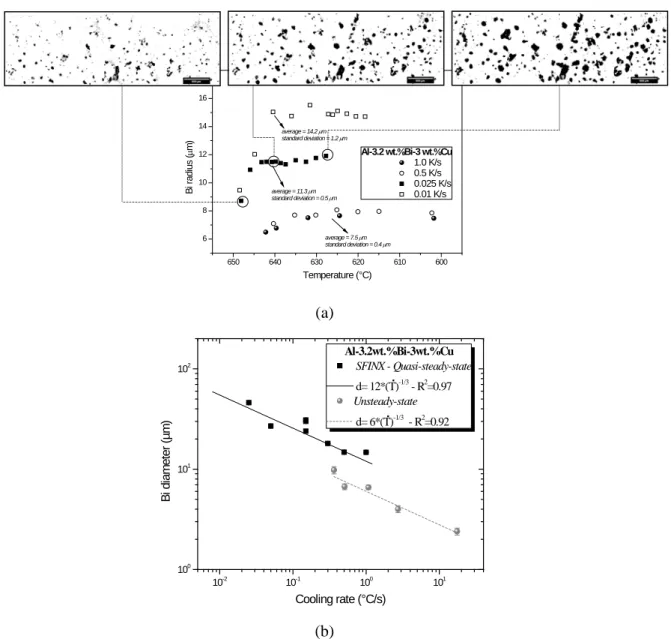
The recorded radiographs also allowed determining the evolution of the Bi-droplet radius as a function of temperature and time for the different applied cooling rates (Figure 9a). Larger droplets form when samples are solidified at lower cooling rates (squares in Figure 9a). The experimental measured variation of the Bi droplet size becomes negligible for temperatures lower than 635ºC in all examined tests. Data related to the last stage of growth were then compiled in association with the applied cooling rates.
Even though the monotectic reaction is expected to happen at 650ºC under equilibrium conditions (Figure 1), Bi droplets have not been captured at such temperature. As a matter of fact, in
13
the case of the samples solidified at higher cooling rates, that is, farther from the equilibrium, detectable Bi droplets occur at temperatures lower than 642 ºC. It is important to note that droplets smaller than 8 µm cannot be revealed because of the X-radiography spatial resolution.
The temperatures associated with the first measurable Bi droplets are 648 ºC, 648 ºC, 640 °C and 642 °C for the samples solidified at 0.01 K/s, 0.025 K/s, 0.5 K/s and 1.0 K/s, respectively. Thus, the Bi nucleation undercooling increases with increasing cooling rate.
Zhao and co-authors [40] found that the radius of the minority phase droplet reduces with increasing cooling rate. Through modelling the rapid solidified monotectic Al-5 wt.% Pb alloy microstructures, it is shown that the nucleation rate increases to a higher level when increasing the solidification velocity (V) for a given thermal gradient (G). This is because higher V leads to a faster cooling rate. Consequently, the number of droplets in front of the interface tends to increase whereas the droplet size decreases.
Considering the growth of a single droplet, a local increase in the undercooling may inhibit its growth. This is explained by the inhibition of the diffusion of Bi at lower temperatures. Such inhibition of the Bi growth in the rapidly solidified samples at 0.5 K/s and 1.0 K/s results in a very narrow range of variation in size from 7 µm to 8 µm. On the other hand, a wider range from 9 µm to 16 µm is related to the Bi droplets grown in the slowly solidified samples.
14 650 640 630 620 610 600 6 8 10 12 14 16 18
Al-3.2 wt.%Bi-3 wt.%Cu
1.0 K/s 0.5 K/s 0.025 K/s 0.01 K/s B i r adi us ( µm) Temperature (°C) average = 14.2 µm standard deviation = 1.2 µm average = 11.3 µm standard deviation = 0.5 µm average = 7.5 µm standard deviation = 0.4 µm (a) 10-2 10-1 100 101 100 101 102 Al-3.2wt.%Bi-3wt.%Cu SFINX - Quasi-steady-state d= 12*(T)-1/3- R2=0.97 Unsteady-state d= 6*(T)-1/3 - R2 =0.92 B i di am et er ( µ m ) Cooling rate (°C/s) (b)
Figure 9. (a) Experimental variations of liquid Bi droplet size as a function of temperature during steady-state growth and (b) comparative plots of the Bi droplet diameters for both unsteady-state and
quasi-steady-state regimes for the Al-3.2wt.%Bi-3wt.%Cu alloy at different cooling rates.
In addition, the present results allowed comparisons of the experimental scaling laws relating the Bi diameter, d, with the cooling rate considering results extracted under quasi-steady and non-steady growth of the Al-3.2wt.%Bi-3wt.%Cu alloy. The points related with non-non-steady growth earlier published [41] were included in Figure 9b for comparison purposes.
In Figure 9b, points are experimental results whereas lines represent empirical fits of the experimental points. Assuming the derived relationship d3·Ṫ = C with C being a constant value, it can
be highlighted that C for Al-Bi-Cu alloy under such different configurations differ by one order of magnitude (between 10-15 and 10-16). The constant parameter C for quasi-steady-state conditions
(SFINX experiments) is larger than that observed for the growth under unsteady-state regime [40]. As such, the quasi-steady-state samples of the ternary monotectic alloy exhibit coarser Bi particles at any cooling rate. It is well known that the mass transport in front of the monotectic interface is affected by
15
thermocapillary motion, which causes convection between both immiscible liquids L1 and L2
[5,17,18,33]. Moreover, the microstructural features depend on both nucleation and diffusional growth of the Bi droplets, which occur concurrently. Stokes and Marangoni effects must be taken into account since phases may be spatially separated favoring collisions and coagulations [5,17,18,33]. This seems to explain the present differences in the results since the droplet motion appears to be favored for the growth under quasi-steady-state conditions, which occurs under slow cooling rate regime. In this case, separation of the liquid phases can induce more effective coagulation between the droplets, resulting in thickening of Bi for the quasi-steady-state samples.
In unsteady-state regime, localized thermal instabilities in the vicinity of the solid-to-liquid interface may be induced precisely because of the unsteadiness of the process, in which heat flow is time dependent. Therefore, fluctuations in the thermal gradients in the liquid phase above the interface are expected to occur. It appears that such thermal instability of the α-Al solidification front during unsteady-state growth could contribute to intensify nucleation of the L2 droplets at the interface and
could lead to the formation of finer particles.
D - Model of the interaction between α-Al and Bi droplets
Local morphology changes of the solid/liquid interface happen as demonstrated before. It is caused by both thermal and solutal interactions occurring during a narrow process window.
Figure 10 shows a schematic representation of the mechanism of morphological transition derived from our experiments for the Al-Bi-Cu alloy under slow cooling rates (i.e. 0.025 K/s and 0.01 K/s). The first period is characterized by dendrites growing at velocities V1 and V2 in Figure 10a. The first stage (Figure 10a) can be described as a period of intense segregation since high solute rejection at the solidification front occurs. Because of the highly solute-enriched liquid ahead of the dendrite tips, a reduction in the growth velocity happens from V1 to V3. Finally, conditions for the monotectic reaction and for the nucleation of Bi droplets can be reached. Consequently, the number of Bi droplets increases remarkably as can be seen in Figure 8b. The high density of Bi particles may be noted either above or slightly below the interface. The deceleration of the solidification front attains its higher degree in V3. Under such conditions, the Bi-enriched liquid above the interface is consumed to generate Bi droplets due to the monotectic reaction occurring either homogeneously at the interdendritic channels or heterogeneously using Al-rich phase as a nucleation substrate. After some time, the liquid ahead the α-Al front is found depleted in Bi. As such, the solute content in the liquid close to the front tips decreases, which allows the start of the morphological transition towards cellular morphology [42].
The phase related with V4 is associated with an increase of α-Al growth velocities, which is represented by the reversal behavior of V as discussed above (Figure 4b). A sudden acceleration of the cellular/dendritic front (i.e., non-defined shape during transition stage) occurs concurrently with
16
the consumption of Bi in the form of droplets. In this stage, the process of L1 decomposition
nucleating L2 is also observed into the interdendritic regions far from the solidification front.
However, the growth rate remains lower than the limit velocity for a new transition to dendritic structure at this composition maintaining cellular growth microstructure.
According to the SEM-EDS results in Figure 7, concentrations of Bi and Cu achieve their higher values for regions around 3 mm from the bottom of the FOV. Such increase in concentration corresponds to the aforementioned transition from Figure 12c to e.
At the later stages of growth (i.e., V5 in Figure 10 and in Figure 8c) the trend of the growth velocity is recovered, and no more oscillations are observed. A higher number of cellular stems are likely to develop as finer parallel α-Al cells.
Figure 10. Mechanism of morphological transition and of Bi droplet nucleation in Al-3.2wt.%Bi-3wt.%Cu alloy. a) Dendritic growth, b) Nucleation of first Bi droplets, c) Transition from dendritic to
cellular growth, d) Cellular growth and continuous Bi droplet formation, e) Cellular growth and Bi droplet rearrangement, f) Schematic showing the evolution of the dendritic front velocity.
4. Conclusions
The present research work describes directional solidification experiments with the Al-3.2wt.%Bi-3wt.%Cu monotectic alloy. X-radiography was used to characterize in situ and in real-time the microstructures and the formation of Bi droplets during the solidification of this alloy. The microstructures are homogeneously distributed in position and size without local segregation pockets for the highest cooling rate of 1.0 K/s whereas an irregular interface and microstructures typifies the sample solidified at 0.01 K/s. This difference appears to be related with the resulting diffusive-driven growth regime for high cooling rates. Moreover, the results for slow cooling rates showed that two
17
morphologies where observed within the X-ray imaging field of view without any modification of the growth parameters: α-Al dendrites in the first stages and cells in the upper solidified region. A microstructure solidification map as a function of G and V could be proposed for this alloy following our experiments.
The variation of cooling rate induces a variation of the undercooling of formation of the Bi droplets which affects the growth behavior of the Bi droplets. In slowly cooled samples, longer durations favor the diffusion mechanisms so that a wider range of sizes from 9 µm to 16 µm was observed for the growth of Bi.
Lastly, a model mechanism for the time-dependent phase formation and evolution is proposed for this alloy. The conclusion is sustained by the in situ X-ray imaging time-resolved qualitative mechanisms, the possible microstructure real growth rate measurement and is further strengthened by
ex situ measurements of the Bi and Cu compositional profiles by SEM-EDS, confirming the
time-dependent proposed phase formation and evolution mechanism.
The interaction of Bi droplet formation leading to solute depletion in conjunction with the α-Al growth front can drive the cellular-to-dendritic transition in the ternary α-Al-Bi-Cu alloy. Experimental evidences are established showing that the monotectic reaction (formation of Bi droplets) can modify the solute concentration just above the solid-liquid interface and can create conditions for α-Al microstructure change and growth rate variations. Indeed, in the course of solidification, the liquid above the interface becomes depleted in Bi since most of this element is consumed in Bi droplets. Thus, local conditions could be attained in order to allow the beginning of the morphological transition towards a cellular morphology.
Acknowledgements
The authors are grateful to FAPESP (São Paulo Research Foundation, Brazil: grant 2017/12741-6), National Council for Scientific and Technological Development – CNPq (grant 400506/2016-5), Coordenação de Aperfeiçoamento de Pessoal de Nível Superior - Brazil (CAPES) and Comité Français d’Évaluation de la Coopération Universitaire et Scientifique avec le Brésil (COFECUB: Project 23038.000069/2015-04 and grants 88887.185338/2018-00; 88887.190655/2018-00) and to CAPES-COFECUB program (N° Ph-C 857/15) for their financial supports.
References
[1] N. Wang, B. Wei, Phase separation and structural evolution of undercooled Fe–Sn monotectic alloy, Mater. Sci. Eng. A. 345 (2003) 145–154. doi:10.1016/S0921-5093(02)00471-9.
18
on a directionally solidified Al-In monotectic alloy, Tribol. Int. 66 (2013) 182–186. doi:10.1016/j.triboint.2013.05.009.
[3] G. Phanikumar, P. Dutta, R. Galun, K. Chattopadhyay, Microstructural evolution during remelting of laser surface alloyed hyper-monotectic Al-Bi alloy, Mater. Sci. Eng. A. 371 (2004) 91–102. doi:10.1016/j.msea.2003.09.071.
[4] L. Ratke, S. Diefenbach, S. Drees, J. Alkemper, B. Prinz, A. Romero, H. Ahlborn, Multi-droplet Marangoni motion in immiscible AlSiBi alloys - Results of a D-2 experiment, Adv. Sp. Res. 16 (1995) 185–190. doi:10.1016/0273-1177(95)00157-A.
[5] L. Ratke, Theoretical considerations and experiments on microstructural stability regimes in monotectic alloys, Mater. Sci. Eng. A. 413–414 (2005) 504–508.
doi:10.1016/j.msea.2005.08.195.
[6] A.P. Silva, J.E. Spinelli, N. Mangelinck-Noël, A. Garcia, Microstructural development during transient directional solidification of hypermonotectic Al-Bi alloys, Mater. Des. 31 (2010) 4584–4591. doi:10.1016/j.matdes.2010.05.046.
[7] M. Çadiril, E.; Gündüz, Directional Solidification of Pb-Sn alloys, J. Mater. Sci. 35 (2000) 3837–3848. doi:10.1023/A:1004829413966.
[8] M. Gündüz, E. Çadirli, Directional solidification of aluminium-copper alloys, Mater. Sci. Eng. A. 327 (2002) 167–185. doi:10.1016/S0921-5093(01)01649-5.
[9] O.L. Rocha, C.A. Siqueira, A. Garcia, Cellular/dendritic transition during unsteady-state undirectional solidification of Sn-Pb alloys, Mater. Sci. Eng. A. 347 (2003) 59–69. doi:10.1016/S0921-5093(02)00581-6.
[10] G. Reinhart, G., Abou-Khalil, L., Nguyen-Thi, In situ analysis of the grain structure formation during horizontal directional solidification of a refined Al-20wt.%Cu alloy, in: Proc. 5th Decenn. Int. Conf. Solidif. Process., Old Windsor, 2017.
[11] B. Cai, J. Wang, A. Kao, K. Pericleous, A.B. Phillion, R.C. Atwood, P.D. Lee, 4D synchrotron X-ray tomographic quantification of the transition from cellular to dendrite growth during directional solidification, Acta Mater. 117 (2016) 160–169. doi:10.1016/j.actamat.2016.07.002. [12] H. Nguyen-Thi, L. Salvo, R.H. Mathiesen, L. Arnberg, B. Billia, M. Suery, G. Reinhart, On the interest of synchrotron X-ray imaging for the study of solidification in metallic alloys, Comptes Rendus Phys. 13 (2012) 237–245. doi:10.1016/j.crhy.2011.11.010.
[13] S. Boden, S. Eckert, B. Willers, G. Gerbeth, X-ray radioscopic visualization of the solutal convection during solidification of a Ga-30 Wt Pct in alloy, Metall. Mater. Trans. A Phys. Metall. Mater. Sci. 39 A (2008) 613–623. doi:10.1007/s11661-007-9462-5.
[14] R.H. Mathiesen, L. Arnberg, F. Mo, T. Weitkamp, A. Snigirev, Time resolved X-ray imaging of dendritic growth in binary alloys, Phys. Rev. Lett. 83 (1999) 5062–5065.
doi:10.1103/PhysRevLett.83.5062.
19
Houltz, D. Voss, A. Verga, D.J. Browne, A.G. Murphy, XRMON-GF: A novel facility for solidification of metallic alloys with in situ and time-resolved X-ray radiographic
characterization in microgravity conditions, J. Cryst. Growth. 374 (2013) 23–30. doi:10.1016/j.jcrysgro.2013.03.032.
[16] G. Reinhart, C.A. Gandin, N. Mangelinck-Noël, H. Nguyen-Thi, J.E. Spinelli, J. Baruchel, B. Billia, Influence of natural convection during upward directional solidification: A comparison between in situ X-ray radiography and direct simulation of the grain structure, Acta Mater. 61 (2013) 4765–4777. doi:10.1016/j.actamat.2013.04.067.
[17] P.L. Schaffer, R.H. Mathiesen, L. Arnberg, M. Di Sabatino, A. Snigirev, In situ investigation of spinodal decomposition in hypermonotectic Al-Bi and Al-Bi-Zn alloys, New J. Phys. 10 (2008). doi:10.1088/1367-2630/10/5/053001.
[18] P.L. Schaffer, R.H. Mathiesen, L. Arnberg, L2 droplet interaction with α-Al during solidification of hypermonotectic Al-8 wt.% Bi alloys, Acta Mater. 57 (2009) 2887–2895. doi:10.1016/j.actamat.2009.02.041.
[19] G. Ran, J.E. Zhou, S. Xi, P. Li, Microstructure and morphology of Al-Pb bearing alloy synthesized by mechanical alloying and hot extrusion, J. Alloys Compd. 419 (2006) 66–70. doi:10.1016/j.jallcom.2005.09.057.
[20] J. Gröbner, R. Schmid-Fetzer, Phase transformations in ternary monotectic aluminum alloys, Jom. 57 (2005) 19–23. doi:10.1007/s11837-005-0110-5.
[21] J. Gröbner, D. Mirković, R. Schmid-Fetzer, Monotectic four-phase reaction in Al-Bi-Zn alloys, Acta Mater. 53 (2005) 3271–3280. doi:10.1016/j.actamat.2005.03.033.
[22] D. Mirković, J. Gröbner, R. Schmid-Fetzer, Solidification paths of multicomponent monotectic aluminum alloys, Acta Mater. 56 (2008) 5214–5222. doi:10.1016/j.actamat.2008.07.001. [23] L. Bo, S. Li, L. Wang, D. Wu, M. Zuo, D. Zhao, Liquid-liquid phase separation and
solidification behavior of Al 55 Bi 36 Cu 9 monotectic alloy with different cooling rates, Results Phys. 8 (2018) 1086–1091. doi:10.1016/j.rinp.2018.01.056.
[24] M.D. Abràmoff, P.J. Magalhães, S.J. Ram, Image Processing with ImageJ Second Edition, Biophotonics Int. 11 (2004) 36–42. doi:10.1017/CBO9781107415324.004.
[25] Y.Z. Li, N. Mangelinck-Noël, G. Zimmermann, L. Sturz, H. Nguyen-Thi, Comparative study of directional solidification of Al-7 wt% Si alloys in Space and on Earth: Effects of gravity on dendrite growth and Columnar-to-equiaxed transition, J. Cryst. Growth. 513 (2019) 20–29. doi:10.1016/j.jcrysgro.2019.02.050.
[26] J.D. Hunt, Cellular and primary dendrite spacings, in: Int. Conf. Solidif. Cast. Met., Metals Society, London, 1979: pp. 3–9.
[27] J.E. Spinelli, N. Cheung, A. Garcia, On array models theoretical predictions versus measurements for the growth of cells and dendrites in the transient solidification of binary alloys, Philos. Mag. 91 (2011) 1705–1723. doi:10.1080/14786435.2010.545779.
20
[28] D. Camel, M.D. Dupouy, Comparative study of the Columnar-Equiaxed Transition in
microgravity and on ground during directional solidification of a refined Al - 3.5 wt% Ni alloy, Le J. Phys. IV. 11 (2001) Pr6-119-Pr6-126. doi:10.1051/jp4:2001614.
[29] Parr et al., PREPARATION OF MONOTECTICALLOYS HAVENGA CONTROLLED MCROSTRUCTURE BY DIRECTIONAL SOLDIFICATION UNDER DOPANT-NDUCED INTERFACE BREAKDOWN, US Patent n.4198232, 1980.
[30] R.N. Grugel, T.A. Lograsso, A. Hellawell, The solidification of monotectic alloys— Microstructures and phase spacings, Metall. Mater. Trans. A. 15 (1984) 1003–1012. doi:10.1007/bf02644692.
[31] J.Z. Zhao, J. He, Z.Q. Hu, L. Ratke, Microstructure evolution in immiscible alloys during rapid directional solidification, Zeitschrift Für Met. 95 (2004) 362–368. doi:10.3139/146.017967. [32] A. Ludwig, M.H. Wu, M. Abondano, L. Ratke, Gravity-Induced Convection during Directional
Solidification of Hypermonotectic Alloys, Mater. Sci. Forum. 508 (2006) 193–198. doi:10.4028/www.scientific.net/MSF.508.193.
[33] L. Ratke, A. Müller, On the destabilisation of fibrous growth in monotectic alloys, Scr. Mater. 54 (2006) 1217–1220. doi:10.1016/j.scriptamat.2005.07.044.
[34] T. Carlberg, Å. Bergman, On the formation of irregular monotectic structures, Scr. Metall. 19 (1985) 333–336. doi:10.1016/0036-9748(85)90325-4.
[35] B. Derby, J.J. Favier, A criterion for the determination of monotectic structure, Acta Metall. 31 (1983) 1123–1130. doi:10.1016/0001-6160(83)90208-0.
[36] J.J. SEN YANG, WENJIN LIU, Effects of transverse magnetic field during directional solidification of monotectic Al-6.5wt%Bi alloy, J. Mater. Sci. 36 (2001) 5351–5355. doi:10.1023/A:1012467817033.
[37] A.P. Silva, J.E. Spinelli, A. Garcia, Microstructural evolution during upward and downward transient directional solidification of hypomonotectic and monotectic Al-Bi alloys, J. Alloys Compd. 480 (2009) 485–493. doi:10.1016/j.jallcom.2009.01.105.
[38] D. Kurz, W and Fisher, Fundamentals of Solidification, 4th ed., Trans. Tech. Publications Ltd, 1998.
[39] R. Trivedi, Interdendritic Spacing: Part II. A Comparison of Theory and Experiment, Metall. Mater. Trans. A. 15 (1984) 977–982. doi:10.1007/BF02644689.
[40] J. Z. Zhao et al., Microstructure evolution in immiscible alloys during rapid directional solidification, Z. Metallkd. 95 (2004) 362-368.
[41] R. V. Reyes, V.E. Pinotti, C.R.M. Afonso, L.C. Casteletti, A. Garcia, J.E. Spinelli, Processing, As-Cast Microstructure and Wear Characteristics of a Monotectic Al-Bi-Cu Alloy, J. Mater. Eng. Perform. 28 (2019) 1201–1212. doi:10.1007/s11665-018-3851-3.
21
2016.
List of Figure Captions
Figure 1. (a) Equilibrium phase fractions of the Al-3.2wt.%Bi-3wt.%Cu alloy as a function of the temperature, computed using TCAL5 database of the Thermo-Calc software and (b) detailed view of the same plot for mass fractions lower than < 0.06.
Figure 2. Typical X-ray radiographs of the Al-3.2wt.%Bi-3.0wt.%Cu alloy solidification under a cooling rate of 0.025 K/s and an applied temperature gradient of 7.5 K/mm: (a) growing α-Al dendrites at t = 33 s after the start of cooling down (t); (b) Bi droplets dispersed within the α-Al at t = 231 s and (c) tracking of the solidification front based on three lines along the field of view (F1, F2, F3).
Figure 3. Experimental plots of velocity profiles with time measured across the FOV of the Al-3.2 wt.%Bi-3 wt.%Cu alloy cooled at rates of 0.5 K/s and 1.0 K/s (i.e. intermediate and fast regimes, respectively).
Figure 4. Velocity profiles measured for the slow-cooling rate solidification with Al-3.2 wt.%Bi-3wt.%Cu alloy samples: (a) general view and (b) zoom for t < 600 s highlighting the reversal of the velocity trend for both 0.01 K/s and 0.025 K/s experiments.
Figure 5. Radiography images recorded in the first stages of growth for samples cooled at rates of (a) 0.01 K/s and (b) 1.0 K/s.
Figure 6. G-V diagram with the indications of D - dendritic morphology and C- cellular morphology of the α-Al based from in situ observation of the solidification of the Al-3.2wt.%Bi-3wt.%Cu alloy. Figure 7. SEM-EDS composition measurements and typical SEM images along the FOV in the sample solidified at 0.01 K/s (axial solute contents for Cu and Bi). The images and compositions are related to the positions (a) 1 mm; (b) 2 mm; (c) 3 mm and (d) 4 mm from the bottom of the FOV. Figure 8. Sequence of radiographs recorded during directional solidification of the Al-3.2wt.%Bi-3.0wt.%Cu alloy for a cooling rate of 0.01 K/s applied on both heaters showing the occurrence of a dendritic-to-cellular transition: (a) dendritic microstructure (t = 188.5 s; V = 3.8 µm/s and G = 2.7 K/mm); (b) transition step (t = 484.0 s; V = 3.1 µm/s and G = 2.5 K/mm) and (c) cellular microstructure (t = 753.5 s; V = 2.2 µm/s and G = 4.2 K/mm).
Figure 9. (a) Experimental variations of liquid Bi droplet size as a function of temperature during quasi-steady-state growth and (b) comparative plots of the Bi droplet diameters for both unsteady-state and quasi-steady-state regimes for the Al-3.2wt.%Bi-3wt.%Cu alloy at different cooling rates.
Figure 10. Mechanism of morphological transition and of Bi droplet nucleation in Al-3.2wt.%Bi-3wt.%Cu alloy. a) Dendritic growth, b) Nucleation of first Bi droplets, c) Transition from dendritic to cellular growth, d) Cellular growth and continuous Bi droplet formation, e) Cellular growth and Bi droplet rearrangement, f) Schematic showing the evolution of the dendritic front velocity.