HAL Id: hal-00296820
https://hal.archives-ouvertes.fr/hal-00296820
Submitted on 22 Feb 2005
HAL is a multi-disciplinary open access
archive for the deposit and dissemination of
sci-entific research documents, whether they are
pub-lished or not. The documents may come from
teaching and research institutions in France or
abroad, or from public or private research centers.
L’archive ouverte pluridisciplinaire HAL, est
destinée au dépôt et à la diffusion de documents
scientifiques de niveau recherche, publiés ou non,
émanant des établissements d’enseignement et de
recherche français ou étrangers, des laboratoires
publics ou privés.
Rainfall triggering soil slips in the southern Apuan Alps
(Tuscany, Italy)
R. Giannecchini
To cite this version:
R. Giannecchini. Rainfall triggering soil slips in the southern Apuan Alps (Tuscany, Italy). Advances
in Geosciences, European Geosciences Union, 2005, 2, pp.21-24. �hal-00296820�
Advances in Geosciences (2005) 2: 21–24 SRef-ID: 1680-7359/adgeo/2005-2-21 European Geosciences Union
© 2005 Author(s). This work is licensed under a Creative Commons License.
Advances in
Geosciences
Rainfall triggering soil slips in the southern Apuan Alps
(Tuscany, Italy)
R. Giannecchini
Dipartimento di Scienze della Terra, Universit`a di Pisa, Italy
Received: 24 October 2004 – Revised: 27 January 2005 – Accepted: 28 January 2005 – Published: 22 February 2005
Abstract. The Apuan Alps are characterized by frequent
heavy rainfall. In several cases this triggered many shal-low landslides (soil slips). With the aim of contributing to the landslide hazard evaluation of the southern Apuan Alps (upper Versilian area), a detailed analysis of the main plu-viometric events was carried out. Data recorded at the main raingauge of the area from 1975 to 2002 were analysed and compared with the occurrence of soil slips, in order to exam-ine the relationship between soil slip initiation and rainfall. Some thresholds for soil slip-debris flow activity in terms of mean intensity, duration and mean annual precipitation (MAP) were defined for the study area.
1 Introduction
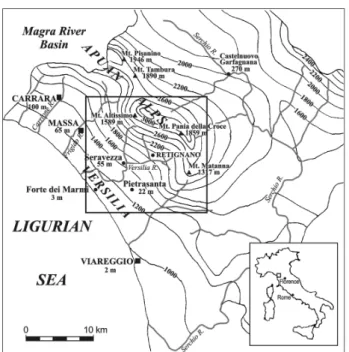
Due to its geographical position and conformation (Fig. 1), the Apuan Alps region is one of the rainiest in Italy (more than 3000 mm/year) and is frequently hit by severe rain-storms. In many cases, the storms triggered shallow land-slides (soil slips), which exposed the population to serious risks. The 19 June 1996 catastrophe triggered about 1000 soil slips, flows and floods in the Versilia plain and caused 14 deaths (D’Amato Avanzi et al., 2004).
Besides the high frequency of strong rainfall events, the Apuan-Versilian territory is characterized by high vulnera-bility. This is increased by tourist pressure in the area and the marble working. Therefore, it is extremely important for the local municipal administrations and civil protection agen-cies to have efficient emergency plans, in order to evacuate the population in time.
A detailed analysis of the main pluviometric events was carried out with the aim of contributing to the landslide haz-ard evaluation of the southern Apuan Alps. Data recorded at the raingauge of the area from 1975 to 2002 were analysed and compared with the occurrence of the shallow landslides.
Correspondence to: R. Giannecchini
(rgiannecchini@dst.unipi.it)
In this way it was possible to examine the relationship be-tween soil slip initiation and rainfall.
2 Critical rainfall in the southern Apuan Alps
The concept of pluviometric threshold was introduced by Campbell (1975) and theorized by Starkel (1979) as a dura-tion/intensity relationship. Many attempts, generally defined on the basis of an empirical approach, have been made to determine the minimum rain height or intensity required for triggering landslides (e.g. Caine, 1980; Fukuoka, 1980; Govi and Sorzana, 1980; Cancelli and Nova, 1985; Crozier, 1986; Cannon and Ellen, 1988; Jibson, 1989; Au, 1998; Crosta, 1998; Au, 1998; etc.).
In the southern Apuan area, the most important prob-lems regarding slope stability result from the shallow land-slides. They are triggered by very intense rainstorms (about 325 mm/4 hr with maximum intensity of 158 mm/hr during the June 1996 event). However, less intense but prolonged rainfall sometimes is sufficient to induce the failures. For example, on 6 November 2000 shallow landslides were trig-gered by 160 mm/13 hr (max intensity 30 mm/hr). In this case, a large antecedent rainfall amount was available (al-most 600 mm within one month) and it drastically reduced the critical threshold.
2.1 Work methodology
With the aim of identifying the critical rainfall thresholds for soil slips, all the main rainfall events occurred in the south-ern Apuan area in the 1975–2002 period were analysed. The Retignano raingauge was taken as a reference (440 m a.s.l. – Fig. 1), because it was the only station equipped with pluvio-graphic instrument from 1975 to 1996, while it became an electronic raingauge from 1996 onwards.
22 R. Giannecchini: Rainfall triggering soil slips
2 A detailed analysis of the main pluviometric events was carried out with the aim of contributing to the landslide hazard evaluation of the southern Apuan Alps. Data recorded at the raingauge of the area from 1975 to 2002 were analysed and compared with the occurrence of the shallow landslides. In this way it was possible to examine the relationship between soil slip initiation and rainfall.
Figure 1. Location and isohyet map of the study area.
2 Critical rainfall in the southern Apuan Alps
The concept of pluviometric threshold was introduced by Campbell (1975) and theorized by Starkel (1979) as a duration/intensity relationship. Many attempts, generally defined on the basis of an empirical approach, have been made to determine the minimum rain height or intensity required for triggering landslides (e.g. Caine, 1980; Fukuoka, 1980; Govi & Sorzana, 1980; Cancelli & Nova, 1985; Crozier, 1986; Cannon & Ellen, 1988; Jibson, 1989; Au, 1998; Crosta, 1998; Au, 1998; etc.).
Fig. 1. Location and isohyet map of the study area.
The research identified 152 significant rainfall events; for all the events collected, a research was carried out into the effects produced. This was done by means of verification of local Municipal Administrations, newspapers, and on the ba-sis of the eye witness evidence. Among these events, at least 12 rainstorms triggered several soil slips. For each event analyzed, the following parameters were collected: rain-fall amount (mm), duration (hours), mean intensity (mm/hr), mean annual precipitation (MAP-mm).
The 152 events investigated were subdivided into three groups on the basis of the extents of the effects caused by the rainstorms: events that induced several shallow land-slides and floods (events A in the following graphs); events that locally induced some shallow landslides and small floods (events B); no information about the effects induced (events C). For the first group the information on the effects pro-duced were very clear: many landslides and floods and, in some cases, also deaths (8 June 1984 [2 deaths], 11 July 1992 [2 deaths], 22 August 1992 [1 death], 6 November 1994, 19 June 1996 [14 deaths] and 6 November 2000). Nevertheless, the 1984 event was anomalous considering the data of the Retignano station. In fact, numerous soil slips were triggered by the rainstorm in a zone 6–7 km far from the raingauge. The instrument recorded only 26.0 mm in 4.5 h, which leads us to presume that Retignano station was not probably suit-able to describe the event correctly or it was out of order. Unfortunately, extremely concentrated and localized events are typical of the area. As a consequence, the 1984 event was indicated in the graphs, but was not considered in the definition of the threshold curves.
Table 1. Distribution of the events (A, B, C) in each defined stability field.
Stability field Intermediate Instability field
A event (%) 0 20.0 80.0
B event (%) 0 100.0 0
C event (%) 59.5 39.8 0.7
2.2 Duration/intensity curves
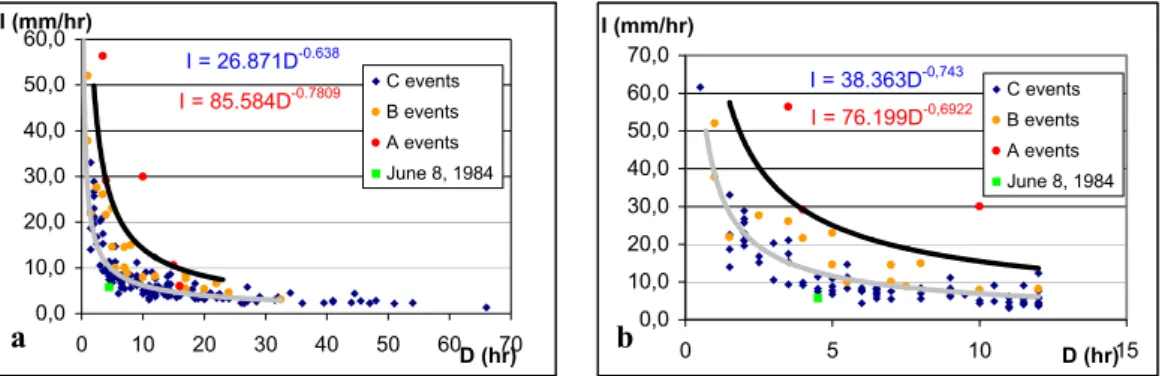
A significant result emerged from the duration/intensity re-lationship (Fig. 2). Separating events that triggered sev-eral soil slips (events A), events which triggered a few soil slips (events B) and events that did not cause significant ef-fects (events C), two curves (threshold curves) are recognis-able (Fig. 2a): a lower one (I=26.871 D−0.638)and an upper curve (I=85.584 D−0.7809). The curves are sufficiently def-inite for D≤30–35 h and I≤40–50 mm/hr (lower curve) and for D≤20–25 h and intensity I≤50–60 mm/hr (upper curve). The exponential curves are individuated on the basis of an empirical approach.
Considering only the events with D≤12 hr (Fig. 2b), typi-cal of the area, the curve equations become I=38.363 D−0.743 (lower curve) and I=76.199 D−0.6922(upper curve), respec-tively.
In the definition of the threshold curves there are some ex-ceptions: for example, events A in the field fell between the two curves, and so on. This is perhaps due to the utilization of only one station.
With regard to the Fig. 2a and excluding the June 1984 event, the probability that each kind of event (A, B, C) falls in each defined stability region could be estimated (Table 1). In particular, good results are obtained for A and B events, while a more significant error concerns C events (39.8% falls in the intermediate field).
2.3 Normalization
Several Authors (e.g. Govi and Sorzana, 1980; Cannon and Ellen, 1988) asserted that each area is in equilibrium with its usual climatic and pluviometric conditions, and related the rainfall events with the mean annual precipitation (MAP), in order to normalize the rainfall data.
For the Apuan area, the results of this normaliza-tion were very interesting. Introducing the parameter NSR (Normalized Storm Rainfall – Corominas, 2001), namely the rainfall event/PMA ratio, the relationship inten-sity/NSR (Fig. 3a) and duration/NSR (Fig. 3b) were anal-ysed. Also in these graphs two threshold curves are rec-ognizable (on the basis of an empirical approach), with a good approximation. In the first case (Fig. 3a) the equations are I=−1.4916 ln(NSR)+6.5471 (lower curve) and I=−1.4812 ln(NSR)+14.183 (upper curve), respectively. In the second graph (Fig. 3b), the equations are D=0.1974
R. Giannecchini: Rainfall triggering soil slips 23
4
As a consequence, the 1984 event was indicated in the graphs, but was not considered in the
definition of the threshold curves.
2.2 Duration/intensity
curves
A significant result emerged from the duration/intensity relationship (Fig. 2). Separating
events that triggered several soil slips (events A), events which triggered a few soil slips
(events B) and events that did not cause significant effects (events C), two curves (threshold
curves) are recognisable (Fig. 2a): a lower one (I = 26.871 D
-0.638) and an upper curve (I =
85.584 D
-0.7809). The curves are sufficiently definite for D
≤
30-35 hours and I
≤
40-50 mm/hr
(lower curve) and for D
≤
20-25 hours and intensity I
≤
50-60 mm/hr (upper curve). The
exponential curves are individuated on the basis of an empirical approach.
Considering only the events with D
≤
12 hr (Fig. 2b), typical of the area, the curve equations
become I = 38.363 D
-0.743(lower curve) and I = 76.199 D
-0.6922(upper curve), respectively.
In the definition of the threshold curves there are some exceptions: for example, events A in
the field fell between the two curves, and so on. This is perhaps due to the utilization of only
one station.
I = 26.871D-0.638 I = 85.584D-0.7809 0,0 10,0 20,0 30,0 40,0 50,0 60,0 0 10 20 30 40 50 60D (hr)70 I (mm/hr) C events B events A events June 8, 1984 I = 76.199D-0,6922 I = 38.363D-0,743 0,0 10,0 20,0 30,0 40,0 50,0 60,0 70,0 0 5 10 D (hr)15 I (mm/hr) C events B events A events June 8, 1984Figure 2.
Duration/intensity relationship for all the 152 events recorded (a) and for events with
D
≤
12 hr (b). A lower threshold curve (grey) and an upper one (black) are recognizable. (A:
events that induced several soil slips and floods; B: events that locally induced some soil slips
and small floods; C: no information about effects induced).
a b
Fig. 2. Duration/intensity relationship for all the 152 events recorded (a) and for events with D≤12 hr (b). A lower threshold curve (grey) and an upper one (black) are recognizable. (A: events that induced several soil slips and floods; B: events that locally induced some soil slips and small floods; C: no information about effects induced).
6
NSR = -1.4916Ln(I) + 6.5471 NSR = -2.4812Ln(I) + 14.183 0,0 2,0 4,0 6,0 8,0 10,0 12,0 14,0 16,0 18,0 1 10 I (mm/hr) 100 NSR (%) C events B events A events June 8, 1984 NSR = 0.1974D + 1.0711 NSR = 0.2032D + 5.1198 0,0 2,0 4,0 6,0 8,0 10,0 12,0 14,0 16,0 18,0 0 20 40 60D (hr) 80 NSR (%) C events B events A events June 8, 1984Figure 3.
Semi-logarithmic intensity/NSR relationship (a) and duration/NSR relationship (b)
for all the 152 events recorded. A lower threshold curve (grey) and an upper one (black) are
recognizable. (A: events that induced many soil slips and floods; B: events that locally
induced some soil slips and small floods; C: no information about effects induced).
In Figs. 2 and 3, the two curves could delimit, with a good approximation, three fields of
stability: stability (below the lower curve), uncertain stability (between the two curves),
instability (above the upper curve).
3 Conclusions
In the Apuan Alps, a region particularly hit by severe rainstorms and characterized by a high
vulnerability, the knowledge of the minimum rainfall amount for soil slip initiation is very
important. With this aim, a detailed analysis of the pluviometric events was carried out. The
data recorded from 1975 to 2002 were analysed and compared with the occurrence of soil
slips.
Due to the lack of a close pluviometric network in the study area, the rainfall data used to
obtain critical thresholds must be considered with caution (the 1984 event is a meaningful
example). However, very significant results emerged from the duration/intensity,
intensity/NSR and duration/NSR relationships, always identifying two threshold curves,
which could separate field with different degrees of stability.
The research is still in progress. Further studies will be carried out to obtain more information
on the role of the antecedent rainfall in the shallow landslide initiation. At present, two
a b
Fig. 3. Semi-logarithmic intensity/NSR relationship (a) and duration/NSR relationship (b) for all the 152 events recorded. A lower threshold curve (grey) and an upper one (black) are recognizable. (A: events that induced many soil slips and floods; B: events that locally induced some soil slips and small floods; C: no information about effects induced).
NSR+1.0711 (lower curve) and D=0.2032 NSR+5.1198 (up-per curve), respectively.
In Figs. 2 and 3, the two curves could delimit, with a good approximation, three fields of stability: stability (below the lower curve), uncertain stability (between the two curves), instability (above the upper curve).
3 Conclusions
In the Apuan Alps, a region particularly hit by severe rain-storms and characterized by a high vulnerability, the knowl-edge of the minimum rainfall amount for soil slip initiation is very important. With this aim, a detailed analysis of the pluviometric events was carried out. The data recorded from 1975 to 2002 were analysed and compared with the occur-rence of soil slips.
Due to the lack of a close pluviometric network in the study area, the rainfall data used to obtain critical thresholds must be considered with caution (the 1984 event is a mean-ingful example). However, very significant results emerged from the duration/intensity, intensity/NSR and duration/NSR relationships, always identifying two threshold curves, which could separate field with different degrees of stability.
The research is still in progress. Further studies will be carried out to obtain more information on the role of the antecedent rainfall in the shallow landslide initiation. At present, two monitoring stations, equipped with pluviome-ters and piezomepluviome-ters, have been set up to verify and improve the threshold found.
Edited by: L. Ferraris
Reviewed by: J. J. Egozcue and another referee
References
Au, S. W. C.: Rain-induced slope instability in Hong Kong, Engi-neering Geology, 51, 1–36, 1998.
Caine, N.: The rainfall intensity-duration control of shallow land-slides and debris flows, Geografiska Annaler, 62A, 23–27, 1980. Campbell, R. H.: Soil slips, debris flows and rainstorms in the Santa Monica Mountains and vicinity, Southern California, U.S. Geo-logical Survey Professional Paper 851, 51 pp, 1975.
Cancelli, A. and Nova, R.: Landslides in soil and debris cover trig-gered by rainfall in Valtellina (Central Alps-Italy), Proc. 4th Int. Conf. & Field Workshop on Landslides, Tokyo, 267–272, 1985. Cannon, S. H. and Ellen, S. D.: Rainfall that resulted in abundant
debris flows activity during the storm, Landslides, floods, and marine effects of the storm of January 3–5, 1982, in the S. Fran-cisco Bay Region, California, in: U.S. Geological Survey
Profes-24 R. Giannecchini: Rainfall triggering soil slips
sional Paper, edited by: Ellen, S. D. and Wieczorek G. F., 1434, 27–33, 1988.
Corominas, J.: Landslides and climate, Keynote lecture, 8th Int. Symp. on Landslides, Cardiff, Galles, 4, 1–33, 2001.
Crosta, G.: Regionalization of rainfall thresholds: an aid to land-slide hazard evaluation, Environmental Geology, 35 (2-3), 131– 145, 1998.
Crozier, M. J.: Landslides: causes, consequences and environment, Routledge, 252 pp, 1986.
D’Amato Avanzi, G., Giannecchini, R., and Puccinelli, A.: The in-fluence of the geological and geomorphological settings on shal-low landslides, An example in a temperate climate environment: the June 19, 1996 event in north-western Tuscany (Italy), Engi-neering Geology, 73 (3-4), 215–228, 2004.
Fukuoka, M.: Landslides associated with rainfall, Geotechnical En-gineering, 11, 1–29, 1980.
Govi, M. and Sorzana, P. F.: Landslide susceptibility as function of critical rainfall amount in Piedmont basin (North-Western Italy), Studia Geomorphologica Carpatho-Balcanica, 14, 43–60, 1980. Jibson, R. W.: Debris flows in Southern Puerto Rico, Geol. Soc. of
America, 236, 29–55, 1989.
Starkel, L.: The role of extreme meteorological events in the shap-ing of mountain relief, Geographica Polonica, 41, 13–20, 1979.