HAL Id: hal-00317130
https://hal.archives-ouvertes.fr/hal-00317130
Submitted on 1 Jan 2002
HAL is a multi-disciplinary open access
archive for the deposit and dissemination of
sci-entific research documents, whether they are
pub-lished or not. The documents may come from
teaching and research institutions in France or
abroad, or from public or private research centers.
L’archive ouverte pluridisciplinaire HAL, est
destinée au dépôt et à la diffusion de documents
scientifiques de niveau recherche, publiés ou non,
émanant des établissements d’enseignement et de
recherche français ou étrangers, des laboratoires
publics ou privés.
the IRIS, DASI and EISCAT systems
C. F. del Pozo, F. Honary, N. Stamatiou, M. J. Kosch
To cite this version:
C. F. del Pozo, F. Honary, N. Stamatiou, M. J. Kosch. Study of auroral forms and electron
precipita-tion with the IRIS, DASI and EISCAT systems. Annales Geophysicae, European Geosciences Union,
2002, 20 (9), pp.1361-1375. �hal-00317130�
Annales
Geophysicae
Study of auroral forms and electron precipitation with the IRIS,
DASI and EISCAT systems
C. F. del Pozo, F. Honary, N. Stamatiou, and M. J. Kosch
Department of Communication Systems, Lancaster University, Lancaster LA1 4YR, UK Received: 22 February 2002 – Revised: 14 July 2002 – Accepted: 21 August 2002
Abstract. Simultaneous observations with the IRIS, DASI
and EISCAT systems are employed in the study of the spa-tial distribution and temporal evolution of auroral forms and precipitation regions during substorm activity. The evolu-tion of the spectrum of precipitating electrons above Tromsø during the various phases of substorms is discussed. The flux-energy spectrum in the 1–320 keV range is derived from EISCAT electron density profiles in the 70–140 km altitude range. At the late growth phase the precipitation flux at the higher energies increases faster than at the lower ener-gies. The flux is always greater in the lower energy side of the spectrum and reaches a maximum a few minutes af-ter substorm onset, then it decays while the spectrum nar-rows. The systematic analysis of 2-D structures correspond-ing with well-defined optical and absorption features is also discussed. The orientation, characteristic lengths (elongation and width) and the gravity centre of these spatial features are determined. The statistical analysis of centre position and the sizes of the corresponding signatures is presented. When substorm onset falls within the common field of view, there is a close correspondence between the optical and the absorp-tion signatures of the auroral forms, as well as in their over-all north-south motion characteristic of the various phases of the substorm. Optical signatures of arcs are more evenly distributed in space, being narrower and elongated along the L-shells, while the absorption regions appear more structured and patchy, although generally following the arcs’ shape and alignment. Cross-correlation of the time series of maximum absorption and maximum green-line emission is very high and seems to show a systematic delay of absorption relative to optical emission. Time delays are generally larger for dis-turbed conditions (40 to 60 s) than for moderately active con-ditions (10 to 20 s).
Key words. Interplanetary physics (energetic particles) –
Ionosphere (auroral ionosphere; ionosphere–magnetosphere
Correspondence to: C. F. del Pozo
interactions)
1 Introduction
This paper presents the analysis of spatially distributed 2-D data arrays from IRIS and DASI systems as functions of time, from simultaneous observations during magnetic substorm conditions. We also ran the EISCAT radar system during the same periods, pointing at a fixed position along the magnetic field line at Tromsø. The paper discusses three main topics concerning the effects of substorm activity in the common field of view of the various instruments: (1) the evolution of the energy spectrum of the precipitating electrons at Tromsø, (2) the correspondence of auroral forms and arcs as seen by the IRIS and DASI systems and implications on the struc-ture and extent of the corresponding ionisation distributions in the D- and E-regions, and (3) the statistics of the sizes and shapes of the absorption patches and the corresponding op-tical signatures (at 557.7 nm), as well as their distributions with time.
IRIS (Imaging Riometer for Ionospheric Studies), at 69.05 N, 20.8 E, records the absorption of cosmic noise at 38.2 MHz as measured by 49 beams (Browne et al., 1995). The bulk of the absorption corresponds to ionisation by elec-trons with energies in the 10 to a few 100 keV range and deposition heights centred at ∼ 90 km. IRIS gives a pic-ture of the horizontal extent of the ionisation with a time resolution of 1 s, and the motion of the ionisation region can be calculated from its change in position in consecutive times. IRIS has a resolution of about 15◦corresponding to its 8 × 8 pixels. DASI (Digital All Sky Imager, Kosch et al., 1998), at 69.35 N, 20.36 E, measures the 557.7 nm (green-line) auroral emission at a 10 s resolution. The zenith an-gle of the original all-sky images is converted to north-south horizontal distance from vertical (at Skibotn, near Tromsø), with a spatial resolution of 10 × 10 km, although the absolute resolution is 0.1◦ in zenith angle. All-sky cameras record the light emission from the excitation of neutral gases and
ions by precipitating electrons with energies between 100 eV and a few keV. The bulk of the emission is from the altitude range 100–120 km. EISCAT (European Incoherent Scatter facility at 933 MHz, Rishbeth and Williams, 1985) is a tri-static system with fully steerable antennas 32-m in diame-ter at Tromsø (69.6 N, 19.2 E), Kiruna (67.9 N, 20.4 E) and Sodankyl¨a (67.4 N, 26.7 E). It measures the height profiles of various ionospheric parameters and the electric field. It also allows for the estimation of the particle precipitation en-ergy spectrum (del Pozo et al., 1997, 1999) and the height and width of the absorption layer above Tromsø.
Energetic particles produce ionisation at low altitudes (D-and E-regions) (D-and act as tracers of the magnetospheric pro-cesses responsible for the precipitation. The systematic anal-ysis of these data arrays allows, for instance, the identifica-tion and follow-up of localised ionisaidentifica-tion regions defined by closed contours of either constant absorption or 557.7 nm in-tensity. The characteristic lengths (i.e. elongation and width) and symmetry axis of these spatial features are then deter-mined. Since most of the absorption recorded by IRIS is concentrated in a relatively narrow altitude range, the 2-D distributions give a relatively good representation of the sizes and shapes of the enhanced ionisation regions (Collis et al., 1996; Hargreaves et al., 1997). The necessary condition is that the ionisation region is of at least the same cross sec-tion as the observing IRIS beams. Assuming the absorpsec-tion occurs at 90 km, the IRIS beam at the zenith has a resolu-tion of ∼20 km to the 3-dB points. Most of the beams will record at least 90% of the true absorption from a latitudinally confined strip of absorption with a Gaussian cross section of
≥25 km across, which corresponds to a full-width of 60 km to the 3-dB points at 90 km altitude.
The absorption measured by the riometers is in fact a rela-tive value and it may be affected by contamination from man-made interference, from scintillations, and by inaccurate cos-mic noise reference levels. Scintillations are large amplitude and relatively high frequency oscillations, due to discrete ra-dio sources in the sky, which, in our case, is basically due to the stars Cassiopeia, and to a lesser extent Cygnus, it af-fects a few and the same beam directions at different times. They can be smoothed out, if not completely removed, by the application of a sliding mean filter on the affected records (typically the window size at 10 s resolution is 5 min). Quiet-day curves are an indication of the noise-level IRIS would be expected to measure on a day without any absorption, scin-tillation or interference. In our analysis they are generated for a given period (usually 14 days at 1 s resolution) based upon the sidereal time. We take the median of a sample and its adjacent 598 neighbours, then we sort the data for each instance and discard the largest value, as it may be corrupted by interference (e.g. lightning, solar radio emissions) or scin-tillation. We then take the mean of the next two largest val-ues and repeat the procedure for each sidereal time and every beam. Finally, the QDC is smoothed with a sliding mean fil-ter with a window size of 599 s. The basis of the algorithm is to find the largest value received (excluding interference) for any time in the sidereal day.
In the case of the DASI images, on the other hand, there is an ambiguity in the extent of the optical signatures per-pendicular to the L-shells. An additional problem is the ef-fect from clouds on the optical images, but this is avoided by the consideration of data from clear sky conditions alone. Most of the optical emissions come from the 100–120 km al-titude range (Egeland and Omholt, 1967), but weaker emis-sions from all heights may also be recorded by the all-sky cameras. Auroral forms associated with ionisation in this al-titude range are in fact the bottom cross sections of luminous curtains and the trace of the L-shells guiding the precipitat-ing particles (Carlson and Egeland, 1995). The lower edge of these curtains is located at 100–105 km and is defined by the quenching of the green-line emission by strong collisions with the neutral atmosphere. When an auroral curtain is not at the magnetic zenith of the camera location, both the bot-tom and the curtain surface are seen. In this case, the paral-lel rays from several hundred km appear to converge toward the bottom edge, resulting in a fan-shaped display called the corona. It is this corona effect which may produce a spurious broadening of the arc-like features.
2 Observations of substorm activity
The experiments consist of the simultaneous observation of substorm activity and auroral arcs employing IRIS, DASI and EISCAT systems. Interplanetary magnetic field data from WIND and ACE satellites were applied to identify the intervals of substorm activity associated with IMF Bz < 0 and to estimate the time delay for the disturbances to reach Earth. Magnetic field data and pi2 pulsations at the ground were provided by the IMAGE and SAMNET magnetometer chains. Pi2 pulsations occur simultaneously with substorm expansion phase onset and subsequent intensifications (see, for instance, Lester et al., 1983; Elphinstone et al., 1995; Bradshaw and Lester, 1997; and references therein). The latitudinal positions and times of the substorm onsets and intensifications can be determined using pi2 pulsations, the decrease in the X component of the magnetic field, the ex-plosive growth of the 557.7 nm emission intensity (Voronkov et al., 1999) and the hardening of the precipitation spectrum which produces a sharp increase in auroral absorption (Har-greaves et al., 1975, 1997).
We have looked at several substorm events in both the evening and the post-midnight sectors during two periods of observations on (a) 13–14 February 1996 and (b) 09 Novem-ber 1998. Discrete auroral forms associated with these events can be roughly classified as quiet arcs for period (a) and dis-turbed arc structures for period (b). A quiet arc is typically characterized as a longitudinally uniform, narrow band of green-line emissions associated with a uniform sheet of up-ward field-aligned current (de la Beaujardiere et al., 1977). The disturbed arcs consist of small-scale distortions or spirals with a typical diameter of the order of 100 km and counter-clockwise rotational sense (Haerendel et al., 1996; Johnson et al., 1998).
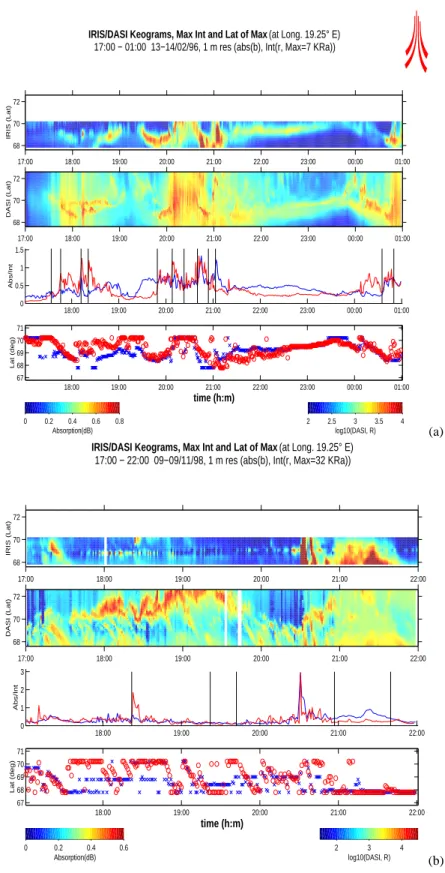
IRIS/DASI Keograms, Max Int and Lat of Max (at Long. 19.25° E) 17:00 − 01:00 13−14/02/96, 1 m res (abs(b), Int(r, Max=7 KRa))
IRIS (Lat) 17:00 18:00 19:00 20:00 21:00 22:00 23:00 00:00 01:00 68 70 72 0 0.2 0.4 0.6 0.8 Absorption(dB) DASI (Lat) 17:00 18:00 19:00 20:00 21:00 22:00 23:00 00:00 01:00 68 70 72 2 2.5 3 3.5 4 log10(DASI, R) Abs/Int 18:00 19:00 20:00 21:00 22:00 23:00 00:00 01:00 0 0.5 1 1.5 18:00 19:00 20:00 21:00 22:00 23:00 00:00 01:00 67 68 69 70 71 Lat (deg) time (h:m) (a)
IRIS/DASI Keograms, Max Int and Lat of Max (at Long. 19.25° E)
17:00 − 22:00 09−09/11/98, 1 m res (abs(b), Int(r, Max=32 KRa))
IRIS (Lat) 17:00 18:00 19:00 20:00 21:00 22:00 68 70 72 0 0.2 0.4 0.6 Absorption(dB) DASI (Lat) 17:00 18:00 19:00 20:00 21:00 22:00 68 70 72 2 3 4 log10(DASI, R) Abs/Int 18:00 19:00 20:00 21:00 22:00 0 1 2 3 18:00 19:00 20:00 21:00 22:00 67 68 69 70 71 Lat (deg) time (h:m) (b)
Fig. 1. Composite plots for observation periods (a) 17:00–01:00 UT, 13–14 February 1996, and (b) 17:00–22:01 UT, 09 November 1998.
The time resolution in all cases is 1 min. In all cases, we display together the keograms at 19.25◦lon. (Tromsø) from IRIS absorption (top panel) and from the DASI green-line emission (second from top) for the respective fields of view of the instruments. The intensities and latitude of maximum absorption (blue) and maximum luminosity (red, normalised to the absorption) in the common field of view are shown in the third panel from the top, and in the bottom panel, respectively. Colour bars at the foot of the figure give the scales of absorption in dB and light emission in kR.
13–14 February 1996. The IMF Bz component was di-rected southwards from 16:00 to 17:15 UT and from 18:30 to 20:00 UT on 13 February, and from 23:00 UT on 13 February to 01:30 UT on 14 February. The satellite was at ∼ 173RE from the Earth’s centre and the average solar wind veloc-ity at this position was ∼ 500 km/s, which gives roughly a time delay of ∼ 40 min for the disturbance to reach Earth. Magnetic activity was moderately disturbed with Kpvalues between 2+ and 4− and a day-average of 3− in 13 Febru-ary 1996. The first substorm was associated with successive Pi2 bursts at 17:34 UT, 17:46 UT, 18:12 UT, and 18:21 UT on 13 February. A second substorm expansion started at 19:49 UT, corresponding to a burst of pi2 activity. This ex-pansion phase continued with repeated onsets marked by pi2 bursts at 20:08, 20:23, 20:38, 20:54 and 21:03 UT, each new onset being accompanied by an intensification of the mag-netic bay in at least some of the IMAGE stations. The bay observed at Tromsø at 20:35 UT was the most intense and at the same time the Z component switched abruptly between a minimum and a maximum value, suggesting the passage of a filamentary westward electrojet disturbance right overhead. A third substorm, largely outside the common observing pe-riod of the various instruments, may have started at 23:48 UT when it was signalled by a very minor Pi2 burst, and then associated with multiple onsets at 00:35 UT, 00:54 UT, and 01:18 UT.
09 November 1998. Strong substorm activity during this
pe-riod corresponded to the end of a magnetic storm charac-terized by the negative IMF Bz component between 03:00 and 23:00 UT. The satellite was at ∼ 208 REfrom the Earth’s centre and the average solar wind velocity at this position was
∼440 km/s, which gives roughly a time delay of ∼ 50 min for the disturbance to reach Earth. The Kp day-average for 9 November 1998 is 6−, with Kp values in the 15:00– 22:00 UT period between 4+ and 6+. Three partly overlap-ping substorm events appear to be associated with distinc-tive bursts of pi2 activity in the SAMNET data at 17:00– 18:00 UT (1), 18:20–19:35 UT (2), and 20:20–21:25 UT (3). Corresponding major bays in the X-component of IMAGE magnetic data are seen at 17:25 UT and 20:32 UT south of the IRIS field of view (near the latitude of Kiruna in both cases), and at 18:20 UT within the common field of view, slightly south of Tromsø. Other minor magnetic bays are also seen at 17:00 UT, at 19:00 UT, and at 20:10 ˙UT and 21:25 UT.
Figure 1 shows the composite plots for observation peri-ods (a) 13–14 February 1996 at 17:00–01:00 UT, and (b) 09 November 1998 at 17:00–22:01 UT. It displays together the keograms at 19.25◦lon. from IRIS absorption (top panel) and from the DASI 557.7 nm emission (second from top) for the respective fields of view of the instruments. The maxi-mum values and the corresponding latitudes for the absorp-tion and the luminosity, normalised to the absorpabsorp-tion, in the common field of view, are shown in the third and fourth pan-els, respectively. The colour scales for the absorption (in dB) and light emission in log (rayleighs) are shown on the foot of the figure.
The maximum light intensity at the longitude of Tromsø
was 7 kR in period (a), and 32 kR in period (b). A major difference between these two periods is that whereas the 9 November 1998 was a highly disturbed period, stronger au-roral activity took place mostly outside the IRIS field of view. During 13 February 1996, substorm activity was most of the time within the IRIS field of view. We can see, for instance, that outside the few intervals when the strong substorm ac-tivity reached further south, the absorption values are consis-tently lower in period (b) than in period (a). Notice the trace of scintillations on the absorption in period (b), around 69◦ latitude, during interval 17:40–19:20 UT. Scintillation effects are not completely removed by the filtering algorithm, but its relative importance is significant only when the background absorption is very low (below 0.2–0.3 dB in this case).
The vertical lines on the third panel from the top on period (a) mark the times of the multiple expansion phases from the pi2 pulsations: 17:34 UT, 17:46 UT, 18:12 UT, and 18:21 UT, for substorm (1); 19:49 UT, 20:08 UT, 20:23 UT, 20:38 UT, 20:54 UT, and 21:03 UT, for substorm (2); and 00:35 UT, 00:54 UT and 01:18 UT for substorm (3). Maxima in lumi-nosity and absorption spikes generally correspond with the pi2 bursts when the substorm westward current disturbance is seen within the common field of view. For period (b) we are just marking the intervals of substorm activity at 17:00– 18:00 UT, 18:20–19:35 UT, and 20:18–21:25 UT. The simul-taneous peak in the absorption and the optical emission on the third panel of Fig. 1b corresponds to the bay in the X-component of the magnetic field at 20:32 UT and to a burst of pi2 activity.
The DASI keogram covers the camera field of view out to
±75◦zenith angle. It is clear from the figure that there is a correspondence between the optical activity recorded by the all-sky camera and the lower E-region ionisation measured by the riometer. We can see the explosive increase in lumi-nosity at the times when the multiple substorm onsets took place. The keograms are projected to the 100 km common height to facilitate the comparisons. The magnetic field lines are nearly in the meridian plane at 12.5◦S from the verti-cal, and the characteristic height for the absorption features is 90 km and 110 km for the optical features.
The third panel from the top shows the systematic cor-respondence between maximum optical emission and maxi-mum absorption when substorm activity is present within the common field of view, particularly during the 13–14 Febru-ary 1996 period. The bottom panel shows that the signatures of the same auroral feature, as seen by the two systems in the common field of view, lie close to each other with maxi-mum absorption often slightly south of the maximaxi-mum optical emission. At times when this is not the case, the stronger substorm disturbance was either to the north or to the south, outside the IRIS field of view, which explains the concentra-tion of points at 70.2◦or 67.8◦lat.
The bottom panel, and especially in period (a), also shows some characteristic features of the evolution of the arcs dur-ing substorm events (Rostoker et al., 1980): north to south motion during growth phase until substorm onset (at intervals 17:34–18:12 UT, 18:12–18:21 UT, 20:38–20:54 UT, 20:54–
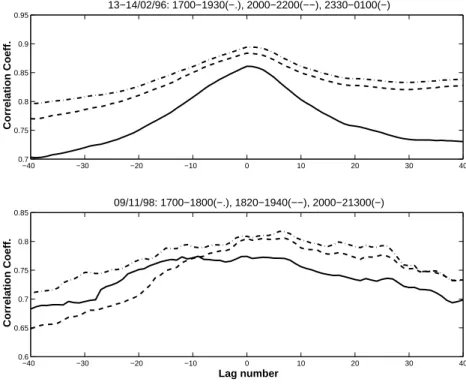
−40 −30 −20 −10 0 10 20 30 40 0.7 0.75 0.8 0.85 0.9 0.95 13−14/02/96: 1700−1930(−.), 2000−2200(−−), 2330−0100(−) Correlation Coeff. −40 −30 −20 −10 0 10 20 30 40 0.6 0.65 0.7 0.75 0.8 0.85 09/11/98: 1700−1800(−.), 1820−1940(−−), 2000−21300(−) Correlation Coeff. Lag number
Fig. 2. Cross-correlation between
max-imum absorption and the square root of maximum green-line intensity at the longitude of Tromsø. (Upper panel) 13–14 February 1996 (17:00–19:30 UT, 20:00–22:00 UT, and 23:30–01:00 UT), and (lower panel) 09 November 1998 (17:00–18:00 UT, 18:20–19:40 UT, and 20:00–21:30 UT). The unit time-lag is 10 s, the lowest common time resolu-tion for IRIS and DASI. Positive lags mean that the absorption maximum pre-cedes the green-line maximum.
21:03 UT) when the luminosity of the most equatorward arc increases sharply, and the auroral bulge expands north. When this northward motion stops, recovery phase is signalled by arcs moving south again (after 18:21 UT and 21:03 UT). Due to the multiple onsets, the growth phase of a new substorm appears to overlap the recovery phase of the previous storm. The characteristic pattern of precipitation during sub-storm activity in the late evening and early morning sectors is also seen by EISCAT: discrete enhancements in electron den-sity and penetration to lower heights at substorm onsets, and then the strong, slowly varying enhancement at the morning hours. This corresponds with similar signatures in the single broad-beam riometer records (Ranta et al., 1983; Hargreaves and Devlin, 1990; Burns et al., 1990).
Only during moderately disturbed conditions (13–14 February 1996), we can see the presence of well-defined arc structures in the optical records, changing relatively slowly with time, and in very good correspondence with associated absorption features. Optical emission and absorption struc-tures are closely collocated with each other and follow the general alignment with the magnetic L-shells, and drifting with similar velocities and directions. During relatively high to strongly disturbed conditions (as in 9 November 1998), there is still a general correspondence between optical and absorption signatures, but we can not see any well-defined arc structures. Both the optical and absorption signatures are much more structured, complex, and changing rapidly. Stoker et al. (1996) have compared all-sky images of optical emissions and the imaging riometer in Antarctica and found that during substorm onset, before local magnetic midnight, absorption regions showed marked inhomogeneous distribu-tions and were adjacent to, but do not coincide with, spatially
well-defined regions of optical emissions.
Cross-correlation of the time series of maximum absorp-tion and maximum green-line intensity in the common field of view seems to show a systematic delay of the absorp-tion relative to the optical emission. Figure 2 displays the cross-correlation coefficient between absorption maximum and the square root of green-line intensity maximum at the longitude of Tromsø, for three intervals of substorm activity during (upper panel) 13–14 February 1996 (17:00–19:30 UT, 20:00–22:00 UT, and 23:30–01:00 UT), and (lower panel) 09 November 1998 (17:00–18:00 UT, 18:20–19:40 UT, and 20:00–21:30 UT). The unit lag in all cases is 10 s, the lowest common time resolution for IRIS and DASI. Positive lags mean that the maximum in the 557.7 emission precedes the absorption maximum and may indicate that softer electrons precipitate first, closer to their Alfv´en layer, while harder pre-cipitation has been dispersed closer to Earth.
The high correlation between these time series means that both instruments basically record the same time variations on the same population of precipitating electrons, but in two different energy ranges. This is also the case at other longi-tudes within the full extent of the precipitation region. This fact has been utilized, for instance, in the estimation of the characteristic energies in the paper by Kosch et al. (2001). The time delays are larger for highly disturbed conditions, of the order of 40 s to 60 s in period (b) compared to the moder-ately active period (a) that indicates a time delay of the order of 10 s to 20 s. Results for interval 20:00–21:30 UT in period (b) are less clear; however, the correlation coefficient is max-imum close to the zero lag but the curve is nearly flat up to lag 6 or so. Stoker et al. (1996) have found a time delay of 52 s shortly after a Sudden Storm Commencement in 9 June
0 0.1 0.2 0.3 0.4 0.5 0.6 18 19 20 21 22 23 68 68.5 69 69.5 70
IRIS (Absorption / time) 17:58:00 13/02/96
Latitude (degrees) 14 16 18 20 22 24 26 68 69 70 71 72
Contours for IRIS (Absorption / time)
Longitude (degrees) Latitude (degrees) 18 19 20 21 22 23 68 68.5 69 69.5 70 Latitude (degrees)
MAX length of closed contours
1000 2000 3000 4000 18 19 20 21 22 23 68 68.5 69 69.5 70
DASI (green line) 17:58:00 13/02/96
Latitude (degrees) 14 16 18 20 22 24 26 68 69 70 71 72
Contours for DASI (green line)
Longitude (degrees) Latitude (degrees) 18 19 20 21 22 23 68 68.5 69 69.5 70 Latitude (degrees)
MAX length of closed contours
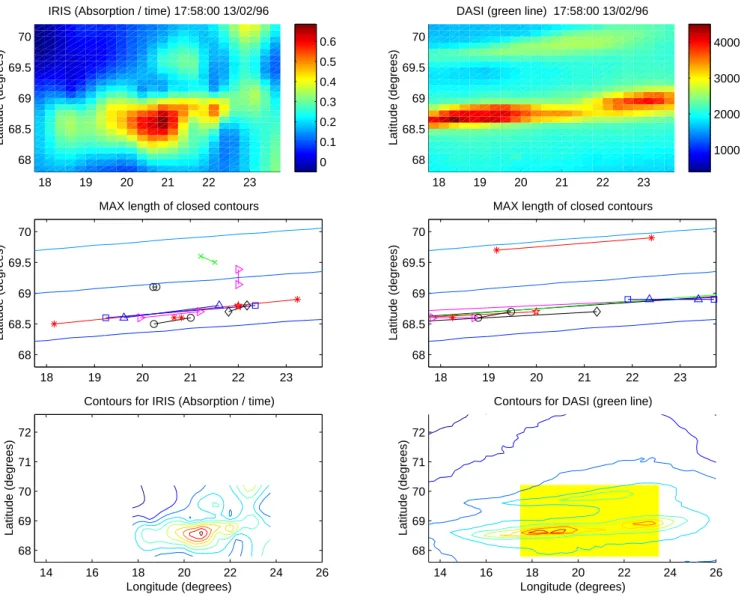
Fig. 3. (Top panels) Simultaneous observations by the IRIS and DASI systems in the common field of view of IRIS at 17:58 UT. The middle
panels show the length and orientation of the structures defined by the closed contours, the features show a clear alignment with the magnetic L-shells (the transverse blue lines across the panels). The bottom panels display the contour plots for the two data sets, in their respective fields of view. The yellow patch on the right shows the IRIS field of view.
1991, just after local midnight (with Kp =4 before midnight to 7−, directly thereafter).
3 Discussion
Our discussion is focused primarily on the 13–14 February 1996 data. This period is of particular interest because we can clearly identify slowly varying arc structures in both the optical and absorption records, during three multiple-onset substorms seen within the common field of view of the in-struments, and in one event, the westward electrojet distur-bance is seen almost over Tromsø (at 20:35 UT). For a case study of the electrodynamics of arcs during this period, see del Pozo et al. (2001a). When substorm onset is seen within the IRIS field of view, there is a close correspondence be-tween the optical and absorption signatures of auroral forms,
as well as in the overall north-south motion characteristic of the various phases of the substorm. Maximum absorption and green-line emission are nearly co-located with absorp-tion slightly offset south of the maximum green-line emis-sion.
Figure 3 shows a well-defined arc feature from simultane-ous observations by the IRIS and DASI systems in the com-mon field of view of IRIS at 17:58 UT on 13 February 1996. The various symbols and corresponding line segments show the length and elongation axis of the closed contours in both absorption and 557.7 nm intensity. The spatial distribution of the harder precipitation responsible for the enhanced ab-sorption appears more structured than the narrower arc fea-ture seen by DASI. Overall, there is a close correspondence between the two observations: the middle panels show the length and orientation of the features defined by the closed
100 102 104 106 108 1010 Energy (keV) log(Flux (/cm 2/s)) 18:10−18:16 UT 100 102 104 106 108 1010 Energy (keV) log(Flux (/cm 2/s)) 18:19−18:25 UT 100 102 104 106 108 1010 Energy (keV) log(Flux (/cm 2/s)) 20:38−20:44 UT 0 50 100 150 200 104 106 108 1010 Energy (keV) log(Flux (/cm 2/s)) 20:28−20:34 UT 0 50 100 150 200 104 106 108 1010 Energy (keV) log(Flux (/cm 2/s)) 20:35−20:44 UT 0 50 100 150 200 104 106 108 1010 Energy (keV) log(Flux (/cm 2/s)) 20:45−20:51 UT
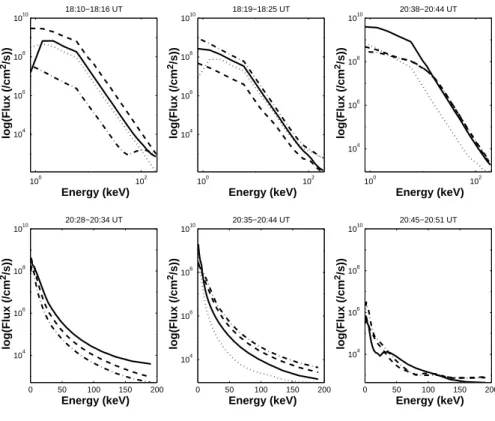
Fig. 4. Electron precipitation spectra
during various substorm phases and lo-cal times on 13 February 1996. The dot-dashed line gives the earliest spectrum, followed by the dashed line, then by the full line, and finally by the dotted line spectrum. (Upper panels) Substorm on-sets are at 18:12 UT, at 18:21 UT, and at 20:38 UT, in intervals 18:10–18:16 UT, 18:19–18:25 UT, and 20:38–20:44 UT. The time step is 2 min and the log-log scale is for better recognition of the spectral shapes at the lower ener-gies. (Lower panels) Typical sequence of precipitation spectra, every 3 min, during substorm growth phase (20:28– 20:34 UT), expansion phase (20:35– 20:44 UT), and recovery phase (20:45– 20:51 UT). The major substorm onset occurred at about 20:38 UT, but the maximum flux at the lower energies is seen at 20:41 UT. The substorm west-ward electrojet disturbance was practi-cally above Tromsø at 20:35 UT.
contours. Moreover, the features show a clear alignment with the magnetic L-shells (set of transverse lines across the pan-els). The bottom panels display the contour plots for the two 2-D images, in their respective fields of view. The yellow patch on the right shows the IRIS field of view. The L-shells are given by the 1996 International Reference Geomagnetic Field Model.
3.1 Energy spectrum of electron precipitation at Tromsø Plasma sheet electrons in the keV energy range are injected deeper into the magnetosphere during the substorm, primar-ily because of the strong convection electric field, and then experience strong pitch-angle scattering and radial diffusion (Wolf, 1995). In most of our determinations, from tron densities measured by EISCAT at Tromsø, the elec-tron precipitation spectrum is roughly represented by a sin-gle Maxwellian distribution, suggestive of an electron pop-ulation which has been accelerated long before precipitation takes place (Kosch et al., 2001). The acceleration processes in the plasma sheet may also produce further stretching and widening of the tail of the Maxwellian distribution. This is a feature typical of electrons originating at the central plasma sheet (cps), whereas acceleration along the field lines taking place after precipitation would be signalled by a secondary peak in the spectrum associated with a drifting Maxwellian (characteristic of electrons from the boundary plasma sheet, “bps”, Rostoker et al., 1985). For instance, Kirkwood and Eliasson (1990) have reported that the electron spectrum a few minutes after substorm onset have sharper peaks than the Maxwellian form (in the 5–10 keV range) that may be due to
parallel acceleration processes, and that both pre-onset and post-onset diffuse precipitation seem to be due to “cps” elec-trons with a closely quasi-thermal spectrum with high-energy tail.
The electron precipitation features in the evening and morning sectors are basically symmetric, the only difference seems to be associated with the energies to which electrons are accelerated within the boundary plasma sheet in the two sectors, as discussed by Rostoker et al. (1985). They found that electron energies of 5–10 keV are not at all uncommon in the late evening sector, whereas in the early morning hours it is rare to find particles accelerated to energies in excess of 1–2 keV. This is consistent with our observations where maximum flux in the flux-energy spectrum is also in the 5– 10 keV range in the evening sector (before ∼ 20:00 UT), and in the 1–2 keV range in the post-midnight hours. Figure 4a (upper panels), for instance, shows the electron precipita-tion spectrum around substorm onsets at 18:12 UT (dashed line), at 18:21 UT (dashed line), and at 20:38 UT, in intervals 18:10–18:16 UT, 18:19–18:25 UT, and 20:38–20:44 UT. The spectra are plotted on a log-log scale to better recognise their shapes at the lower energies. The time step is 2 min in all cases. In this and in Fig. 4b (lower panels), the dot-dashed line gives the earliest spectrum, followed by the dashed line, then by the full line, and finally by the dotted line spectrum.
Figure 4b shows a typical sequence of precipitation spec-tra during a substorm event in 13 February 1996, for three intervals covering substorm growth (20:28–20:34 UT), ex-pansion (20:35–20:44 UT), and recovery (20:45–20:51 UT) phases. The chosen time step is 3 min. Multiple substorm onsets and intensifications occurred at 20:21 UT, 20:38 UT,
0 0.1 0.2 0.3 0.4 0.5 14 16 18 20 22 24 26 68 68.5 69 69.5 70 70.5 71 71.5 72 72.5 IRIS (dB) 17:44:00 13/02/96 Latitude (deg) 0.5 1 1.5 2 2.5 3 3.5 14 16 18 20 22 24 26 68 68.5 69 69.5 70 70.5 71 71.5 72 72.5 DASI (Int, kR) 18 19 20 21 22 23 68 68.5 69 69.5 70
Contours for IRIS
Longitude (degrees) Latitude (deg) 14 16 18 20 22 24 26 68 68.5 69 69.5 70 70.5 71 71.5 72 72.5
Contours for DASI
Longitude (degrees) (a)
0.1 0.2 0.3 0.4 0.5 0.6 0.7 0.8 0.9 1 14 16 18 20 22 24 26 68 68.5 69 69.5 70 70.5 71 71.5 72 72.5 IRIS (dB) 20:42:00 13/02/96 Latitude (deg) 2 4 6 8 10 12 14 16 18 20 22 24 26 68 68.5 69 69.5 70 70.5 71 71.5 72 72.5 DASI (Int, kR) 18 19 20 21 22 23 68 68.5 69 69.5 70
Contours for IRIS
Longitude (degrees) Latitude (deg) 14 16 18 20 22 24 26 68 68.5 69 69.5 70 70.5 71 71.5 72 72.5
Contours for DASI
Longitude (degrees) (b) 0.05 0.1 0.15 0.2 0.25 0.3 0.35 0.4 0.45 0.5 14 16 18 20 22 24 26 68 68.5 69 69.5 70 70.5 71 71.5 72 72.5 IRIS (dB) 22:08:00 13/02/96 Latitude (deg) 0.4 0.6 0.8 1 1.2 1.4 14 16 18 20 22 24 26 68 68.5 69 69.5 70 70.5 71 71.5 72 72.5 DASI (Int, kR) 18 19 20 21 22 23 68 68.5 69 69.5 70
Contours for IRIS
Longitude (degrees) Latitude (deg) 14 16 18 20 22 24 26 68 68.5 69 69.5 70 70.5 71 71.5 72 72.5
Contours for DASI
Longitude (degrees) (c) 0.05 0.1 0.15 0.2 0.25 0.3 0.35 0.4 0.45 14 16 18 20 22 24 26 68 68.5 69 69.5 70 70.5 71 71.5 72 72.5 IRIS (dB) 23:30:00 13/02/96 Latitude (deg) 0.2 0.4 0.6 0.8 1 1.2 1.4 1.6 14 16 18 20 22 24 26 68 68.5 69 69.5 70 70.5 71 71.5 72 72.5 DASI (Int, kR) 18 19 20 21 22 23 68 68.5 69 69.5 70
Contours for IRIS
Longitude (degrees) Latitude (deg) 14 16 18 20 22 24 26 68 68.5 69 69.5 70 70.5 71 71.5 72 72.5
Contours for DASI
Longitude (degrees) (d)
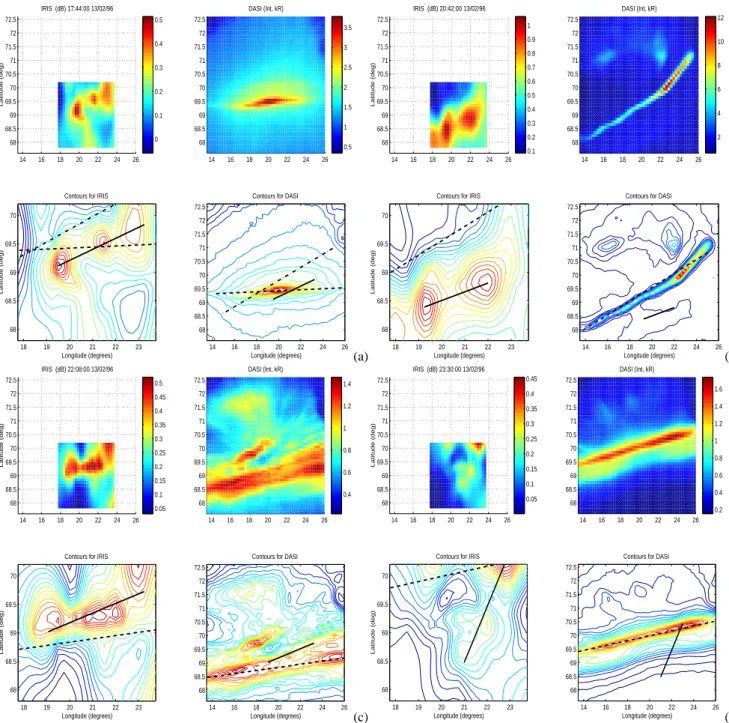
Fig. 5. Auroral forms as seen by IRIS and DASI in their respective fields of view on 13 February 1996. The colour scales are in dB
for IRIS, and in kR for DASI. The bottom panels show the contour plots corresponding with the top 2-D images. The estimated extent and alignment of the absorption region and the optical feature is given, respectively, by the full and the dashed lines. (a) Arc feature in the evening sector at 17:44 UT/20:20 MLT, the dot-dashed line defines the sharper edge of the absorption/higher energy precipitation region north of the optical signature. (b) Post-Harang discontinuity arc at 20:42 UT/23:20 MLT during expansion phase. (c) Early morning precipitation during substorm recovery at 22:00 UT/00:30 MLT. (d) Morning arc at 23:30 UT (02:00 MLT) during substorm growth phase.
20:50 UT and 21:03 UT. The substorm westward electrojet disturbance was practically above Tromsø at 20:35 UT. The major substorm onset occurred at about 20:38 UT, but the maximum flux at the lower energies is seen at 20:41 UT, and although there is some superposition between the growth, expansion and recovery phases of subsequent substorm on-sets and intensifications, we can see some clear features of the various phases of the substorm event. Before substorm
onset (growth phase), there is an increase in the flux at the higher energies with little change in flux at the lower energies (broadening of the spectrum), and then between 20:35 UT and 20:42 UT (expansion phase) there is a large increase in the precipitation flux at the lower energies with a reduction at the medium to high energies (narrowing of the spectrum). The overall flux decreases at recovery phase.
0 0.1 0.2 0.3 0.4 0.5 0.6 14 16 18 20 22 24 26 68 68.5 69 69.5 70 70.5 71 71.5 72 72.5 IRIS (dB) 17:16:00 09/11/98 Latitude (deg) 2 4 6 8 10 12 14 14 16 18 20 22 24 26 68 68.5 69 69.5 70 70.5 71 71.5 72 72.5 DASI (Int, kR) 18 19 20 21 22 23 68 68.5 69 69.5 70
Contours for IRIS
Longitude (degrees) Latitude (deg) 14 16 18 20 22 24 26 68 68.5 69 69.5 70 70.5 71 71.5 72 72.5
Contours for DASI
Longitude (degrees) (a)
0.2 0.3 0.4 0.5 0.6 0.7 14 16 18 20 22 24 26 68 68.5 69 69.5 70 70.5 71 71.5 72 72.5 IRIS (dB) 20:54:00 09/11/98 Latitude (deg) −1.5 −1 −0.5 0 0.5 1 1.5 2 14 16 18 20 22 24 26 68 68.5 69 69.5 70 70.5 71 71.5 72 72.5 DASI, log(Int, kR) 18 19 20 21 22 23 68 68.5 69 69.5 70
Contours for IRIS
Longitude (degrees) Latitude (deg) 14 16 18 20 22 24 26 68 68.5 69 69.5 70 70.5 71 71.5 72 72.5
Contours for DASI
Longitude (degrees) (b)
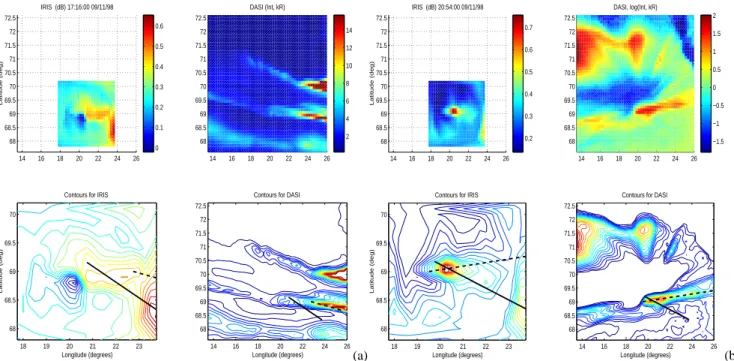
Fig. 6. Two cases of complex auroral forms observed on 9 November 1998, the colour scale for the absorption is in dB. (a) Arc-like structures
at 17:16 UT, the smaller field of view of IRIS only records the absorption patch associated with, and slightly south of, the middle optical arc. The scale for the optical emission is linear in kR. (b) Spiral shaped auroral form or distortion on the auroral arc at 20:54 UT, the absorption region in the IRIS field of view is located slightly south of the lower “arm” of the optical feature. The logarithmic scale for the optical emission is just to obtain a better contrast. The full and dashed lines show, respectively, the elongation and alignment of the absorption region and the optical feature.
3.2 Correspondence of auroral forms and absorption “patches”
Both the optical and absorption signatures result from elec-tron precipitation and are associated with the region of up-ward field-aligned current in the auroral arc system. The edge of the precipitation region faces the region of strong electric field and weak conductivity associated with the downward current, which is equatorward of the arc system in the eastward electrojet (evening sector) and poleward in the westward electrojet (morning sector). Optical signatures are more evenly distributed in space and clearly elongated along the L-shells, while the absorption regions appear more localised and patchy, although generally following the shape of the optical signatures. This structure does not seem to be explained by the coarse resolution of the absorption images or, as we discuss later, by the effects of contamination at the riometer operating frequency. DASI, with its finer resolution and larger field of view, shows the presence of large-scale, arc-like structures, of a scale-size greater than the IRIS reso-lution.
Higher energy electrons are the result of radial diffusion and acceleration processes in the plasma sheet, and this may explain the equatorward spreading and complexity of the ab-sorption regions. This can also explain the shift of the maxi-mum absorption south of the maximaxi-mum optical emission. Be-low we present the characteristic patterns of the arc-like au-roral forms and the correspondent absorption regions in the
eastward and westward electrojets. In Fig. 5, for instance, we show four auroral forms as seen by IRIS and DASI in their re-spective fields of view during 13 February 1996. The bottom panels give a closer view of the contour plots corresponding with the top 2-D images. The full line is an estimate of the extent and alignment of the absorption region by connecting the centres of the absorption patches as defined by the closed contours. The dashed line gives the elongation axis of the closed iso-intensity contour of maximum length within the DASI field of view.
Figure 5a shows an evening sector arc (at 17:44 UT/20:14 MLT) during substorm late growth phase, and the dot-dashed line defines the sharper edge of the absorption/higher energy precipitation region which is on the poleward side of the optical signature. There is a clear correspondence between the absorption and the green-line intensity distributions. The absorption region, however, is more structured and spreads equatorward of the optical arc-like feature which is not very narrow itself. The auroral curtain associated with this arc-like signature, lies north of the magnetic zenith at the camera location, and we may be seeing the corona effect to the north. The sharp and most intense bottom edge of the optical emission is very close to the dashed line connecting the centres of maximum absorption, and slightly equatorward of the sharp absorption boundary (dot-dashed line). Both the full line and the dot-dashed line are closely aligned together and with the poleward side iso-contours of the optical feature rather than
with the sharper equatorward edge of the optical arc, which is rotated to the south and west. This is a common feature of the evening arc structures during the whole period.
Figure 5b is similar to Fig. 5a but now it shows a post-Harang discontinuity, midnight arc, at 20:42 UT/23:12 MLT, during substorm expansion phase. EISCAT observations and IMAGE magnetic data show the reversal of the plasma drift direction after 20:00 UT. This optical arc is much narrower than the evening feature and shows the alignment and possi-ble overlapping between the optical arc and the sharper pole-ward edge of the absorption region. We can clearly see that most of the absorption region lies equatorward of the opti-cal arc. The optiopti-cal arc appears to be “compressed” between the region of strong electric field on its poleward edge (in the westward electrojet) and the sharp bottom edge of the op-tical emission to the south. Figure 5c shows an arc during early morning precipitation at 22:08 UT/00:38 MLT within substorm recovery phase. Contrary to the observations in the evening and near midnight sectors, however, the main absorption region appears to lie north of the optical emis-sion region. This time we may be seeing two populations of precipitating electrons, particularly in the absorption record: one associated with the main absorption signature poleward of the optical arc and the other south of it, in the bottom left corner of the absorption image, and mostly outside of the IRIS field of view equatorward of the arc. After 23:00 UT (01:30 MLT), we see well-defined and relatively narrow arcs in the DASI records with the corresponding absorption re-gion equatorward of it. Figure 5d, for instance, shows such an arc at 23:30 UT (02:00 MLT), the sharper edge of the op-tical signature lies on the poleward side of the arc system.
The absorption patch poleward of the optical arc may be associated with “bps” precipitation from the morning shear zone, while the absorption region, equatorward of the op-tical arc, could be associated with electrons which entered the “cps” during substorm in the evening to midnight sector and drifted eastward under the combined effects of the gra-dient and curvature drifts and the convective E × B drift. Drift paths of the electrons in the distant tail plasma sheet are primarily earthward as a consequence of the dawn-to-dusk convection electric field. Close to the Earth, gradient and curvature drift effects lead to asymmetries in the drift patterns. Some electrons accelerated in the dusk sector ve-locity shear zone will drift into the dawn hemisphere. Thus, the cps electron population in the morning sector will con-sist of two components, one having originated in the evening shear zone, and one having originated in the morning shear zone (Rostoker et al., 1985).
Although auroral forms during the highly disturbed pe-riod of 9 November 1998 are much more complex, the gen-eral correspondence with the absorption patches is consistent with the observations on 13 February 1996. Figure 6 dis-plays two cases of these complex auroral forms observed on 9 November 1998. Case (a) shows what appears to be three arc-like structures at 17:16 UT, the smaller field of view of IRIS only records the absorption patch associated with, and slightly south of, the middle optical arc. Case (b), on the
other hand, shows a spiral shaped auroral form or a distor-tion on the auroral arc at 20:54 UT, the absorpdistor-tion region in the IRIS field of view seems to occupy the regions slightly south of the lower “arm” of the optical emission pattern. In order to obtain a better contrast in the optical image, we plot, in this case, the logarithm of the green-line intensity. The dashed and full lines superimposed on the plots are, respec-tively, the axis of the closed contour of maximum elongation for the DASI images, and the estimated extent and general orientation of the absorption regions.
The region of very low absorption in Fig. 6a is a product of the incomplete removal of the scintillation effects mentioned before (the traces are seen in Fig. 1b, at about the same lat-itude and longlat-itude). Scintillation effects are very localised and, after application of the removal algorithm, absorption “lows” may appear on regions of very low background ab-sorption at the edges of, or completely outside, regions of enhanced absorption. We have looked at the individual im-ages from the two periods, particularly on 9 November 1998, and we found no evidence that these “lows” may produce significant distortions or “false structure” in the absorption images.
3.3 Size of the absorption and green-line intensity struc-tures
Image analysis techniques were applied to both IRIS and DASI 2-D distributions, in order to identify and compare the spatial structure and to study the temporal evolution of corresponding auroral forms and precipitation regions. The axis of maximum elongation or major axis, and the equiva-lent length and width of the 557.7 nm emission and the ab-sorption “patches” were systematically determined, as well as their areas and gravity centres. These patches are defined by the outermost closed contours around regions of enhanced absorption or optical emission. They may correspond with distinct features on the IRIS or the DASI images at any given time, and be associated with structure in the ionisation in-duced by the electron precipitation. The number and size of the closed contours are, of course, functions of the field of view and resolution of the instruments, and the step sizes for the contours. Indeed, events taking place at the edge of the fields of view may have no closed contours at all. The min-imum levels employed in this study to define the absorption, and the optical features are, respectively, 0.2 dB and 1 kR, and we are fixing the number of contours to ten levels in all cases.
We only consider events occurring within the field of view of the instruments and, thus, the maximum size of the closed contours will be limited by the size of the effective ob-serving windows which are nearly 250 km and 500 km, for the IRIS and DASI systems, respectively. Separated fea-tures inside these fields of view will have different outer contour values and different peak intensities and, therefore, meaningful comparisons and statistics have to consider fea-tures with similar ratio, r, of the outer intensity level to the peak intensity. In this way, the estimated dimensions will
20 50 80 110 140 170 200 230 260 290 0 50 100 150 200 250 300 Length (km) No. of cases IRIS, all 13/02/96 20 50 80 110 140 170 200 0 100 200 300 400 500 Width (km) No. of cases IRIS, width 0 100 200 300 400 500 600 0 50 100 150 200 250 Length (km) No. of cases DASI, all 20 50 80 110 140 170 200 230 260 290 0 100 200 300 400 500 600 700 Width (km) No. of cases DASI, width (a) 20 50 80 110 140 170 200 230 260 290 0 20 40 60 80 100 120 140 160 180 Length (km) No. of cases IRIS, all 09/11/98 20 50 80 110 140 170 200 0 50 100 150 200 250 Width (km) No. of cases IRIS, width 0 100 200 300 400 500 600 0 50 100 150 Length (km) No. of cases DASI, all 20 50 80 110 140 170 200 230 260 290 0 50 100 150 200 250 300 350 Width (km) No. of cases DASI, width (b)
Fig. 7. Histograms of the lengths and widths of all separated closed contours during the two observing periods, (a) 13–14 February 1996
(17:00–01:00 UT) and (b) 9 November 1998 (17:00–22:00 UT). In each figure, the IRIS results are shown on the left-hand side, and the DASI results on the right-hand side.
20 50 80 110 140 170 200 230 260 290 0 2 4 6 8 10 12 14 16 18 Length (km) No. of cases
IRIS, Half−intensity sizes, 13/02/96
20 50 80 110 140 170 200 0 5 10 15 20 25 Width (km) No. of cases IRIS, width 0 100 200 300 400 500 600 0 5 10 15 20 25 30 Length (km) No. of cases DASI, length 20 50 80 110 140 170 200 230 260 290 0 5 10 15 20 25 30 35 40 Width (km) No. of cases DASI, width (a) 20 50 80 110 140 170 200 230 260 290 0 10 20 30 40 50 60 Length (km) No. of cases
IRIS, Half−intensity sizes, 09/11/98
20 50 80 110 140 170 200 0 10 20 30 40 50 60 70 Width (km) No. of cases IRIS, width 0 100 200 300 400 500 600 0 5 10 15 20 25 30 35 40 45 Length (km) No. of cases DASI, length 20 50 80 110 140 170 200 230 260 290 0 20 40 60 80 100 120 Width (km) No. of cases DASI, width (b)
Fig. 8. Histograms of the lengths and widths of the half-intensity contours for the same periods (a) and (b) as in Fig. 7. Half-intensity
contours are defined by ratios, r, 0.4 < r < 0.6. IRIS results are shown on the left side and DASI results on the right side of each figure.
be independent of the peak intensities. For instance, ratios 0.4 < r < 0.6 will define the half-intensity patches enclosed by contours with intensity levels around 50% of their peak intensities.
Figure 7 presents the statistics of sizes (length and width) for all r values and Fig. 8 presents the statistics of the
half-intensity sizes. Figures 7a and 8a show the distribu-tions for the 13–14 February 1996 (17:00–01:00 UT) period, and Figs. 7b and 8b show those for the 09 November 1998 (17:00–22:00 UT) period. The left-hand side panels display the results for IRIS and the right-hand side panels display those for DASI; the step in the x-axis in all figures is 30 km.
18:00 19:00 20:00 21:00 22:00 23:00 00:00 01:00 −50
0 50
IRIS, elong. axis angle(x) 17:00 − 00:59 13−14/02/96
Ang(deg.)
18:00 19:00 20:00 21:00 22:00 23:00 00:00 01:00
−50 0 50
DASI, elong. axis angle(o)
Ang(deg.)
18:00 19:00 20:00 21:00 22:00
−50 0 50
IRIS, elong. axis angle(x) 17:00 − 22:00 09−09/11/98
Ang(deg.)
18:00 19:00 20:00 21:00 22:00
−50 0 50
DASI, elong. axis angle(o)
Ang(deg.)
time (h:m)
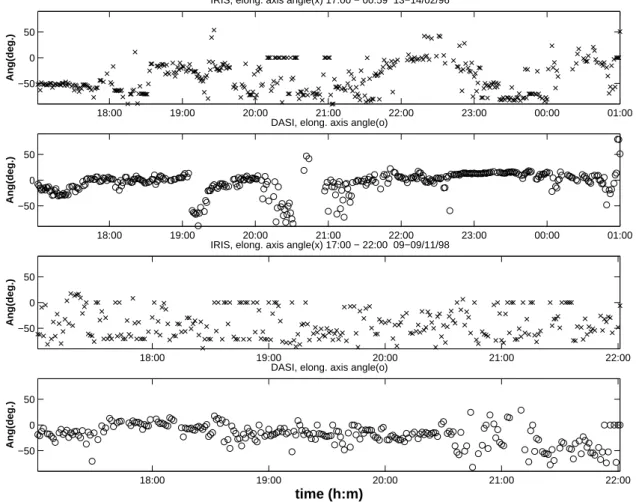
Fig. 9. Angle between the geographic east-west direction and the main axis of the closed contours of maximum length at any given time for
both IRIS (x) and DASI (o). Angles for period 13–14 February 1996 are shown in the first and second panels from the top, and in the third and four panels for 9 November 1998. The main axes are in most cases within ± 50◦from the east-west direction.
As we can see in Fig. 7 small-scale structure is dominant for both instruments and the two periods. Actually, small-scale structure is roughly associated with values r > 0.6, while values r < 0.6 are mostly associated primarily with large-scale structure.
Comparing the two different periods in Figs. 7, we can see that the distributions of lengths and widths for, respectively, IRIS and DASI have similar shapes, particularly for the IRIS observations. The higher number of cases in period (a) can be explained by the longer observing time, 8 h, as compared with 5 h in period (b). The average values (weighted aver-ages) of the distributions of length and width are very similar for the two periods and instruments, with values of 95 km and 52 km for IRIS, and of 175 km and 70 km for DASI, in period (a); and with values of 92 km and 51 km for IRIS, and of 162 km and 62 km for DASI, in period (b). Maximum widths for IRIS and DASI are also comparable in each period and around 170 km on 13 February 1996 and around 110 km on 9 November 1998. The maximum length of the absorp-tion features (between 200 and 260 km) in both periods and the maximum length of the optical features on 13 February 1996 (around 500 km) are limited by the fields of view in the
two systems. Maximum widths, on the other hand, are in all cases smaller than the size of the fields of view. This is also true for the maximum length in the DASI determinations on 9 November 1998, which is around 300 km and may reflect the fact that disturbed arcs consist of smaller scale distortions (quiet arcs, as on 13–14 February 1996, are generally longi-tudinally uniform, large-scale features).
Looking at Fig. 8, only a very small part of the total num-ber of closed contours are associated with the half-intensity patches and, contrary to Fig. 7, Fig. 8 shows a larger relative number of cases for the disturbed period ((b), 9 November 1998) than for the quieter period ((a), 13–14 February 1996). The average length and width in Fig. 8 are, however, quite different for IRIS and DASI, and for the two periods. They are equal to 204 km and 132 km for IRIS, and to 340 km and 137 km for DASI, in period (a); and equal to 125 km and 73 km for IRIS, and to 180 km and 65 km for DASI in pe-riod (b). We are, therefore, observing shorter and thinner absorption and optical emission features during higher mag-netic activity conditions.
Comparison with previous results in the literature is dif-ficult due to the very limited number, to our knowledge,
18:00 19:00 20:00 21:00 22:00 23:00 00:00 01:00 67 68 69 70 71 72
IRIS, grav. centre(o), middle(tri.), max(.) 17:00 − 00:59 13−14/02/96
Lat(deg.) 18:00 19:00 20:00 21:00 22:00 23:00 00:00 01:00 67 68 69 70 71 72
DASI, grav. centre(o), middle(triang.), max(.)
Lat(deg.) 18:00 19:00 20:00 21:00 22:00 67 68 69 70 71 72
IRIS, grav. centre(o), middle(tri.), max(.) 17:00 − 22:00 09−09/11/98
Lat(deg.) 18:00 19:00 20:00 21:00 22:00 67 68 69 70 71 72
DASI, grav. centre(o), middle(triang.), max(.)
Lat(deg.)
time (h:m)
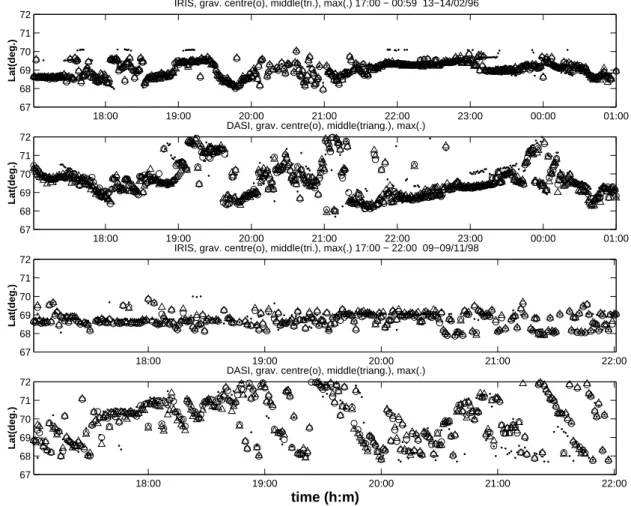
Fig. 10. Latitude of the gravity centre (circles), of the middle point on the major axis (triangles), and of the point of maximum intensity
(dots) for the closed contours of maximum length at any given time for both IRIS and DASI observations, in their respective fields of view. The first and second panels from the top are for the 13–14 February 1996 period, whereas the third and fourth are for the 9 November 1998 period.
of similar studies presenting the statistics of sizes for the absorption and optical emission features. Hargreaves et al. (1997), for instance, found that high intensity nightside “spike” events associated with substorm activity are usually elliptical in shape, with the major axis generally along the L-shells. They estimated the median dimensions of 190 km and 80 km for the length and width of the half-absorption closed contours. Moreover, Ranta et al. (1997) have reported the presence of small-scale features in the afternoon sector, shortly after the substorm onset, with sizes from 30 km by 30 km to 180 km by 130 km. Concerning the optical emis-sion, on the other hand, as mentioned before, quiet-time au-roral arcs are aligned approximately along the L-shells and extend for a few 100 km to 1000 km east-west. The disturbed arcs consist of small-scale distortions or spirals with a typi-cal diameter of the order of 100 km. Johnson et al. (1998) have reported a latitudinal extent between 30 km and 150 km for a sample of 100 arcs, mainly in the evening to midnight sectors; the sizes are mostly between 40 km and 60 km, and the average thickness is 55 km.
Figure 9 shows the angle between the elongation axis and
the geographic east-west direction for the closed contours of maximum length at any given time for both IRIS and DASI. We can see that the direction of the elongation axis is in most cases within angles smaller than 50◦from the east-west direction. Angles for the period 13–14 February 1996 are shown in the first and second panels from the top and in the third and four panels for 9 November 1998. DASI results show that in both periods the major axes are generally closer to the east-west direction, as expected from the previous ob-servations of the L-shell alignment of the large-scale arc-like structures. The larger dispersion in the IRIS results indicates that we are observing smaller scale structure with arbitrary major axis alignment.
Finally, Fig. 10 displays the latitudes of the gravity centre (circles), of the middle point on the major axis (triangles), and of the point of maximum intensity (dots) for the closed contours of maximum length at any given time, from both IRIS and DASI in their respective fields of view. The first and the second panels from the top are for the 13–14 February 1996 period; the third and the fourth are for the 9 November 1998 period. The generally close coincidence between the
centre of the major axes, the gravity centres, and the points of maximum intensity of the closed contours, in both IRIS and DASI images, indicates that the auroral forms and absorption patches must be nearly elliptical in shape, elongated along the major axis.
4 Conclusion
Simultaneous IRIS and DASI observations were employed in a study of the spatial distribution of electron precipita-tion and of their temporal evoluprecipita-tion during substorm activ-ity. The simultaneous operation of EISCAT provides high-resolution measurements of a number of physical parame-ters defining the state of the ionosphere above Tromsø and allows for the estimation of the particle precipitation spec-trum. Only during quiet-to-moderately disturbed conditions (on 13–14 February 1996, period (a)), can we see the pres-ence of longitudinally uniform arc structures in the optical records, changing relatively slowly with time, and the very good correspondence with simultaneously measured 2-D ab-sorption features. The optical emission and abab-sorption struc-tures are closely co-located and follow the general alignment with the magnetic L-shells, drifting with similar velocities and directions. The maximum absorption is generally south of the maximum 557.7 nm emission by as much as 0.5◦ lati-tude. During strongly disturbed conditions (on 9 November 1998, period (b)), on the other hand, there is still a general correspondence between optical and absorption signatures, the location and motion of their maxima, but we do not see any well-defined arc structures. Both optical and absorption signatures are much more complex and changing rapidly.
Cross-correlation of the time series of maximum absorp-tion and maximum green-line intensity in the common field of view appears to show a systematic delay of the absorption relative to the optical emission. The time delays are larger for highly disturbed conditions, of the order of 40 to 60 s in period (b), compared to the moderately active period (a) that indicates a time delay of the order of 10 to 20 s. Results for interval 20:00–21:30 UT in period (b) are less clear, however, the correlation coefficient is maximum close to zero lag but the curve is nearly flat up to lag 6 or so. The high correlation between these time series means that both instruments basi-cally record the same time variations on the same population of precipitating electrons, but in two different energy ranges. In all cases, high energy electrons responsible for the ab-sorption appear to come from deeper in the inner magneto-sphere, being accelerated and dispersed before precipitation. Lower energy electrons associated with the auroral forms and arcs appear to precipitate close to their mirror points and their optical signature is distributed in a relatively narrow region close to the L-shells. The corresponding absorption signature extents equatorward of the optical arc. The sharper edge of the optical feature faces the region of strong electric field and weak conductivity associated with the downward field-aligned current in the arc system. This sharp boundary lies equatorward for auroral forms in the eastward
electro-jet (evening sector) and poleward for those in the westward electrojet (morning sector).
Higher energy electrons must be the result of radial diffu-sion and acceleration processes in the plasma sheet, which may explain the equatorward spreading and complexity of the absorption regions. This can also explain the shift in the maximum absorption south of the maximum optical emis-sion. In early morning, moreover, we may be seeing two separated absorption regions associated with two different populations of higher energy precipitation, (1) poleward of the optical arc that may be associated with cps precipitation streaming from the morning sector “bps” plasma, and (2) the absorption region, equatorward of the optical arc, associated with electrons which entered the “cps” during substorm in the evening to midnight sector and drifted eastward under the combined effects of the gradient and curvature drifts and the convective E × B drift.
The major axis orientation, and the equivalent length and width of optical emission and absorption “patches” were sys-tematically determined. These patches are defined by the outermost closed contours around regions of enhanced ab-sorption or optical emission. Different features will have dif-ferent outer contour values and difdif-ferent peak intensities and, therefore, meaningful comparisons and statistics have to con-sider features with similar ratio, r, of the outer intensity level to its peak intensity. In this way, the estimated dimensions are independent of the peak intensities. For instance, ratios 0.4 < r < 0.6 will define the half-intensity patches enclosed by contours with intensity levels around 50% of their peak intensities. Histograms for all the r values show that small-scale structure is dominant for both instruments and two pe-riods. Actually, smaller size features are roughly associated with values of r > 0.6, while larger sizes are mostly asso-ciate with values of r < 0.6. The average length and width are very similar for the two periods and instruments, with val-ues of 95 km and 52 km for IRIS, and of 175 km and 70 km for DASI, in period (a); and with values of 92 km and 51 km for IRIS, and of 162 km and 62 km for DASI, in period (b).
Only a very small part of the total number of closed con-tours are associated with the half-intensity patches. Their average length and width are equal to 204 km and 132 km for IRIS and equal to 340 km and 137 km for DASI, in period (a); and equal to 125 km and 73 km for IRIS, and 180 km and 65 km for DASI in period (b). We are, therefore, observing shorter and thinner absorption and optical emission features during higher magnetic activity conditions.
Finally, the close coincidence between the centre of the major axes, the gravity centres, and the points of maximum intensity of the closed contours, in both IRIS and DASI im-ages, seems to indicate that most of the time the shapes of the auroral forms and absorption patches are nearly ellipti-cal. The major axis is generally at angles smaller than 50◦ from the east-west direction.
Acknowledgements. EISCAT is supported by the Suomen Akatemia (Finland), the Centre National de la Recherche Sci-entifique (France), the Max-Planck Gesellschaft (Germany),
the National Institute of Polar Research (Japan), Norges Al-menraitenskapelige Forksningrad (Norway), Naturretenskapliga Forskningsradet (Sweden), and the Particle Physis and Astronomy Research Council (UK). We thank Steve Maple at Lancaster University for the help in processing the IRIS data and for the generation of the quiet-day curves. We are also grateful for the IMAGE magnetometer data used in this paper which were collected as a German-Finnish-Norwegian-Polish project conducted by the Technical University of Braunschweig, and for the SAMNET magnetometer data which was provided by the Space Physics Group at the University of York (UK).
The Editor-in-Chief thanks a referee for his help in evaluating this paper.
References
Bradshaw E. G. and Lester, M.: SABRE observations of Pi2 pulsa-tions: case studies, Ann. Geophysicae, 15, 40, 1997.
Browne S., Hargreaves, J. K., and Honary, B.: An imaging riometer for ionospheric studies, Electronics and Communications, 7, 209, 1995.
Burns C. J., Howarth, W. G., and Hargreaves, J. K.: High-resolution incoherent scatter radar measurements during electron precipita-tion events, J. Atmos. Terr. Phys., 52, 205, 1990.
Carlson H. C. and Egeland, A.: The Aurora and the Auroral Iono-sphere, in: Introduction to Space Physics, (Eds) Kivelson, M. G. and Russell, C. T., Cambridge University Press, 1995.
Collis P. N., Hargreaves, J. K., and White, G. P.: A localised co-rotating auroral absorption event observed near noon using imag-ing riometer and EISCAT, Ann. Geophysicae., 14, 1305, 1996. de la Beaujardiere O., Vondrak, R., and Baron, M.: Radar
observa-tions of electric fields and currents associated with auroral arcs, J. Geophys. Res., 82, 5051, 1977.
del Pozo C. F., Hargreaves, J. K., and Aylward, A. D.: Ion composi-tion and effective ion recombinacomposi-tion rate in the nighttime auroral ionosphere, J. Atmos. Terr. Phys., 59, 1919, 1997.
del Pozo C. F., Turunen, E., and Ulich, T.: Negative ion composition in the auroral mesosphere during a PCA event around sunset, Ann. Geophysicae, 17, 782, 1999.
del Pozo C. F., Williams, P. J. S., Gazey, N. J., Smith, P. N., Honary, F., and Kosch, M.: Multi-instrument observations of the dynam-ics of auroral arcs: a case study, J. Atmos. Solar-Terr. Phys., in print, 2001a.
Egeland A. and Omholt, A.: A statistical study of Carl Stormer’s height measurements of aurora borealis, in: Aurora and Airglow, (Ed) McCormac B. M., Reinhold, N.Y., 143–158, 1967. Elphinstone R. D., Hearn, D. J., Cogger, L. L., Murphree, J. S.,
Singer, H., Sergeev, V., Mursula, K., Klumpar, D. M., Reeves, G. D., Johnson, M., Ohtani, S., Potemra, T. A., Sandahl, I., Nielsen, E., Persson, M., Opgenoorth, H., Newell, P. T., and Feldstein, Y. I.: Observations in the vicinity of substorm onset: Implications for the substorm process, J. Geophys. Res., 100, 7937, 1995. Haerendel G., Olipitz, B. U., Buchert, S., Bauer, O. H., Rieger, E.,
and La Hoz, C.: Optical and radar observations of auroral arcs with emphasis on small-scale structures, J. Atmos. Terr. Phys., 58, 71, 1996.
Hargreaves J. K., Chivers, H. J. A., and Axford, W. L.: The develop-ment of the substorm in auroral radio absorption, Planet. Space Sci., 23, 905, 1975.
Hargreaves, J. K. and Devlin, T.: Morning sector electron precipita-tion events observed by incoherent scatter radar, J. Atmos. Terr. Phys., 52, 193, 1990.
Hargreaves J. K., Browne, S., Ranta, H., Ranta, A., Rosenberg, T. J., and Detrick, D. L.: A study of substorm-associated night-side spike events in auroral absorption using imaging riometers at South Pole and Kilpisjarvi, J. Atmos. Solar-Terr. Phys., 59, 853, 1997.
Johnson M. L., Murphree, J. S., Marklund, G. T., and Karlsson, T.: Progress on relating optical auroral forms and electric field patterns, J. Geophys. Res., 103, 4271, 1998.
Kirkwood S. and Eliasson, L.: Energetic particle precipitation in the substorm growth phase measured by EISCAT and Viking, J. Geophys. Res., 95, 6025, 1990.
Kosch M. J., Hagfors, T., and Nielsen, E.: A new digital all-sky im-ager experiment for optical auroral studies in conjunction with the Scandinavian twin auroral radar experiment, Rev. Sci. Instru-ments, 69, 2, 578, 1998.
Kosch M. J., Honary, F., del Pozo, C. F., Marple, S. R., and Hagfors, T.: High resolution maps of the characteristic energy of precipi-tating auroral particles, J. Geophys. Res., 106, 28 925, 2001. Lester M., Hughes, W. J., and Singer, H. J.: Polarisation patterns of
Pi2 pulsations and the substorm current wedge, J. Geophys. Res., 88, 7958, 1983.
Lester M., Hughes, W. J., and Singer, H. J.: Longitudinal structure in Pi2 magnetic pulsations and the substorm current wedge, J. Geophys. Res., 89, 5489, 1984.
Ranta, A., Ranta, H., Rosenberg, T. J., Wedeken, U., and Stauning, P.: Development of an auroral absorption substorm: studies of substorm related absorption events in the afternoon-early evening sector, Planet. Space Sci., 31, 1415, 1983.
Ranta H., Ranta, A., Hargreaves, J. K., and Browne, S.: Localized absorption events in the afternoon sector, J. Atmos. Solar-Terr. Phys., 59, 891, 1997.
Rishbeth H. and Williams, P. J. S.: The EISCAT ionospheric radar: the system and its early results, Q. J. R. Astr. Soc., 26 478, 1985. Rostoker G., Akasofu, S-I., Foster, J., Greenwald, R. A., Kamide, Y., Kawasaki, K., Lui, A. T. Y., McPherron, R. L., and Russell, C. T.: Magnetospheric substorms – definitions and signatures, J. Geophys. Res., 85, 1663, 1980.
Rostoker G., Kamide, Y., and Winningham, J. D.: Energetic par-ticle precipitation into high-latitude ionosphere and the auroral electrojets, 3. Characteristics of electron precipitation into the morning sector auroral oval, J. Geophys. Res., 90, 7495, 1985. Stoker P. H., Mathews, M. J., and Scourfield, M. W. J.:
Coor-dinated measurements of auroral light intensities and riometric radio-wave absorption, Geophys. Res. Lett., 23, 641, 1996. Voronkov I., Friedrich, E., and Samson, J. C.: Dynamics of the
substorm growth phase as observed using CANOPUS and Su-perDARN instruments, J. Geophys. Res., 104, 28 491, 1999. Wolf R. A.: Magnetospheric configuration, in: Introduction to
Space Physics, (Eds) Kivelson, M. G. and Russell, C. T., Cam-bridge University Press, 1995.