HAL Id: hal-02972989
https://hal.archives-ouvertes.fr/hal-02972989
Submitted on 21 Oct 2020
HAL is a multi-disciplinary open access
archive for the deposit and dissemination of sci-entific research documents, whether they are pub-lished or not. The documents may come from teaching and research institutions in France or abroad, or from public or private research centers.
L’archive ouverte pluridisciplinaire HAL, est destinée au dépôt et à la diffusion de documents scientifiques de niveau recherche, publiés ou non, émanant des établissements d’enseignement et de recherche français ou étrangers, des laboratoires publics ou privés.
First archaeointensity results from Ecuador with rock
magnetic analyses and 14C dates to constrain the
geomagnetic field evolution in South America:
Enhancing the knowledge of geomagnetic field intensity
Emilio Herrero-Bervera, Stephen Athens, Evdokia Tema, Luis Manuel Alva
Valdivia, Pierre Camps, Alejandro Rodriguez Trejo
To cite this version:
Emilio Herrero-Bervera, Stephen Athens, Evdokia Tema, Luis Manuel Alva Valdivia, Pierre Camps, et al.. First archaeointensity results from Ecuador with rock magnetic analyses and 14C dates to constrain the geomagnetic field evolution in South America: Enhancing the knowledge of geomag-netic field intensity. Journal of South American Earth Sciences, Elsevier, 2020, 103, pp.102733. �10.1016/j.jsames.2020.102733�. �hal-02972989�
Published in Journal of South American Earth Sciences, vol 103, November, 2020. https://doi.org/10.1016/j.jsames.2020.102733
First archaeointensity results from
Ecuador with rock magnetic analyses and
14C dates to constrain the geomagnetic
field evolution in South America:
Enhancing the knowledge of geomagnetic
field intensity
E. Herrero-Berveraa, S. Athensb, E. Temac , d, L. M. Alva Valdiviae, P. Campsf, A.
Rodriguez Trejog.
aHawaii Institute of Geophysics and Planetology, Magnetic Materials and Paleomagnetic and Petrofabrics
Laboratory, University of Hawaii at Manoa, Honolulu, HI, 96822, USA
bInternational Archaeological Research Institute (IARII), Honolulu, HI, USA cDipartimento di Scienze della Terra, Universita` degli Studi di Torino, Italy. dALP- Alpine Palaeomagnetic Laboratory, Peveragno, Italy
eInstituto de Geofisica, Universidad Nacional Autonoma de Mexico (UNAM), Mexico fGéosciences Montpellier, CNRS and Université Montpellier 2, Montpellier, France
gCentro de Geociencias, Universidad Nacional Autonoma de Mexico-Campus Juriquilla, Queretaro, Mexico
ABSTRACT
Archaeomagnetic records from low-latitude sites are very scarce. Thus, the information about the geomagnetic field evolution in South America or Ecuador is sparse and more data are needed to constrain the field evolution in South America. In this study we present new absolute archaeointensity results from a set of 14C well-dated (i.e. calibrated ages)
prehistoric archaeological sites in northern Ecuador (South America). Potsherd fragments were sampled during archaeological excavations of 2 earthen mounds in the vicinity of Atuntaqui and Otavalo cities, and pits at La Chimba site. The pottery covers 2 distinct
archaeological periods defined as 1) Ecuadorian Formative period (700 BC – 1AD) and 2) the prehistoric Late period (1250–1505/1525 AD). Successful archaeointensity determinations were obtained from 56 sherds using the Thellier-Coe protocol and their rock magnetic properties. The absolute palaeointensity determinations have yielded AI values of 43.6 ± 1.3 μT for Atuntaqui, 34.2 ± 1.4 μT for the Otavalo Mound 3 (lower charcoal lens), 39.5 ± 1.4 μT for Otavalo Mound 3 (upper charcoal lens) and a range of absolute archaeointensities from 7.0 ± 0.97 μT up to 42.2 ± 2.06 μT, with a mean average of 21.20 ± 1.15 μT for La Chimba. Archaeointensity (AI) determinations of the successful mean abolute archaeointensity for the early phase (700–440BC) excavation levels 27.8 ± 1.315 μT, middle levels phase (440–
40BC), 15.07 ± 0.78 μT and the late levels phase (44BC-250AD) 25.52 ± 1.575 μT. These results are in good correlation with the data from Palpa in South Peru as well as a few data results from Colombia, South America.
1. Introduction
It has been known for several decades that archaeological artifacts can be reliable recorders of the Earth’s magnetic field behavior in the past (e.g. Eighmy and Sternberg, 1990; Shibuya, 1980; Aidona et al., 2010, Aguilar-Reyes et al., 2013). The archaeological baked clays can generally offer a better temporal and spatial resolution than volcanic rocks, mainly due to their precise 14C radiometric dating, and due to the fact that they can be found all around
the world without being limited to volcanic areas. The radiocarbon dating of the pieces of pottery of northern Ecuador highlands (Fig. 1) was carried out using charcoal remains, (e.g. maize, corn, organic food residues, Appendix A, Fig. 2), as well as pollen and volcanic ash, for Atuntaqui and Otavalo mounds (e.g. Athens and Osborn, 1974; Athens, 1999, 2003). The radiocarbon dating of La Chimba was based on Athens (1990)and Stahl and Athens (2001) where almost 40,000 specimens were recovered during excavations that started in 1972 at La Chimba site, Pichincha Province, Ecuador. A listing (including weights and counts) of all remains recovered from the 1989 investigations is provided in Athens (1990), including diagnostic ceramics. Identified macrobotanical remains at La Chimba include charred specimens of small maize cobs and kernels, two types of tubers (potatoes and oca), and seeds of quinoa, beans, and other unidentified types Potatoes, oca, and quinoa had not been previously identified in archaeological sites in the northern highlands (Athens, 1990). Fifteen radiocarbon determinations were obtained from TP-7 and appear to encompass the complete occupational history of La Chimba. Using absolute dates assigned to all levels based on a non-quantitatively determined best fit radiocarbon depth-age curve, it appears that initial occupation occurred sometime around 700 B.C. (2640 B.P. calibrated).
Occupation was apparently continuous until the site was abandoned around A.C. 250 (1700 B.P. calibrated). The ages of the different test units are summarized in Table 1and Table 2 of Athens (1990)which presents a generalized chronological scheme for the site (see Athens, 1978). La Chimba is at present the earliest known Ecuadorian ceramic period site north of Quito. Archaeomagnetic data, however, still remain sparse and very unevenly distributed in both time and space to well-describe and understand the pattern of the geomagnetic field’s secular variation (SV) over millennial timescales on a global scale (Valet et al., 2008; Pavon-Carrasco et al., 2014a; Panovska et al., 2015). For instance, very few data come from the southern hemisphere and less than 3% of the archaeointensity entries in the GEOMAGIA database (Brown et al., 2015) come from sites with latitudes between −10◦ and 10◦. In particular, archaeomagnetic data from South America are scarce, and in many cases, come from old studies that are characterized by scattering (Goguitchaichvili et al., 2019). Thus, in order to enhance, improve and contribute to the development of reliable global
geomagnetic field models, it is necessary to improve the spatial global coverage with well-dated and high-quality reference data (e.g. Pavon-Carrasco et al., 2014b). In this paper, we present a new set of absolute archaeointensity determinations from pottery collections recovered from three archaeological sites located at the highlands of north central Ecuador. The new results were obtained with the modified Thellier-Coe protocol that implies that instead of measuring the NRM first, we preferred to apply a TRM before heating the sample
in zero field (e.g. that Aitken et al., 1988, Valet et al., 1998, Herrero-Bervera and Valet, 2005, 2009; Herrero-Bervera et al., 2016), including partial thermoremanent magnetization (pTRM) checks that helps out to monitor possible magnetomineralogical alterations that can take place during experimental heating. The ages of the samples studied were determined through calibrated radiometric data and archaeological evidence based on diagnostic pottery. Only, a few previous available studies from Ecuador, data from neighboring Peru and Colombia covering the same time periods of our study are avaliable and were used for comparison with our new archaeointensity determinations. It is very important to point out that the archaeointensity results of this study will only be very useful and meaningful for the study of the evolution of the generation of the geomagnetic field at equatorial latitudes of ~11° North and for a time windows of our analysis (i.e. 700 BC-1 AD, 1250–1505/1525 AD, 700–440BC, 440–40BC and 44BC-250AD) and within a 600–700 km circle (e.g. Tema and Knodopoulou, 2011) and centered at the northen Ecuador sites correlatable to the Earth’s core generated signals. Beyond this circle (i.e. radius of 600–700 km) any attempt to
correlate to distant locations such as central America, Brazil, Argentina, Uruguay, Paraguay, Chile and Bolivia is meaningless due to the way the geomagnetic field is generated.
2. Archaeological sites and studied material
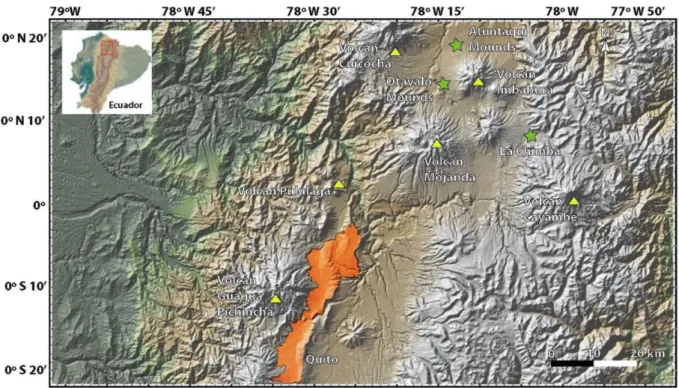
The potsherds studied come from three prehistoric archaeological sites situated in northern Ecuador (Fig. 1): Atuntaqui (Mound 30, Lat. 0.34◦ S, Long. 78.2◦ W), Otavalo (Mound 3, Lat. 0.24◦ S, Long. 78.3◦ W) and La Chimba (Test Pits 5 and 7, Lat. 0.14◦ S, Long. 78.0◦ W). The prehistoric Ecuadorian cultures excelled in the production of pottery, with each cultural phase being characterized by its own style. Therefore, the pottery can also be used as an important cultural marker (Athens, 1990, 1995, Aidona and Kondopoulou, 2012). The
Atuntaqui and the Otavalo sites belong to the prehistoric Late Period (1250–1505/1525 AD). This period is distinguished by large quadrilateral earthen mounds, which frequently are 100 m or more on a side and 10–20 m in height, and which often have long (over 100 m) ramp-like features on one side (Athens, 2003). The mounds are distributed in discrete clusters throughout the northern highland region, and some of them are quite large both in area and in the number of mounds. Surveys indicate that ramp mound sites are found in a range of contrasting and closely juxtaposed environmental zones defined by significant differences in elevation, temperature, and rainfall. Most sites, nevertheless, are clearly concentrated within the temperate inter-Andean valleys between the 2000 and 3000 m in elevation. At the Otavalo site, 4 mounds were found at a mean elevation of 2540 m, while at the Atuntaqui site, 33 mounds were found at a mean elevation of 2440 m (Athens, 2003). The Late Period was originally defined in the 1970s as a result of chronological information obtained from a series of radiocarbon dates at the Cochasquí site, the Otavalo site, the Pinsaqui site, and the Socapamba site (Athens, 1980, 1992). The dates for all sites fall after 1250 AD, while the date for the end of the period is the estimated time of the Inka conquest of the northern highlands, about 1505/1525 AD. Both studied sites of Atuntaqui and Otavalo are well dated and belong to this Late Period. In particular, the diagnostic red line crosshatch on buff pottery found at Atuntaqui (mound 30) confirm this age while radiocarbon dating on charcoal from the same mound gave a calibrated age of 1309–1450 AD at 1 sigma (519 ± 46 Athens, 2003). Pottery and radiocarbon dates obtained for the Otavalo site also confirm that the mounds pertain to the Late Period. Based on all the available chronological data, the
pottery studied from Atuntaqui (Mound 30) can be dated at 1309–1450 AD, the pottery studied from Otavalo (Mound 3) can be dated at 1209–1390 AD for the Lower charcoal lens and at 1263–1394 AD for the Upper charcoal lens (Athens, 2003). (Appendix A).
The age of the La Chimba site is much earlier, and belongs to the early ceramic period (700 BC- 250 AD). It is located at the 3180 m elevation in northeastern Pichincha Province (near Olmedo). The site contains 3 m of well-preserved and stratified occupation deposits. Fifteen radiocarbon dates indicate that these deposits span a period from 700 BC to about 250 AD (Stahl and Athens, 2001). A finely detailed pottery chronology has been established based on the numerous distinctive pottery types found in the site. Three main subperiods are
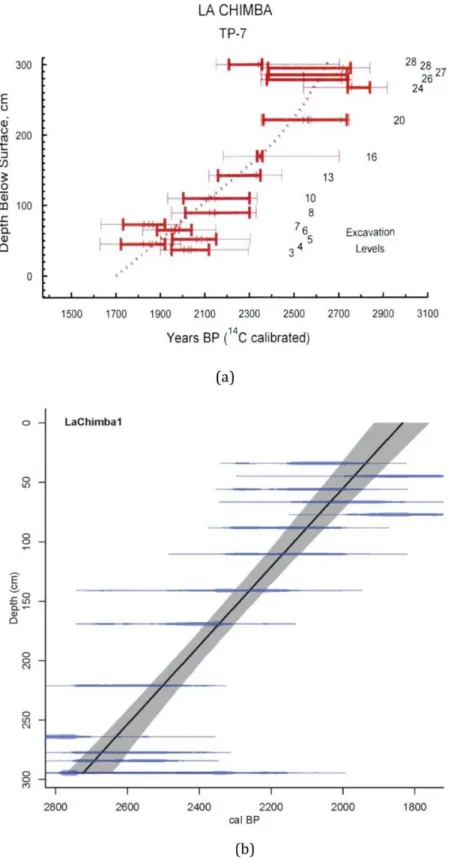
recognized based on the most conspicuous pottery changes. The major subperiods are presented in Stahl and Athens (2001), and basically consists of an Early La Chimba Phase (700–440 BC), a Middle La Chimba Phase (440–44 BC) and a Late La Chimba Phase (44 BC-250 AD). The pottery studied here corresponds to different stratigraphic levels. Several radiocarbon calibrated ages are available for the different levels that have made possible the calculation of a polynomial regression date model for the La Chimba excavation site levels (Athens, 1995; Stahl and Athens, 2001). More information about the available radiocarbon ages and the dating of the sites is given in Appendix Aand Table 1.1 published by Athens (1995). Fig. 3a, shows the depth below the surface versus the ages of La Chimba site (Athens, 1995; Stahl and Athens, 2001), calibrated ranges for each date are depicted with both one (thin horizontal line) and two (thick horizontal line) standard deviation ranges, along with intercepts. A best fit curve, a suggested interpretation for the interpolated age of each excavation level, has been superimposed on the date ranges, taken from Athens (1995) and Stahl and Athens (2001). Fig. 3b is a depth versus age (BP) polynomial regression date model for the La Chimba excavation site levels in question (see also Table 1). Radiocarbon calibrations are from clam program (Blaauw, 2010; Supplement) based on a linear regression depth-age model, using a mean depth below the ground surface of each excavation level. For each site, several pottery fragments were collected with dimensions varying from 2 to 10 cm (Fig. 2). From each fragment several specimens were prepared for rock magnetic
investigations and archaeointensity experiments. About one third of the potsherds studied were of grey and black colors, which indicate that the pottery was burned under a reducing atmosphere (Fig. 2a). The other two thirds of the potsherds were reddish, indicating that the burning was probably generated during firing under oxidizing conditions (Fig. 2b). For the archaeointensity experiments, specimens were cut in 1 cm3 cubes and, were prepared for
the absolute archaeointesity determinations.
3. Magnetic mineralogy
The magnetic mineralogy of representative samples were investigated at the
Paleomagnetics and Petrofabrics Laboratory of the Hawaii Institute of Geophysics and Planetology (HIGP)-SOEST University of Hawaii at Manoa (Honolulu, Hawaii), at the CIMaN-ALP Paleomagnetic laboratory (Peveragno, Italy), and at the Geophysics Institute of the University of Mexico (UNAM, Mexico).
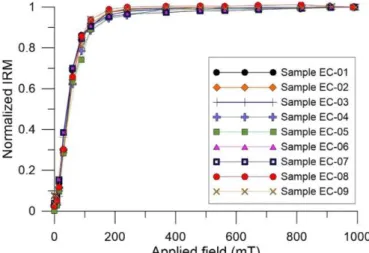
Isothermal remanent magnetization (IRM) curves were obtained after imparting a stepwise increasing direct field with an ASC pulse magnetizer up to 1 T and measuring the remanent magnetization on a JR6 magnetometer. Thermal demagnetization experiments for a
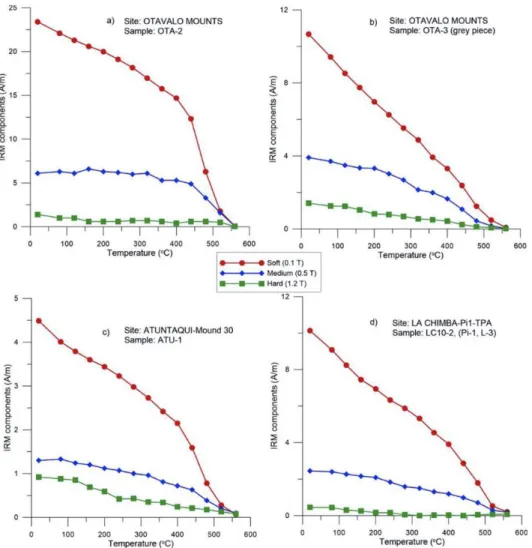
composite three-axis IRM experiment (Lowrie, 1990) were also performed by first applying a maximum field of 1T along the z axis, then an intermediate field of 0.5 T along the y axis, and
finally a minimum field of 0.1 T along the x axis of the samples. Thermomagnetic curves of continuing monitoring of the low-field susceptibility versus temperature (k-T) experiments were conducted in air using a MFK-1 Kappabridge (Agico) equipped with a CS-3 attachment. The specimens were progressively heated from room temperature up to 700 ◦ C and
subsequently cooled down to room temperature. Hysteresis measurements were performed with a variable field translation balance (VFTB) up to 1.2 T. Saturation remanent
magnetization (Mr), saturation magnetization (Ms), and coercive force (Hc) were calculated after removing the paramagnetic contribution. The hysteresis loops and the back-field demagnetization curves of the saturation isothermal remanent magnetization (SIRM) were determined. First order reversal curves (FORCs, e.g. Pike et al., 1999; Pike and Verosub, 2000) were performed for representative samples of the four sites in question.
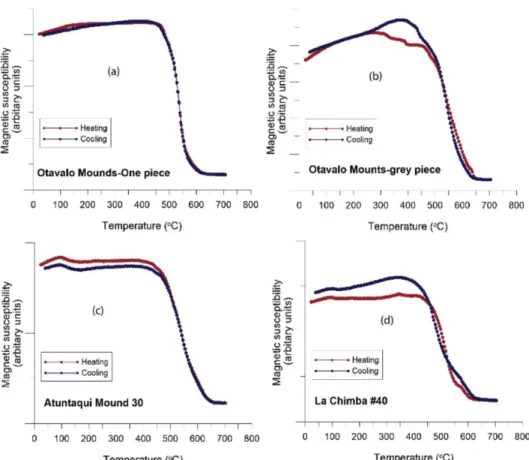
The IRM curves obtained for representative samples from the three sites show the presence of a low-coercivity mineral that gets saturated in fields of around 0.2–0.4 mT (Fig. 4). Such results are confirmed by the thermal demagnetization of a three-axis IRM that also indicates the dominance of a low-coercivity component (Fig. 5). An intermediate magnetic component was also noticed, while the high-coercivity component was generally very low, this The high coercivity low unblocking temperature phase might be correlated to the HCSLT (high
coercivity, thermally stable, low Curie temperature) phase documented in several
archaeological features from different parts of the world (e.g., Lopez-Sanchez et al., 2017; Calvo-Rathert et al., 2019) imparted IRM was completely canceled at temperatures of around 520 ◦C–560 ◦C, indicating the presence of a magnetite-type mineral. In some
samples, a decrease of the high-coercivity component can be noticed at around 240 ◦C (Fig. 5 c and 5d).
The thermomagnetic curves generally have very similar heating and cooling patterns
suggesting that the studied samples are thermally stable (Fig. 6). In some cases, mainly from the La Chimba site (Fig. 6d), the curves are not completely reversible, with the heating curve being lower than the cooling one. This indicates that some magnetic changes may have occurred during heating.
The Curie temperatures are around 550 ◦C–575 ◦C and indicate predominantly the Curie temperature of magnetite. In addition to magnetite, there are other magnetic mineral phases as can be seen from the Curie point diagrams such as pyrrhotite (Tc = 320 ◦C, Fig. 6 b and d)), goethite (Tc = 120 ◦C, Fig. 6 c and d) Ti-poor magnetite (Tc = 550 ◦ C), Ti-maghemite (Tc = 600–620 ◦ C), Ilmenite, and Ti-hematite (Tc = 620–680 ◦C, see Fig. 6a, b ,c, d). These primary and secondary magnetic mineral phases are shown in the microphotographs of Fig. 7.
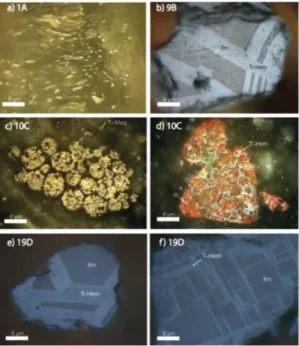
3.1. Microscopic observations under reflected light
Microscope optical inspection of four polished sections corresponding to selected pottery fragments permitted an estimation of oxide mineral concentration subdivided into fractions of titanomagnetite (Ti-Mag), titanohematite (Ti-Hem), and titanomaghemite (Fig. 7). The classification of Buddington and Lindsley (1964)was applied for textures and the method of Haggerty (1976)was used to determine oxidation states.
The results can be summarized as follows: Ti-Mag shows anhedral to subhedral texture with ilmenite lamellas. There is a small content of (titano)maghemite and a large Ti-Hem content. Ti-Mag seems to be the main magnetic carrier. However, it is not homogeneous with
ilmenite intergrowths showing a light grey-brown color, sometimes fractured or with a brecciated texture. The general characteristics of magnetic mineralogy show a deuteric oxidation of degree C1 and C3 (Haggerty, 1976) and a possible light hydrothermal alteration. Observations under the microscope suggest that Ti-poor Ti-Mag (almost magnetite) is the dominant magnetic carrier. Although Ti-Hem and Ti-Mag are observed, their contributions in remanent magnetization should be minor. Here, we would like to underline the importance of the microscopy study to estimate the origin the remanence. Draeger et al. (2006) showed that there are no proven magnetic tests to distinguish between thermoremenent and
chemical remanence, while the microscopic observation under reflected light is probably the best way to discriminate between primary (TRM) and secondary (CRM) magnetizations. The titanomagnetite-ilmenite intergrowth of the trellis or sandwich form is the principal feature of the studied samples. This texture type is commonly developed during deuteric oxidation, which occurs at temperatures higher than the Curie points of main magnetic carriers. Thus, the magnetization measured is thermoremanent in origin.
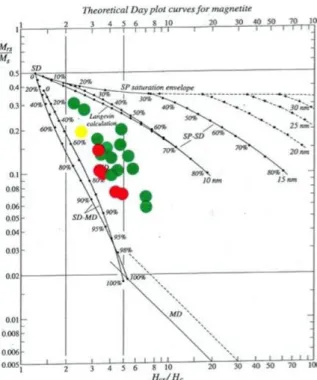
3.2. Magnetic granulometry-hysteresis curves
The hysteresis parameters plotted in a modified Day et al. (1977)plot (Fig. 8) have a wide range of values, but the results mostly cluster within the pseudo-single domain (PSD) range of magnetite, according to the plots for pure magnetite (Dunlop, 2002b).
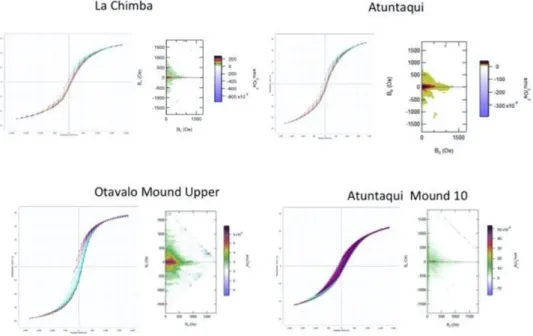
3.3. First order reversal curves (FORCs)
First order reversal curves (FORC) were performed on representative samples from
Atuntaqui, Otavalo mounds as well as from La Chimba sites. Such curves are commonly used to characterize coercivity and grain-size distributions in ferromagnetic minerals (e.g.
Mayergoyz, 1986; Pike and Verosub, 2000; Roberts et al., 2000, 2014, 2017). FORC diagrams were calculated on four specimens with variable magnetic grain sizes as can be seen from the modified Day diagram (see Fig. 8) using an upgraded Variable Field Translation Balance (VFTB). A number of FORCs, ranging from 20 to 80 (hysterons) have been obtained from each specimen to generate a single FORC diagram. FORC analyses were performed to study the domain type, composition and magnetic granulometry of four representative specimens from the Ecuador collection of pot sherds. In general terms the archaeomagnetic specimens of the pieces of pottery are relatively complex, and yield a mixture of diverse types of single domain (SD), pseudo-single domain (PSD), i.e. in the single vortex state (Zhou et al., 2017; see Fig. 9) as well as multi-domain (MD) particles. These hysteresis loops are the result of a mixture of various magnetic phases as well as domain states (e.g. Roberts et al., 1995, 2017; Tauxe et al., 1996). The results of the magnetic granulometry shown in Fig. 8are about wasp-waisted loops (i.e. 80% of them). The four FORC diagrams (Fig. 9) display a large vertical spread (along the Bu axis) with peak distributions usually around below the Bu = 0 axis and ranging from ± 500 Oe (i.e. 50 mT). The Ecuador samples have FORC diagram contours closing around a peak that occurs at coercivities (Bc axis) between 0 and 1200– 1300 (Oe, i.e. 120-130 mT) (see Fig. 9).
Closed contours and a symmetric vertical profile (along a section parallel to the Hu axis), are typical features of interacting single-domain (SD) grains (Roberts et al., 2000). In summary the magnetic particle size distribution is characterized by a combination of SD and MD particles indicating a PSD behavior (i.e., in the single vortex state, Zhou, et al., 2017, see Fig.
9)) as depicted in Fig. 8. The predominant magnetic mineral phase is low-coercivity magnetite as is shown in Figs. 4–7, which is supported by the results of the magnetic granulometry and FORCs experiments as well.
4. Archaeointensity determination
Paleointensity (PI) experiments were performed at the SOEST-HIGP Magnetic Materials, Paleomagnetics and Petrofabrics Laboratory at the University of Hawaii at Manoa (Hawaii, USA). A total of 58 pottery specimens were analyzed using the Coe version (Coe, 1967) of the classical Thellier and Thellier method. However, instead of measuring the NRM first, we preferred to apply a TRM before heating the sample in zero field (Aitken et al., 1988; Valet et al., 1998; Herrero-Bervera and Valet., 2005, 2009; Herrero-Bervera and Acton, 2011;
Herrero-Bervera, 2015; Herrero-Bervera et al., 2016). In this case, magnetomineralogical transformations occur in the presence of a field, resulting in a CRM (chemical remanent magnetization) component which is detected by a deviation of the NRM toward the oven field direction. Each heating step (beyond 100 ◦C and up to 570 ◦C) was accompanied in most of the cases by a pTRM check usually at the previous lower temperature step. The
experiments were conducted in a Pyrox oven with a capacity of 80 samples. Heating control was carried out by three external thermocouples and accurate temperature control
monitored by three additional thermocouples located close to the samples. Cooling was performed by sliding the heating chamber away from the hot specimens chamber as well as passing water and air in the sample holder with the specimens in it. Measurements were done using a JR-5 Spinner magnetometer (i.e. for the NRM, thermal demagnetization and for the absolute paleointensity measurements) in the shielded room of the SOEST-HIGP
Magentic Materials, Paleomagnetic and Petrofabrics laboratory. Each series of experiments was carried out on fifty eight 1-cm3 samples positioned a few millimeters away from each
other within the oven. The magnetization level of the samples, was too low to expect significant interactions between adjacent samples, and effectively no remagnetization was observed in the demagnetization diagrams of the NRM, except those caused by subsequent magneto-mineralogical transformations in the presence of a field.
Representative Arai plots are shown in Figs. 10 and 11together with the evolution of the NRM during thermal demagnetization. The paleointensity results have been summarized in Table 1for the 56 potsherds that have yielded successful archaeointensity determinations (AI). Therefore, we have selected Arai diagrams with various configurations. In most cases, samples from the northern Ecuador potshards exhibit a linear slope over the same range of unblocking temperatures as those that were used to define the characteristic direction of magnetization. This illustrates the importance of considering the entire vector in the
interpretation of the Arai diagram. In a number of cases some pTRM checks deviate minutely and negatively, but not very significantly, from the original TRM and must thus be
considered as marginally negative and had to be rejected. This is the case for a few samples which exhibit at least two negative checks. In some other specimens only one pTRM check is slightly negative. Samples from which pTRM checks were only slightly negative, were further examined, taking into consideration other criteria such as the linearity of the Arai diagrams and the magnetic stability of the vectorial plots. In all cases of the accepted samples, it is striking that all data points define an excellent linear NRM-TRM segment over the entire temperature spectrum that is associated with the decay of the NRM. Apart from some small deviations of the checks, there would be no major reason to rule out such samples and there
is no ambiguity regarding the determination of their NRM-TRM slope. For the samples with positive pTRM checks, the magnetic mineralogy is dominated by magnetite with a narrow range of high unblocking temperatures (see Figs. 4–9). Note that these determinations point out the importance of performing in principle pTRM checks at all steps of the experiment. As mentioned above, the large deviations observed in some rejected samples are mostly observed at samples characterized by different magnetic phases such as titanomagnetite and/or some maghemite, (i.e. other minerals than pure magnetite). The relative proportion of single domain magnetite with high blocking temperatures can be roughly estimated by the amount of magnetization remaining above temperatures exceeding 400◦-500 ◦ C. (e.g. Herrero-Bervera and Valet, 2009; Herrero-Bervera, 2015; Herrero-Bervera et al., 2016). There is a clear relationship between the complexity of the mineralogy and the fidelity of the paleointensity experiment for the northern Ecuador samples. It is important to point out that this magnetic mineralogy characteristic is consistent with the large success rate of the archaeointensity studies because the magnetization of the archaeomagnetic materials is mostly dominated by a unique mineral such as Ti-poor magnetite (e.g. Valet et al., 2010, see Fig. 10 for instance).
Various methods have been suggested thus far to select the appropriate data for the best absolute archaeointensity (AI) interpretation of the results despite the fact that much
debate questions what constitutes acceptable absolute paleointensity determinations. In the best of cases, it is necessary for the samples in question to have reversible Curie point
determination curves, that in a certain way, gives evidence that no apparent
magnetomineralogical changes/alterations have occurred during the laboratory heating procedure. Moreover, samples have to be characterized by an admixture of Pseudo Single and Single Domains (PSD/SD) magnetic grain sizes, see Figs. 4–9. The ideal case is to have the majority of the magnetic grain sizes characterized by Single Domain (SD) grains to have a high success rate of AI determinations. As it can be observed from the magnetic grain sizes diagram of Fig. 8, the great majority of the Ecuadorian specimens are in the PSD range and close to the Super Paramagnetic (SP) theoretical envelope of Dunlop (2002a), Dunlop and Ozdemir (1997); also a very few samples are situated around the SD-Multidomain (MD) area. For the selection of the successful Ecuadorian AI results, we have followed here three
fundamental criteria: (1) The characteristic (primary) remanent magnetization component must decay to the origin of the vector demagnetization diagram (e.g. see univectorial demagnetization diagram of Fig. 10), (2) The slope of the line in Arai plots must be linear over the temperature range where the primary Thermo-Remanent Magnetization (TRM) is resolved and (3) the partial TRM (pTRM) checks must not deviate significantly from the TRM on sequential temperature steps (e.g. see Figs. 10 and 11) as defined by NRM factor (%) which represent the NRM fraction of the linear TRM-NRM portion that has been considered for calculation of archaeointensity (see Table 1) (e.g. Herrero-Bervera and Valet, 2005, 2009, Valet et al., 1998, Herrero-Bervera et al., 2016).
The first criterion is used in various forms in current paleointensity studies (e.g., Perrin and Shcherbakov, 1998; Zhu et al., 2001). Any deviation from the demagnetization path from the origin of the vector demagnetization diagrams introduces a significant uncertainty in the determination of paleointensity, as it reflects failure to isolate the primary TRM. When plotted in sample coordinates, the evolution of the NRM direction also gives crucial information about possible deviations caused by the CRMs that have unblocking
temperatures higher than the last heating step. Samples that exhibited remagnetization during heating in the presence of the field are characterized by large directional swings of
the remaining NRM towards the direction of the applied field. In the Ecuadorian
archaeointensity study this was the case for a few rejected samples (i.e. four specimens) for the analyses of the AI determination. This criterion is probably particularly effective as a consequence of our protocol that requires that the laboratory TRM acquisition precede demagnetization in zero field. The demagnetization diagrams are also important for
determining the temperature range over which the primary TRM has been isolated. Samples in which a significant part of the stable TRM is carried by single domain (SD) grains of
magnetite generally are less affected by large viscous components, low-temperature
overprints, or other sources of overprints. In such cases, a significant percentage of the total NRM intensity remains after removing any viscous components or overprints, allowing the primary TRM to be resolved along the linear demagnetization paths that trend to the origin of vector demagnetization diagrams, and allowing the viscous or overprinted temperature range to be avoided in Arai plots.
The second criterion is to retain only Arai plots with a single linear slope within the
temperature range that lies above the viscous domain. We have required that the fit of the line must be better than R = 0.98 as depicted in the Arai plots of Figs. 9 and 10of a high percentage of the fifty six successful paleointensity determinations. Due to our selection rules, the averaged number of points used for slope determination amounts to 17 and never less than 9 (see Table 1) and the best “f” (NRM fraction of Coe et al., 1978) parameters are always greater than 75% percent (see Table 1). In our case the “f” parameter is up to ~96. It is important to point out that this parameter is meaningless when there is a strong viscous low-temperature component with an opposite direction to the characteristic remanence, which is not the case for the samples in question and when the average quality factor lies much beyond the limits of quality factor 1 or 2 that are usually required. In the case of the Ecuador samples the quality factor ranges between 7.7 up to 33 (see Table 1). The mean value of the gap ratio (see Table 1, gap factor of Coe et al., 1978) measuring the relative uncertainty on the definition of the best-fit line is almost twice weaker than the acceptable limit of 0.1 (see Selkin and Tauxe, 2000); the range of the gap factor is from 0.002 up to 0.9 for this study.
Finally, the third criterion rejects the results if the pTRM checks were consistently negative: that is they differ significantly from the initial TRM on several sequential temperature steps. Different investigators use different cutoff values for what they consider significant, and often base their rejection on single pTRM checks. Here, pTRM checks were considered to be negative when they deviated by more than 5% from the initial TRM, and they did so on sequential temperature steps. We believe that such cutoffs applied to single temperature steps are somewhat arbitrary when pTRM checks are performed systematically after nearly every heating step. Small deviations of the pTRM checks from the initial TRM can be caused by mineralogical transformations or by experimental uncertainties. In the first case, the subsequent thermal steps will typically be systematically accompanied by progressively larger deviations, which confirms that the sample must be rejected. In the second case, subsequent checks will not be negative, and hence a reliable paleointensity determination may be obtained over the temperature interval. Generally, samples that failed the second or third criterion had already notably failed the first criterion, which is the most effective data selection criterion.
The detailed results of our successful archaeointensity determinations are given in Table 1 together with their statistical parameters. It worth noticing that the success rate of our experiments was very high, obtaining successful results from fifty six out of the sixty studied
specimens. Low-field susceptibility vs temperature (k-T), SIRM, Curie point determinations, magnetic grain sizes, FORCs, microscopic magnetic mineralogy and vector demagnetization diagrams, as well as the summarized AI results given in Table 1, attest for the best results of the experiments we have conducted on the potshards from Ecuador. There were four
specimens rejected because they failed the selection criteria imposed on all samples studied. Another possibility that cannot be ruled out is that the rejected samples were affected by a partial self-reversal thermoremanent magnetization (SRTRM) observed on these samples (e.g. Roperch et al., 2012), from the variable chemical phase separations during the quench and annealing of metastable ferri-ilmenite compositions, due to inhomogeneous Fe–Ti ordering and anti-ordering (e.g. Robinson et al., 2014).
4.1. Anisotropy and cooling rate corrections
Pottery is generally considered to be highly anisotropic and therefore it is important to take into consideration the possible magnetic anisotropy effect on the AI determination (e.g. Aitken et al., 1981; Chauvin et al., 2000; Fox and Aitken, 1980; Veitch et al., 1984; Alva-Valdivia et al., 2010; Fanjat et al., 2103; Stark et al., 2009). According to the literature, several approaches have been proposed for evaluating and eventually correcting such effect since an error will be introduced in the determination of the archaeointensity. Among those, probably the calculation of the anisotropy of thermoremanent magnetization (ATRM) is the most precise and therefore the most recommended. For this reason, ATRM measurements were carried out at the Paleomagnetics and Petrofabrics Laboratory of the SOEST-HIGP of the University of Hawaii, by inducing a pTRM in six sample directions (i.e. +x, +y, +z, − x, − y, − z). In order to correct this bias, it is necessary to determine the anisotropic tensor for each sample, (Chauvin et al.; (2000)). Therefore, we proceeded to correct our archaeointensity measurements by means of the anisotropy of TRM. The anisotropy-TRM (A-TRM) tensor (T) was determined at 400 ◦C. The specimens under question were remagnetized at this
temperature in the six directions as mentioned above (i.e. +x, +y, +z, − x, − y, − z). All archaeointensity values were corrected for the A-TRM according to Veitch et al. (1984) method, which first calculates the direction of the ancient field (Fanjat et al., 2013), the correction factors range from 0.96 up to 1.4 and we used the software pmagpy-4.2.24.1 of L. Tauxe.
For the past four decades it has been known from both the theoretical as well as the experimental view points, that there are effects associated with cooling rates on the acquisition of TRM (Aitken, 1980; Dodson and McClelland, 1980, McClelland-Brown, 1984; Neel, 1955, Walton, 1980). Such research works have indicated that a misjudgment of archaeointensity results from differences in the cooling rates. These results imply that the influence of non-interacting single-domain particles yield effects of higher TRMs subsequent to slower cooling runs. Furthermore, when there are muti-domain particles then there is a lower acquisition of TRMs. The effect of the cooling rate on the TRM intensity acquired was also determined and seems relatively low on our samples, with standard deviations lower than 3% of the average value. We performed slow (~9 h) and fast cooling experiments (~2 h) following the protocol applied by Chauvin et al., (2000), Alva-Valdivia et al. (2010), Tema et al. (2012), Aguilar –Reyes et al. (2013), Fanjat et al. (2013) and Herrero-Bervera (2015). The results of such corrections are reported in Table 1.
5. Discussion
We present here new, well-determined absolute paleointensity results from three archaeological sites from Ecuador. The new data come from precisely dated pottery, and therefore offer a very valuable set of information about the past intensity variation in
Ecuador. At the same time, they enrich the global reference data from low-latitude sites that are still very scarce worldwide.
The new estimated average archaeomagnetic absolute paleointensities obtained in this study of 43.6 ± 1.3 μT for Atuntaqui, 34.2 ± 1.4 μT for the Otavalo Mound 3 (lower charcoal lens), 39.5 ± 1.4 μT for the Otavalo Mound 3 (upper charcoal lens) and a range of absolute archaeointensities from 7.0 ± 0.97 μT up to 42.2 ± 2.06, with a mean average of 21.20 ± 1.15 μT according to the stratigraphic levels for La Chimba (see Fig. 13and Table 1) after the anisotropy-TRM and cooling corrections were applied.
There are no previously published data from Ecuador, contemporaneous to our sites, that could be used to compare our new results (GEOMAGIA50. v3.3, Brown et al., 2015). Up to now, to our knowledge, the only available archaeointensity records from Ecuador come from much older archaeological sites, dated around 2000 BC (Kitazawa, 1968; Bowles et al., 2002) and therefore cannot be used for comparison. For this reason, we have used available archaeointensity records from nearby Ecuadorian countries, such as Peru and Colombia. Even though such data may come from distances of more than 1000 km away (around 1200 km, see Fig. 12), we have still used them for comparison, as no other data are available so far. Data from Peru and Colombia belonging to the last three millennia were collected from the updated version of the GEOMAGIA database (http://geomagia.gfz-potsdam.de/geomagi av3/AAquery.php) and are plotted in Fig. 13together with our new absolute
archaeointensity results, including the results from Stark et al. (2009).
The new archaeointensity results from Otavalo (lower charcoal lens) are in very good agreement with contemporaneous data from Colombia, showing Virtual Axial Dipole Momnet (VADM) values of around 8 × 10²² Am2. Data from Otavalo (upper charcoal lens)
and Atuntaqui fit well with other data from Peru (e.g. Stark et al., 2009), even though the available archaeointensity data from Peru are generally quite dispersed (Fig. 13). The three new intensity records from Otavalo (upper and lower lens) and Atuntaqui, indicate an increase of the geomagnetic field’s strength from the 12th to the 13th century AD that is in agreement with the trend shown by the Peru data that indicates high intensities around 1400 AD.
The mean archaeointensity value obtained for La Chimba site shows a quite low VADM value of around 5 × 10²² Am2. That is however in excellent agreement with one contemporaneous
record from Peru (Stark et al., 2009) that also shows low intensity for this time period. It is worth mentioning that the dating interval available for the La Chimba site is quite large (from 700 BC to 250 AD) but still, if the mean age and the mean intensity value are considered, it confirms low intensity values at around the 2nd-3rd centuries BC. Taking advantage of the radiocarbon dating model available for the various stratigraphic levels of the La Chimba site, we have also tried to plot the archaeointensity values obtained for the La Chimba pottery coming from the different stratigraphic levels towards the single levels dating (see Fig. 3a and b and Fig. 14).
To do so, we have used the dates obtained according to the best-fit model based on the radiocarbon datings (see Fig. 3b). The La Chimba site shows general low intensity values, even though some dispersion and some levels with higher intensity can be also observed (Fig. 14). The observed dispersion is probably due to the very small number of pottery
fragments available for some levels or to the levels dating that is based on radiocarbon dating of charcoals and not on the dating of the pottery sherds themselves. Nevertheless, the low intensity values around 300 BC are still clearly observed while a general trend of intensity increase can be noticed towards the 1st century BC (Fig. 13). In order to have a better estimate of the archaeofield at La Chimba we have decided to calculate the break down of the excavation levels of the successful mean abolute archaeointensity
determinations for the early phase (700–440BC) excavation levels 27.8 ± 1.315 μT, middle levels phase (440–40BC), 15.07 ± 0.78 μT and the late levels phase (44BC-250AD) 25.52 ± 1.575 μT, see Fig. 14 and Table 1.
6. Conclusions
The studied Ecuadorian ceramics proved to be excellent recorders of the past geomagnetic field, rendering successful archaeointensity determinations with a high success rate. The samples collected from the three different archaeological sites were well dated by means of radiocarbon techniques (Appendix A, Fig. 3) and can therefore be used as reference points for enriching our knowledge of the past Earth’s magnetic field intensity secular variation at low latitudes (i.e. equatorial latitudes). Furthermore, they are the first published
archaeointensity data from Ecuador for the last three millennia. The new results show a good agreement when compared to the other available data from Peru and Colombia. However, the available reference intensity data so far from these countries generally show great dispersion that makes difficult to arrive to clear assumptions about the geomagnetic field’s strength behavior in this area of South America mainly because of AI data close to our sampled sites. Unfortunately, the global geomagnetic field models cannot help either, as they are based on an extremely low number of reference data from low latitudes, and they are clearly biased towards Europe (Korte and Constable, 2011). Undoubtedly more data are still required to better understand the Earth’s magnetic field at low latitudes, particularly from the South American continent.
Declaration of competing interest
The authors certify that they have NO affiliations with or involvement in any organization or entity with any financial interest (such as honoraria; educational grants; participation in speakers’ bureaus; membership, employment, consultancies, stock ownership, or other equity interest; and expert testimony or patent licensing arrangements), or non-financial interest (such as personal or professional relationships, affiliations, knowledge or beliefs) in the subject matter or materials discussed in this manuscript.
Acknowledgements
We are pleased to thank Mr James Lau for his assistance during the laboratory experiments. Professor Manuel Calvo Rathert read and critically reviewed the manuscript suggesting corrections, upgrades and improvements that made the manuscript much better than the original version of the article, we thank him for his help. We also thank in advance two anonymous referees for their very constructive, “spot on”, sharp criticisms and overall help. Data reduction was mainly processed using the Paleomac software from Jean-Pascal Cogné (Cogné, 2003). Financial support and laboratory maintenance and measurements were
supported by SOEST-HIGP and the National Science Foundation grants to E-HB. These are SOEST11092, HIGP 2418contributions.
Appendix A. Supplementary data
Supplementary data to this article can be found online at https://doi.org/10.1016/j.jsames.2020.102733.
Author statement
E. Herrero-Bervera conceived the project, wrote most of the paper in the submitted form, performed the archaeointensity determinations, calculations and most of the figures of the manuscript as well as the anisotropy and cooling experimental laboratory work. Evdokia Tema, did laboratory work related to some rock magnetic properties of the
potsherds as well as writing of the archaeology part of the manuscript.
Stephen J Athens, collected the archaeological pieces, did the entire 14C dating as well as
calculation of the radiocarbon ages and provided logistical assistance to make the project a reality as well as the proper pieces for the study. Pierre Camps, performed the 14C
calculations to generate the age model, laboratory experiments of the magnetic mineralogy as well the selection of the excavation specimens for AI determinations and the setup of the anisotropy corrections for the study. Luis Alva Valdivia performed the microscopic
determinations of all the samples used for the study. Also contribute to the anisotropy corrections. Alejandro Rodriguez Trejo, performed the tensor analyses results using the L. Tauxe software of the anisotropy corrections of the entire study. All the authors contribute to the final writing and interpretation of the AI results of the study.
References
AGUILAR REYES,B.,GOGUITCHAICHVILI,A.,MORALES,J.,GARDUN ̃O,V.H.,PINEDA,M.,CARVALLO,C., GONZ ́ALEZ MORAN,T.,ISRADE,I.,CALVO RATHERT,M.,2013.AN INTEGRATED ARCHEOMAGNETIC AND C14
STUDY ON PRE-COLUMBIAN POTSHERDS AND ASSOCIATED CHARCOALS INTERCALATED BETWEEN HOLOCENE LACUSTRINE SEDIMENTS IN WESTERN MEXICO: GEOMAGNETIC IMPLICATIONS.J.GEOPHYS.RES.B118,2753– 2763. HTTPS://DOI.ORG/10.1002/JGRB.50196,2013.
AIDONA,E.,KONDOPOULOU,D.,2012.FIRST ARCHAEOMAGNETIC RESULTS AND DATING OF NEOLITHIC
STRUCTURES IN NORTHERN GREECE.STUDIA GEOPHYS.GEOD.56 HTTPS://DOI.ORG/10.1007/ S11200-011-9006-8. AIDONA,E.,KONDOPOULOU,D.,ALEXANDROU,M.,IOANNIDIS,N.,2010.ARCHAEOMAGNETIC STUDIES IN KILNS FROM NORTHERN GREECE.BULL.GEOL.SOC.GREECE XLIII(4),1888–1897.
AITKEN,M.J.,ALCOCK,P.A.,BUSSELL,G.D.,SHAW,C.J.,1981.ARCHEOMAGNETIC DETERMINATION OF THE PAST GEOMAGNETIC INTENSITY USING ANCIENT CERAMICS: ALLOWANCE FOR ANISOTROPY.ARCHEOMETRY2353– 64.
AITKEN,M.J.,ALLSOP,A.L.,BUSSELL,G.D.,WINTER,M.B.,1988.DETERMINATION OF THE INTENSITY OF THE
EARTH’S MAGNETIC DURING ARCHAEOLOGICAL TIMES: RELIABILITY OF THE THELLIER TECHNIQUE.REV. GEOPHYS.26,3–12.
ALVA-VALDIVIA,L.M.,MORALES,J.,GOGUITCHAICHVILI,A.A.,POPENOE DE HATCH,M.,HERNANDEZ-BERNAL, M.S.,MARIANO-MATÍAS,F.,2010.ABSOLUTE GEOMAGNETIC INTENSITY DATA FROM PRECLASSIC GUATEMALAN POTTERY.PHYS.EARTH PLANET.IN.180,41–51.
ATHENS,J.S.,1980.EL PROCESO EVOLUTIVO EN LAS SOCIEDADES COMPLEJAS Y LA OCUPACION DEL PERIODO
TARDIO-CARA EN LOS ANDES SEPTENTRIONALES DEL ECUADOR.COLECCION PENDONEROS, VOL.2.INSTITUTO
OTAVALENO DE ANTROPOLOGIA,OTAVALO.
ATHENS,J.S.,1990.PREHISTORIC AGRICULTURAL EXPANSION AND POPULATION GROWTH IN NORTHERN
HIGHLAND ECUADOR:INTERIM REPORT FOR 1989FIELD WORK.INTERNATIONAL ARCHAEOLOGICAL RESEARCH
INSTITUTE,INC..REPORT PREPARED FOR:INSTITUTO NACIONAL DE PATRIMONIO CULTURAL,QUITO,ECUADOR. SEPTEMBER OF 1970.
ATHENS,J.S.,1992.ETHNICITY AND ADAPTATION: THE LATE PERIOD-CARA OCCUPATION IN NORTHERN HIGHLAND
ECUADOR.IN:SCHORTMAN,EDWARD M.,URBAN,PATRICIA A.(EDS.),RESOURCES,POWER, AND
INTERREGIONAL INTERACTION.PLENUM,NEW YORK, PP.193–219.
ATHENS,J.S.,1995.RELACIONES INTERREGIONALES PREHISTORICAS EN EL NORTE DE LOS ANDES: EVIDENCIA DEL SITIO LA CHIMBA EN EL ECUADOR SEPTENTRIONAL.IN:GNECCO,C.(ED.),PERSPECTIVAS REGIONALS EN LA ARQUELOGIA DEL SUROCCIDENTE DE COLOMBIA Y NORTE DEL ECUADOR.EDITORIAL UNIVERSIDAD DEL CAUCA, ISBN958-9451-00-4.
ATHENS,J.S.,1999.VOLCANISM AND ARCHAEOLOGY IN THE NORTHERN HIGHLANDS OF ECUADOR.IN:MOTHES, PATRICIA (ED.),ACTIVIDAD VOLC ́ANICA Y PUEBLOS PRECOLOMBINOS EN EL ECUADOR.EDICIONES ABYA-YALA, QUITO, PP.157–189.
ATHENS,J.S.,2003.INVENTORY OF EARTHEN MOUND SITES,NORTHERN HIGHLAND ECUADOR.FINAL PROJECT
REPORT.INTERNATIONAL ARCHAEOLOGICAL RESEARCH INSTITUTE,INC.,HONOLULU,HAWAII,USA.
ATHENS,S.J.,1978.EVOLUTIONARY PROCESS IN COMPLEX SOCIETIES AND THE LATE PERIOD-CARA OCCUPATION OF NORTHERN HIGHLAND ECUADOR.PH.D. DISSERTATION.DEPT. OF ANTHROPOLOGY,UNIV, OF NEW MEXICO. UNIVERSITY MICROFILMS,ANN ARBOR,MICHIGAN.
ATHENS,J.S.,OSBORN,A.,1974.ARCHAEOLOGICAL INVESTIGATIONS IN THE HIGHLANDS OF NORTHERN
ECUADOR:TWO PRELIMINARY REPORTS.INSTITUTO OTAVALEN ̃O DE ANTROPOLOGÍA,OTAVALO,ECUADOR. BLAAUW,M.,2010.R-CODE FOR “CLASSICAL”AGE-MODELLING (CLAMV1.0) OF RADIOCARBON SEQUENCES. PANGAEAPANGAEA. HTTPS://DOI.ORG/10.1594/PANGAEA.873023.
BOWLES,J.,GEE,J.,HILDEBRAND,J.,TAUXE,L.,2002.ARCHAEOMAGNETIC INTENSITY RESULTS FROM
CALIFORNIA AND ECUADOR: EVALUATION OF REGIONAL DATA.EARTH PLANET SCI.LETT.203,967–981. BROWN,M.C.,DONADINI,F.,KORTE,M.,NILSSON,A.,KORHONEN,K.,LODGE,A.,LENGYEL,S.N., CONSTABLE,C.G.,2015.GEOMAGIA50.V3:1.GENERAL STRUCTURE AND MODIFICATIONS TO THE
ARCHEOLOGICAL AND VOLCANIC DATABASE.EARTH PLANETS SPACE 67,83. HTTPS://DOI.ORG/10.1186/S 40623-015-0232-0.
BUDDINGTON,A.F.,LINDSLEY,D.H.,1964.IRON-TITANIUM OXIDE MINERALS AND SYNTHETIC EQUIVALENTS.J. PETROL.5,310–357. HTTPS://DOI.ORG/10.1093/PETROLOGY/5.2310.
CALVO-RATHERT,M.,MORALES,C.J.,CARRANCHO,A.,CAMPS,P.,GOGUITCHAIVILI,A.,HILL,M.,2019. ROPRODUCIBILITY OF ARCHAEOINTENSITY DETERMINATIONS WITH A MULTIMETHOD APPROACH ON ARCHAEOLOGICAL MATERIAL REPRODUCTIONS.GEOPHYS.J.INT.218,1719–1738.
HTTPS://DOI.ORG/10.1093/GJI/GGZ246.
CHAUVIN,A.,GARCIA,Y.,LANOS,PH,LAUBENHEIMER,F.,2000.PALEOINTENSITY OF THE GEOMAGNETIC FIELD RECOVERED ON ARCHAEOMAGNETIC SITES FROM FRANCE.PHYS.EARTH PLANET.IN.120,111–136.
COE,R.S.,1967.PALEO-INTENSITIES OF THE EARTH’S MAGNETIC FIELD DETERMINED FROM TERTIARY AND QUATERNARY ROCKS.J.GEOPHYS.RES.72,3247–3262.
COE,R.S.,GROMM ́E,S.,MANKINEN,E.A.,1978.GEOMAGNETIC PALEOINTENSITIES FROM RADIOCARBON-DATED LAVA FLOWS ON HAWAII AND THE QUESTION OF THE PACIFIC NONDIPOLE LOW.J.GEOPHYS.RES.83(B4),1740– 1756.
COGNE,J.P.,2003.PALEOMAC: A MACINTOSH APPLICATION FOR TREATING PALEOMAGNETIC DATA AND MAKING PLATE RECONSTRUCTIONS.G-CUBED 4,100. HTTPS://DOI.ORG/10.1029/2001GC000227.
DAY,R.,FULLER,M.,SCHMIDT,V.A.,1977.HYSTERESIS PROPERTIES OF TITANOMAGNETITES: GRAIN SIZE AND COMPOSITION DEPENDENCE.PHYS.EARTH PLANET.IN.13,260–267.
DODSON,M.H.,MCCLELLAND,E.,1980.MAGNETIC BLOCKING TEMPERATURES OF SIMPLE DOMAIN GRAINS DURING SLOW COOLING.JOUR.GEOPHSY.RES.85,2625–2637.
DRAEGER,U.,PREVOT,M.,PODRAS,T.,RIISAGER,J.,2006.SINGLE-DOMAIN CHEMICAL, THERMOCHEMICAL AND THERMAL REMANENCES IN BASALTIC ROCK.GEOPHYS.J.INT.166,12–32.
DUNLOP,D.J.,2002A.THEORY AND APPLICATION OF THE DAY PLOT (MRS/MS VERSUS HCR/HC)1.THEORETICAL CURVES AND TESTS USING TITANOMAGNETITE DATA.J.GEOPHYS.RES.B107(B3),4–22,10.29/2001JB000486, EPM4-1.
DUNLOP,D.J.,2002B.THEORY AND APPLICATION OF THE DAY PLOT (MRS/MS VERSUS HCR/HC)2.APPLICATION TO DATA FOR ROCKS, SEDIMENTS AND SOILS.J.GEOPHYS.RES.B107(B3),5–15.
HTTPS://DOI.ORG/10.1029/2001JB000487.EPM5-1.
DUNLOP,D.J.,ÖZDEMIR,ÖZDEN,1997.ROCK MAGNETISM:FUNDAMENTALS AND FRONTIERS.CAMBRIDGE
UNIV.PRESS,NEW YORK, P.573.
EIGHMY,J.L.,STERNBERG,R.S.,1990.ARCHAEOMAGNETIC DATING.UNIVERSITY OF ARIZONA PRESS, P.446. FANJAT,G.,CAMPS,P.,ALVAVALDIVIA,L.M.,SOUGRATI,M.T.,CUEVAS-GARCIA,M.,PERRIN,M.,2013.FIRST ARCHEOINTENSITY DETERMINATIONS ON MAYA INCENSE BURNERS FROM PALENQUE TEMPLES,MEXICO: NEW DATA TO CONSTRAIN THE MESOAMERICA SECULAR VARIATION CURVE.EPSL363,168–180.
FOX,J.M.W.,AITKEN,M.J.,1980.COOLING RATE DEPENDENCE OF THE THERMOREMANENT MAGNETIZATION. NATURE 283,462–463.
GOGUITCHAICHVILI,A.,GRECO,C.,GARCIA RUIZ,R.,DOMINGORENA,L.P.,CEJUDO,R.,MORALES,J.,GOGORZA, C.,TARRAGO,M.,2019.FIRST ARCHAEOINTENSITY REFERENCE PALEOSECULAR VARIATION CURVE FOR SOUTH
AMERICA AND ITS IMPLICATIONS FOR GEOMAGNETISM AND ARCHAEOLOGY.QUAT.RES.92,81–97.
HTTPS://DOI.ORG/10.1017/ QUA.2018.119.
HAGGERTY,S.E.,1976.OXIDATION OF OPAQUE MINERAL OXIDES IN BASALTS, AND OPAQUE MINERAL OXIDES IN TERRESTRIAL IGNEOUS ROCKS.IN:RUMBLE,D.(ED.),OXIDE MINERALS, FIRST ED.MINERAL SOCIETY OF
AMERICA,WASHINGTON DC.HG1-77.42,46.
HARRISON,R.J.,FEINBERG,J.M.,2008.FORCINEL: AN IMPROVED ALGORITHM FOR CALCULATING FIRST-ORDER REVERSAL CURVE DISTRIBUTIONS USING LOCALLY WEIGHTED REGRESSION SMOOTHING.G-CUBED 9,Q05016.
HTTPS://DOI.ORG/10.1029/2008GC001987.
HERRERO-BERVERA,E.,2015.SPOT READING OF THE ABSOLUTE PALEOINTENSITY OF THE GEOMAGNETIC FIELD OBTAINED FROM POTSHERDS (AGE CA.500-430AD) IN TEOTIHUACAN,MEXICO.ARCHAEOL.DISCOV.3,72–84.
HTTPS://DOI.ORG/10.4236/AD.2015.32008.
HERRERO-BERVERA,E.,ACTON,G.,2011.ABSOLUTE PALEOINTENSITIES FROM AN INTACT SECTION OF OCEANIC CRUST CORED AT ODP/IODP SITE 1256 IN THE EQUATORIAL PACIFIC.IN:
PETROVSKY,E., ET AL.(EDS.),THE EARTH’S MAGNETIC INTERIOR,IAGASPECIAL SOPRON BOOK SERIES, VOL.1, 10.1007/978-94-007-0323-0_13©SPRINGER SCIENCE+BUSINESS MEDIA B. VOL.2011.
HERRERO-BERVERA,E.,VALET,J.P.,2005.ABSOLUTE PALEOINTENSITY AND REVERSAL RECORDS FROM THE
WAIANAE SEQUENCE (OAHU,HAWAII,USA).EARTH PLANET SCI.LETT.234,279–296.
HERRERO-BERVERA,E.,VALET,J.P.,2009.TESTING DETERMINATIONS OF ABSOLUTE PALEOINTENSITY FROM THE
1955 AND 1960.HAWAIIAN FLOWS,EARTH PLANET SCI.LETT.287,420–433.
HTTPS://DOI.ORG/10.1016/J.EPSL.2009.08.035.
HERRERO-BERVERA,E.,KRASA,D.,VAN KRANENDONK,M.,2016.A WHOLE ROCK ABSOLUTE PALEOINTENSITY DETERMINATION OF DACITES FROM THE DUFFER FORMATION (CA.3.467GA) OF THE PILBARA CRATON,
AUSTRALIA: AN IMPOSSIBLE TASK?PHYS.EARTH PLANET.IN.258,51–62.
HTTPS://DOI.ORG/10.1016/J.PEPI.2016.07.001.
KITAZAWA,KOBAYASHI,1968.INTENSITY VARIATION OF THE GEOMAGNETIC FIELD DURING THE PAST 4000 YEARS IN SOUTH AMERICA.JOUR.GEOMAG.GEOELCTR.(JGG)20(1),7–19.
KORTE,M.,CONSTABLE,C.G.,2011.IMPROVING GEOMAGNETIC FIELD RECONSTRUCTIONS FOR 0–3 KA.PHYS. EARTH PLANET.IN.188,247–259. HTTPS://DOI.ORG/10.1016/J. PEPI.2011.06.017.
LOPEZ-SANCHEZ,J.,MCINTOSH,G.,OSETE,M.L., DEL CAMPO,A.,VILLALAIN,J.J.,PEREZ,L.,KOVACHEVA,M., RODRIGUEZ DE LA FUENTE,O.,2017.EPSILON IRON OXIDE: ORIGIN OF THE HIGH COERCIVITY STABLE LOW CURIE TEMPERATURE MAGNETIC PHASE FOUND IN HEATED ARCHEOLOGICAL MATERIALS.G-CUBED 18,2646–2656.
HTTPS://DOI.ORG/10.1002/2017GC006929.
LOWRIE,W.,1990.IDENTIFICATION OF FERROMAGNETIC MINERALS IN A ROCK BY COERCIVITY AND UNBLOCKING TEMPERATURE PROPERTIES.GEOPHYS.RES.LETT.17(2),159–162.
MAYERGOYZ,I.D.,1986.MATHEMATICAL MODELS OF HYSTERESIS.PHYS.REV.LETT.56(15),1518–1521. MCCLELLAND-BROWN,E.,1984.EXPERIMENTS ON TRM INTENSITY DEPENDENCE ON COOLING RATE. J.GEOPHYS.RES.LETT.11,205–208.
NEEL,L.,1955.SOME THEORETICAL ASPECTS IN ROCK MAGNETISM.ADV.PHYS.191–193.PANOVSKA,S.,KORTE, M.,FINLAY,C.C.,CONSTABLE,C.G.,2015.LIMITATIONS IN PALEOMAGNETIC DATA AND MODELLING TECHNIQUES AND THEIR IMPACT ON HOLOCENE GEOMAGNETIC FIELD MODELS.GEOPHYS.J.INT.202,402–418.
PAVON-CARRASCO,F.J.,OSETE,M.L.,TORTA,J.M.,DE SANTIS,A.,2014A.A GEOMAGNETIC FIELD MODEL FOR THE HOLOCENE BASED ON ARCHAEOMAGNETIC AND LAVA FLOW DATA.EARTH PLANET SCI.LETT.388,98–109.
PAVON-CARRASCO,F.J.,GO ́MEZ-PACCARD,M.,HERV ́E,G.,OSETE,M.L.,CHAUVIN,A.,2014B.INTENSITY OF THE GEOMAGNETIC FIELD IN EUROPE FOR THE LAST 3KA: INFLUENCE OF DATA QUALITY ON GEOMAGNETIC FIELD MODELING.G-CUBED 15,2515–2530. HTTPS://DOI.ORG/10.1002/2014GC005311.
PERRIN,M.,SHCHERBAKOV,V.,1998.PALEOINTENSITY DATABASE UPDATED.EOS 79,198.
PIKE,VEROSUB,K.L.,2000.FIRST-ORDER REVERSAL CURVE DIAGRAMS: A NEW TOOL FOR CHARACTERIZING THE MAGNETIC PROPERTIES OF NATURAL SAMPLES.J.GEOPHYS.RES.105(28),461–28,475.
PIKE,C.R.,ROBERTS,A.P.,VEROSUB,K.L.,1999.CHARACTERIZING INTERACTIONS IN FINE MAGNETIC PARTICLE SYSTEMS USING FIRST ORDER REVERSAL CURVES.J.APPL.PHYS.85(9),6660–6667.
ROBERTS,A.P.,CUI,Y.,VEROSUB,K.L.,1995.WASP-WAISTED HYSTERESIS LOOPS: MINERAL MAGNETIC
CHARACTERISTICS AND DISCRIMINATION OF COMPONENTS IN MIXED MAGNETIC SYSTEMS.J.GEOPHYS.RES.SOLID
EARTH 100,17909E17924.
ROBERTS,A.P.,PIKE,C.R.,VEROSUB,K.L.,2000.FIRST-ORDER REVERSAL CURVE DIAGRAMS: A NEW TOOL FOR CHARACTERIZING THE MAGNETIC PROPERTIES OF NATURAL SAMPLES.J.GEOPHYS.RES.105(B12)
ROBERTS,A.P.,HESLOP,D.,ZHAO,X.,PIKE,C.R.,2014.UNDERSTANDING FINE MAGNETIC PARTICLE SYSTEMS THROUGH USE OF FIRST-ORDER REVERSAL CURVE DIAGRAMS.REV.GEOPHYS.52,557E602.
HTTPS://DOI.ORG/10.1002/2014RG000462.
ROBERTS,A.P.,TAUXE,L.,HESLOP,D.,ZHAO,X.,ZHAOXIA,JIANG,2017.A CRITICAL APPAAISAL OF THE “DAY” DIAGRAM,JOUR.GEOPHYSICAL RESEARCH:SOLID EARTH 123,2618–2644.
HTTPS://DOI.ORG/10.1002/2017JB015247.
ROBINSON,P.,MCENROE,S.A.,FABIAN,K.,HARRISON,R.J.,THOMAS,C.I.,MUKAI,H.,2014.CHEMICAL AND MAGNETIC PROPERTIES OF RAPIDLY COOLED METASTABLE FERRI-ILMENITE SOLID SOLUTIONS –IV: THE FINE STRUCTURE OF SELF-REVERSED THERMOREMANENT MAGNETIZATION.GEOPHYS.J.INT.196,1375–1396. ROPERCH,P.,CHAUVIN,A.,ALVAREZ,F.,2012.PARTIAL SELF-REVERSAL OF TRM IN BAKED SOILS AND CERAMICS FROM ECUADOR,PHYSICS.EARTH.AND PLANET.INTS.201–211,8–20.
HTTPS://DOI.ORG/10.1016/J.PEPI.2012.08.004.
SELKIN,P.,TAUXE,L.,2000.LONG-TERM VARIATIONS IN PALEOINTENSITY.PHILOS.TRANS.R.SOC.A358,1065– 1088. HTTPS://DOI.ORG/10.1098/RSTA.2000.0574.
SHIBUYA,H.,1980.GEOMAGNETIC SECULAR VARIATION IN SOUTHWEST JAPAN FRO THE PAST 2000YEARS BY
MEANS OF ARCHAEOMAGNETISM.THESIS,DEPARTMENT OF MATERIAL PHYSICS,FACULTY OF ENGINEERING
SCIENCE,OSAKA UNIVERSITY, P.54.FEBRUARY OF 1980.
STAHL,P.W.,ATHENS,L.S.,2001.A HIGH ELEVATION ZOOARCHAEOLOGICAL ASSEMBLAGE FROM THE NORTHERN ANDES OF ECUADOR.J.FIELD ARCHAEOL.28(1–2),161–176. HTTPS://DOI.ORG/10.1179/JFA.2001.28.1-2.161. STARK,F.,LEONHARDT,R.,FASSBIBDER,J.W.E.,REINDEL,M.,2009.THE FIELD OF SHERDS: RECONSTRUCTING GEOMAGNETIC FIELD VARIATIONS FROM PERUVIAN POTSHERDS.IN:REINDEL,M.,WAGNER,G.A.(EDS.),NEW
TECHNOLOGIES FOR ARCHAEOLOGY.SPRINGER,103,116,NATURAL SCIENCE IN ARCHAEOLOGY, DOI: 10.1007/978-3-540-87438-7_7,CSPRINGER –VERLAG BERLIN HEIDELBERG 2009.
SUPPLEMENT TO,BLAAUW,M.,2010.METHODS AND CODE FOR ’CLASSICAL’ AGE-MODELLING OF RADIOCARBON SEQUENCES.QUAT.GEOCHRONOL.5(5),512–518. HTTPS://DOI.ORG/10.1016/ J.QUAGEO.2010.01.0.
TAUXE,L.,MULLENDER,T.A.T.,PICK,T.,1996.POTBELLIES, WASP-WAISTS, AND SUPERPARAMAGNETISM IN MAGNETIC HYSTERESIS.J.GEOPHYS.RES.SOLID EARTH 101,571E583.
TEMA,E.,KNODOPULOU,D.,2011.SECULAR VARIATION OF THE EARTH’S MAGNETIC FIELD IN THE BALKAN REGION DURING THE LAST EIGHT MILLENNIA BASED ON ARCHAEOMAGNETIC DATA.GEOPHYS.J.INT.186(2011), 603–614.
TEMA,E.,GOMEZ-PACCARD,M.,KONDOPOULOU,D.,ALMAR,Y.,2012.INTENSITY OF THE EARTH’S MAGNETIC FIELD IN GREECE DURING THE LAST FIVE MILLENNIA: NEW DATA FROM GREEK POTTERY.PHYS.EARTH PLANET. IN.202–203,14–26.
VALET,J.P.,TRIC,E.,HERRERO-BERVERA,E.,MEYNADIER,L.,LOCKWOOD,J.P.,1998.ABSOLUTE
PALEOINTENSITY FROM HAWAIIAN LAVAS YOUNGER THAN 35 KA.EARTH PLANET SCI.LETT.161(1998),19–32. VALET,J.P.,HERRERO-BERVERA,E.,LEMOU ̈EL,J.L.,PLENIER,G.,2008.SECULAR VARIATION OF THE
GEOMAGNETIC DIPOLE DURING THE PAST 2 THOUSAND YEARS.G-CUBED 9,Q01008. HTTPS://
DOI.ORG/10.1029/2007GC001728.
VALET,J.P.,HERRERO-BERVERA,E.,CARLUT,J.,KONDOPOULOU,D.,2010.A SELECTIVE PROCEDURE FOR ABSOLUTE PALEOINTENSITY IN LAVA FLOWS.GEPHYS.RES.LETT.37,1–7. HTTPS://DOI.ORG/
VEITCH,J.,HEDLEY,I.,WAGNER,J.J.,1984.AN INVESTIGATION OF THE INTENSITY OF THE GEOMAGNETIC FIELD DURING ROMAN TIMES USING MAGNETICALLY ANISOTROPIC BRICKS AND TILES, VOL.37.ARCHAELOGICAL
SCIENCES,GENEVE, PP.359–373.
WALTON,D.,1980.TIME–TEMPERATURE RELATIONS IN THE MAGNETIZATION OF ASSEMBLIES OF SINGLE DOMAIN GRAINS.NATURE 286,245–247.
ZHOU,X.,ROBERTS,A.P.,HESLOP,D.,PATERSON,G.A.,LI,Y.,LI,J.,2017.MAGNETIC DOMAIN STATE DIAGNOSIS USING HYSTERESIS REVERSAL CURVES.JOUR.GEOPHYS.RES.,SOLID EARTH 122,4767–4789.
HTTPS://DOI.ORG/10.1002/2016JB013683.
ZHU,R.,PAN,Y.,SHAW,J.,LI,D.,LI,Q.,2001.GEOMAGNETIC PALAEOINTENSITY JUST PRIOR TO THE CRETACEOUS NORMAL SUPERCHRON.PHYS.EARTH PLANET.IN.128,207–222.
Fig. 1. Location of the archaeological sites of the Atuntaqui mounds,
Otavalo mounds and La Chimba, situated in Northern Ecuador.
Fig. 2. Representative pottery fragments from the archaeological sites of a)
Fig. 3. (a) Calibrated radiocarbon determinations from TP-7. Calibrated
ranges for each date are depicted with both one (thin horizontal line) and two (thick horizontal line) standard deviation ranges, along with intercepts.
A best fit curve, a suggested interpretation for the interpolated age of each exca- vation level, has been superimposed on the date ranges. Taken from
Athens (1995) and Stahl and Athens (2001). (b) Depth versus age (BP)
Fig. 4. Normalized Isothermal Remanent Magnetization (IRM) curves for
Fig. 5. a–d) Stepwise thermal demagnetization of three IRM components
for representative samples. Symbols: dot = low- (0.1 T); diamond = intermediate- (0.5 T); square = high- (1.2 T) of the coercivity component.
Fig. 6. a–d) Examples of low-field magnetic susceptibility versus
temperature (up to 700 ◦C) for curves obtained for representative samples
Fig. 7. Microscope image of oxide minerals of selected representative ceramics, all of
irregular shape. Scale bar is in microns. (a) Sample 1A, from La Chimba Level 10, Ti-Mag content is ca. 6% anhedral crystals (2–50 μm) associated with ilmenite forming graphic exsolutions and fluidal texture partly altered to Ti-Hem (12% content) and rutile (<2%); (b)
Sample 9B from Otavalo mound 3, Ti-Mag content is ca. 7% anhedral and octahedral crystals (2–45 μm) homogeneously disseminated, partly altered to Ti-Hem (4%), associated to ilmenite or magnetite (3%) (oxidation stage from C4 to C6 in Haggerty’s classification) forming ‘sandwich’ and ‘trellis’ type textures, sometimes completely altered
to Ti-Hem; (c and d) Sample 10c from La Chimba level 3, Ti-Mag content is ca. 1.5% anhedral crystals (2–12 μm) isolated disseminated and strongly altered to Ti-Hem, pyrrhotite (7%) shows spheroidal and anhedral crystals (3–12 μm) forming aggregates of pyrrhotite spheroids of distinct size (10–45 μm), Ti-Hematite (6%) are granular aggregates (2–50 μm) strongly skeletal aspect (this granulation could also be due to alteration), rutile
grains (3%) are homogeneously disseminated inside of the Ti-Hematite pseudomorph matrix of the sample; (e and f) Sample 19D from Otaval mound “upper charcoal level”,
Ti-Mag content is ca. 6.5% anhedral and euhedral crystals (2–70 μm) homogeneously embedded in the vitrified rock fragments, it show ‘sandwich’ and ‘trellis’ type ilmenite (0.5%) lamellas, and generally, Ti-Mag is partly to completely altered to Ti-Hem (10%, 5– 60 μm) and rutile (2%) or perhaps just internal reflection of hematite. Pyrrhotite/Pyrite (?)
is ca 3% content of anhedral shape (2–60 μm) and filling open spaces of tabular ferromagnesian and Ti-Mag. The “white” lamellae are Ilmenites, the pink-brown residual between the two lamellae corresponds to Low-Titanium magnetite (oxidation stage from C4 to C6 in Haggerty’s classification). (For interpretation of the references to color in this
Fig. 8. Hysteresis parameters plotted over the theoretical Day plots. Most
of the samples cluster in the pseudosingle domain (PSD) area. Dashed lines are mixing curves from Dunlop (2002a). SP are super-paramagnetic, MD multidomain, and SD single domain grain sizes. The color green represents
specimens from La Chimba; the yellow color represents a sample from Atuntaqui and the red color represents samples from Otavalo mounds. (For
interpretation of the references to color in this figure legend, the reader is referred to the Web version of this article.)
Fig. 9. Results of hysteresis experiments from four representative northern
Ecuador samples. From left to right FORC (i.e. hysterons) curves and FORC diagrams of Bu (Oe) versus Bc (Oe) horizontal profiles, vertical profiles, and
FORCs curves for four representative samples containing mainly PSD, particles in different pro- portions. FORCs were analyzed using FORcinel
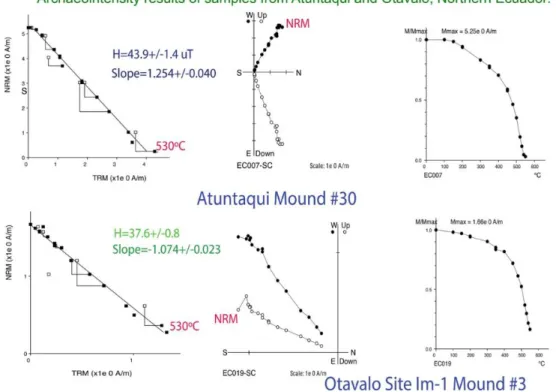
Fig. 10. Arai archaeointensity plots and evolution of NRM during thermal
demagetization for two representative specimens of northern Ecuador. Notice the well- defined linear NRM-TRM slope (from 100 ◦ C up to 530 ◦ C)
and the positive pTRM checks (Arai diagrams on the left). The middle diagrams represent the uni-vectorial behavior of the directional results typical of the successful absolute paleointensity experiments. The far right
diagrams are the results of the normalized intensity of magnetization indicating the predominance of one single magnetic mineral phase (e.g.
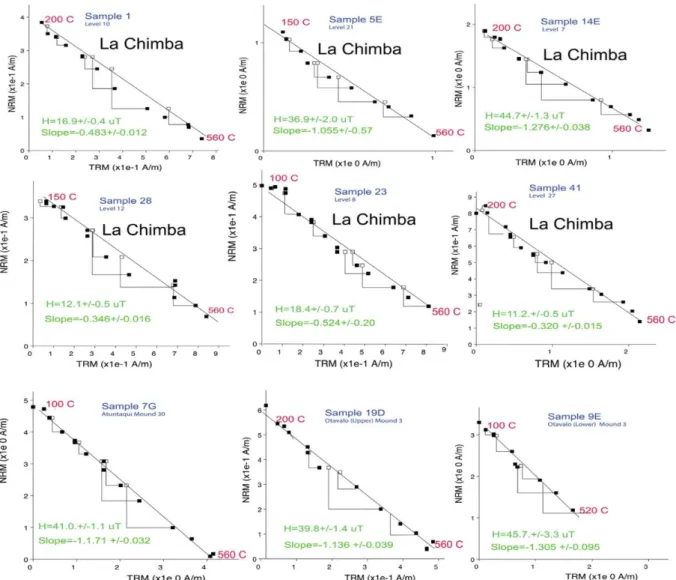
Fig. 11. Arai archaeointensity plots for representative samples from the
three sites. Black squares represent the initial NRM-pTRM measurements, open squares are NRM-pTRM checks. Only diagrams with linear Arai plots
Fig. 12. Geographic distribution of the Northern Ecuador AI site(s) included
Fig. 13. Comparison of the AI results of this study with the results from Peru
and Colombia within a radius of ~1200 km for the past 3 millenia including the results from Peru from Stark et al. (2009).
Fig. 14. Archaeointensity data from La Chimba site plotted with the radiocarbon ages obtained from the different stratigraphic levels (see text
and Appendix A). The blue solid circles represent the successful mean absolute archaeointensity determinations for the early phase (700–440BC) excavation levels 27.8 ± 1.315 μT, middle levels phase (440–40BC), 15.07 ±
0.78 μT and the late levels phase (44BC-250AD) 25.52 ± 1.575 μT. The horizontal lines across the blue circles indicate the age ranges of the level phases. (For interpretation of the references to color in this figure legend,
![[PDF] Cours utilisation des champs dans Microsoft Word](data:image/gif;base64,R0lGODlhAQABAIAAAP///wAAACH5BAEAAAAALAAAAAABAAEAAAICRAEAOw==)