HAL Id: hal-00317311
https://hal.archives-ouvertes.fr/hal-00317311
Submitted on 2 Apr 2004
HAL is a multi-disciplinary open access
archive for the deposit and dissemination of
sci-entific research documents, whether they are
pub-lished or not. The documents may come from
teaching and research institutions in France or
abroad, or from public or private research centers.
L’archive ouverte pluridisciplinaire HAL, est
destinée au dépôt et à la diffusion de documents
scientifiques de niveau recherche, publiés ou non,
émanant des établissements d’enseignement et de
recherche français ou étrangers, des laboratoires
publics ou privés.
Magnes, V. Wesztergom, A. Meloni
To cite this version:
U. Villante, M. Vellante, A. Piancatelli, A. Di Cienzo, T. L. Zhang, et al.. Some aspects of man-made
contamination on ULF measurements. Annales Geophysicae, European Geosciences Union, 2004, 22
(4), pp.1335-1345. �hal-00317311�
© European Geosciences Union 2004
Geophysicae
Some aspects of man-made contamination on ULF measurements
U. Villante1,2, M. Vellante1,2, A. Piancatelli1,2, A. Di Cienzo2, T. L. Zhang3, W. Magnes3, V. Wesztergom4, and A. Meloni5,2
1Dipartimento di Fisica, Universit`a, L’Aquila, Italy
2Consorzio Area di Ricerca in Astrogeofisica, L’Aquila, Italy 3Institut f¨ur Weltraumforschung, Graz, Austria
4Geodetic and Geophysical Research Institute of the Hungarian Academy of Science, Sopron, Hungary 5Istituto Nazionale di Geofisica e Vulcanologia, Roma, Italy
Received: 30 April 2003 – Revised: 02 November 2003 – Accepted: 05 November 2003 – Published: 2 April 2004
Abstract. An analysis of the man made contamination on
ULF measurements in highly populated areas has been con-ducted at several suitably chosen sites in Western Europe. The experimental results show common characteristics at dif-ferent stations with clear evidence for an additional working day contamination with respect to weekends. These effects more clearly emerge in the vertical component that is less in-fluenced by natural signals. A similar analysis conducted at Terra Nova Bay does not reveal any clear evidence for man made disturbances on Antarctic measurements.
Key words. (Magnetospheric physics, instruments and
tech-niques; Solar wind-magnetosphere interaction) (Geomag-netism and paleomag(Geomag-netism time variations, diurnal to sec-ular)
1 Introduction
As it is well known, micropulsation measurements in the ULF frequency range (0.001–10 Hz) allow for interesting in-vestigations of important aspects of the interaction between the solar wind and the Earth’s magnetosphere and also pro-vide useful information on the physical characteristics of the magnetospheric and ionospheric plasma populations (Lanze-rotti et al., 1979, Webb et al., 1977, Vellante et al., 2002). These measurements, however, may be interesting also for other aspects of geophysical sciences: for example, geomag-netic field variations in the frequency range of micropul-sations provide useful information on the structure of the Earth’s crust (Meloni et al., 1985; Pilipenko and Fedorov, 1993; Vellante, 1997; Villante et al., 1998). In addition, lo-cal ULF emissions are considered a promising candidate for short-term earthquake predictions (Fraser-Smith et al., 1990, 1994; Molchanov et al., 1992; Hayakawa et al., 1996; Nagao et al., 2002; Gotoh et al., 2002). Lastly, special care has been dedicated to the possible influence of natural and artificial
Correspondence to: U. Villante
ULF electromagnetic fields on biological systems and human health (Villoresi et al., 1994; Breus et al., 1995; Ptitsyna et al., 1996). According to previous arguments, for several ap-plications it might be useful to conduct ULF measurements not far from densely populated areas. On the other hand, some aspects of magnetospheric dynamics (wave propaga-tion, resonance phenomena, global oscillation modes, etc.) request simultaneous measurements from large magnetome-ter networks that, in several cases, have been installed in highly populated regions. As a consequence, a careful eval-uation of the possible contamination of man-made distur-bances on ULF measurements (which, in general, mostly come from electric railways, power lines, electromechanical devices, car traffic) represents an important topic in a wide scientific context.
A previous analysis at a single site in Italy (Villante and Vellante, 1998) revealed an increased level of power (mostly between 45–500 mHz) during working days. In that case, however, some significant differences between components were imputed to the measuring system itself. Therefore, we found it interesting to conduct a similar analysis on data sets obtained at several low-latitude sites in Western Europe. Ob-viously, the relative importance of different noise sources may be not the same at different stations. Nevertheless, we found common characteristics of the experimental results at different sites; it makes us sure that our basic conclusions are not related with the registration site. The same analy-sis also was conducted on ULF measurements conducted at Terra Nova Bay (Antarctica).
At low latitudes, geomagnetic field fluctuations in the ULF band are mostly a Pc3 (20–100 mHz) daytime phenomenon, characterized by two dominant oscillation modes: external waves (Pc3a) penetrating deep into the magnetosphere, and resonant oscillations (Pc3b) of local field lines at the fun-damental eigenfrequency, decreasing with latitude (Villante and Vellante, 1997). Through the solar cycle, due to the vari-able interplanetary and magnetospheric conditions, the two modes become often intermingled: in general, however, Pc3a events have latitude independent frequency (∼30–50 mHz)
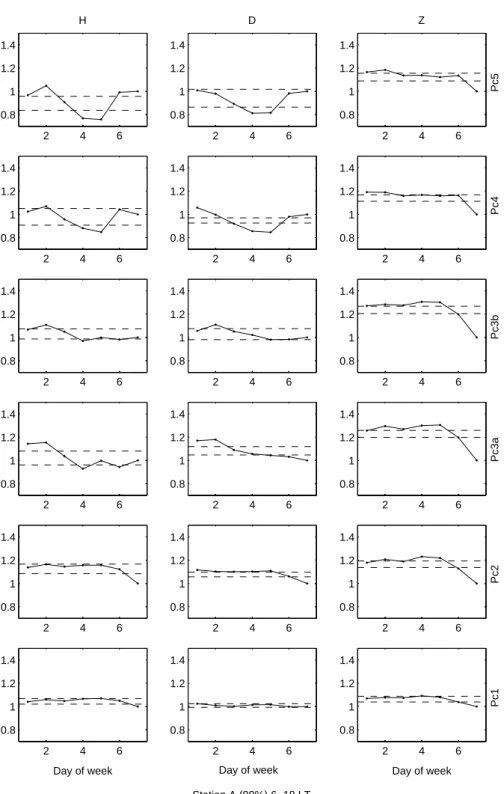
2 4 6 0.8 1 1.2 1.4 H 2 4 6 0.8 1 1.2 1.4 D 2 4 6 0.8 1 1.2 1.4 Z Pc5 2 4 6 0.8 1 1.2 1.4 2 4 6 0.8 1 1.2 1.4 2 4 6 0.8 1 1.2 1.4 Pc4 2 4 6 0.8 1 1.2 1.4 2 4 6 0.8 1 1.2 1.4 2 4 6 0.8 1 1.2 1.4 Pc3b 2 4 6 0.8 1 1.2 1.4 2 4 6 0.8 1 1.2 1.4 2 4 6 0.8 1 1.2 1.4 Pc3a 2 4 6 0.8 1 1.2 1.4 2 4 6 0.8 1 1.2 1.4 2 4 6 0.8 1 1.2 1.4 Pc2 2 4 6 0.8 1 1.2 1.4 Day of week 2 4 6 0.8 1 1.2 1.4 Day of week Station A (90%) 6−18 LT 2 4 6 0.8 1 1.2 1.4 Day of week Pc1
Fig. 1. Weekly variation of the average daytime power of magnetic field components in different frequency bands at Station A (90% of
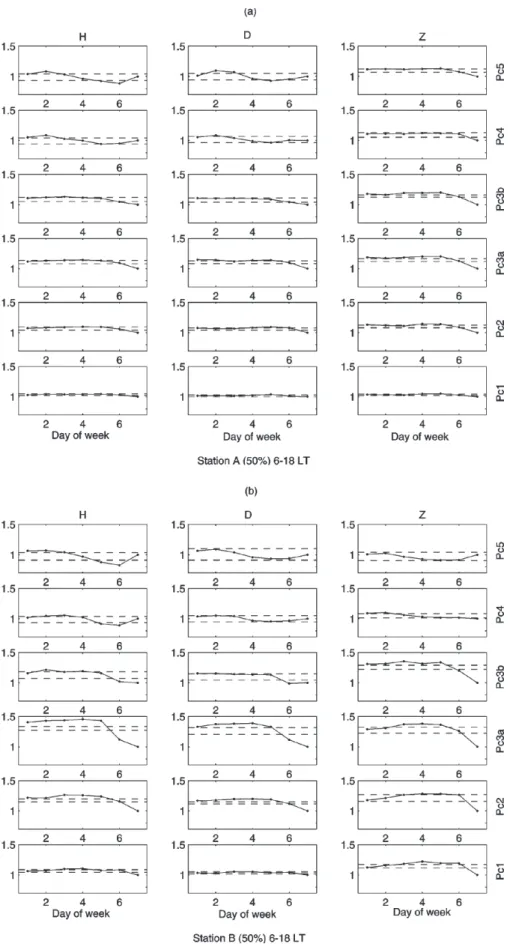
Fig. 2. Weekly variation of the daytime average power of magnetic field components in different frequency bands (50% of original spectra).
2 4 6 0.8 1 1.2 1.4 H 2 4 6 0.8 1 1.2 1.4 D 2 4 6 0.8 1 1.2 1.4 Z Pc5 2 4 6 0.8 1 1.2 1.4 2 4 6 0.8 1 1.2 1.4 2 4 6 0.8 1 1.2 1.4 Pc4 2 4 6 0.8 1 1.2 1.4 2 4 6 0.8 1 1.2 1.4 2 4 6 0.8 1 1.2 1.4 Pc3b 2 4 6 0.8 1 1.2 1.4 2 4 6 0.8 1 1.2 1.4 2 4 6 0.8 1 1.2 1.4 Pc3a 2 4 6 0.8 1 1.2 1.4 2 4 6 0.8 1 1.2 1.4 2 4 6 0.8 1 1.2 1.4 Pc2 2 4 6 0.8 1 1.2 1.4 Day of week 2 4 6 0.8 1 1.2 1.4 Day of week Station A (50%) 18−6 LT 2 4 6 0.8 1 1.2 1.4 Day of week Pc1
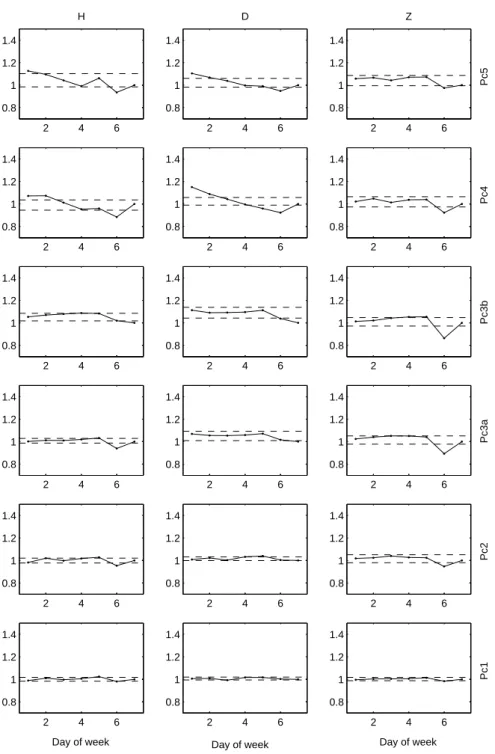
Fig. 3. Weekly variation of the nighttime average power of magnetic field components in different frequency bands at Station A (50% of
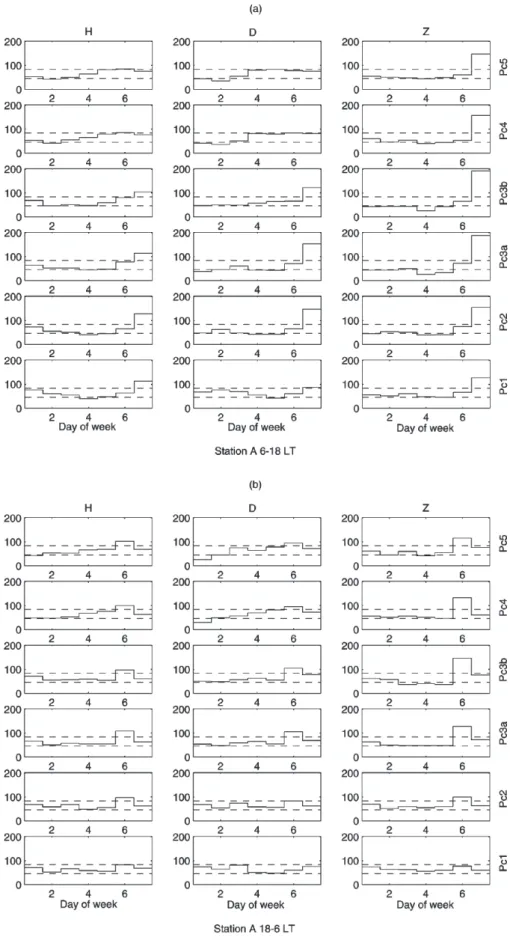
Fig. 4. Weekly distribution of the lowest values of power (5% of the whole population) in different frequency bands at Station A. Dashed
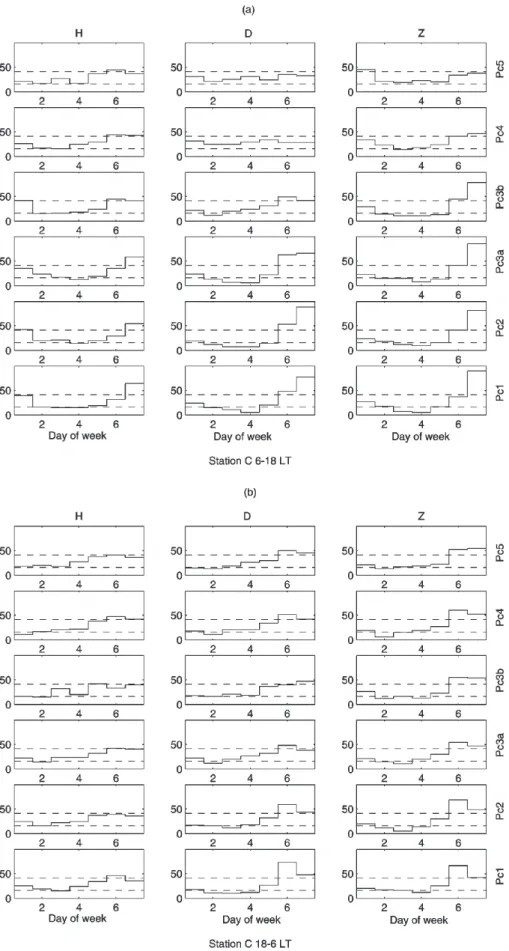
Fig. 5. Weekly distribution of the lowest values of power (5% of the whole population) in different frequency bands at Station C. Dashed
and are detected in both the horizontal components (H and D), while Pc3b events typically have higher frequency (∼40–80 mHz, between latitudes of ∼ 35◦–40◦) and appear
much more sharply on H . Signal amplitudes typically over-come the noise level at least by a factor of 10 in the horizontal components, while no significant signal is detected along Z (mostly for the effects produced by induced currents inside the Earth). During nighttime intervals, damped Pi2 fluctua-tions (6.6–25 mHz) associated with geomagnetic bays are of-ten detected around local midnight (Villante et al., 1992). In the Pc5 range (1–6.7 mHz) the statistical occurrence of power enhancements at discrete frequencies (∼1.1, 1.7, 2.3, 2.8 and 3.7 mHz; Francia and Villante, 1997, Villante et al., 2001) has been interpreted in terms of ground signatures of magne-tospheric cavity/waveguide modes driven by solar wind pres-sure pulses.
2 Experimental results
Micropulsation measurements have been conducted for sev-eral months (2000–2002) at sevsev-eral suitably chosen places in Western Europe (L∼1.6–1.9, typically several km far from populated areas and electric railways). The instrumentation basically consists of fluxgate magnetometers sampled at 1 s. Power spectra of the geomagnetic field components were computed over consecutive 4-min intervals for local day-time (6–18 LT) and nightday-time hours (18–6 LT). The spectra were evaluated in the frequency range 4–500 mHz, with a sampling of 4 mHz, by using the maximum entropy method with an autoregression order equal to 30. We further inte-grated each hourly spectrum over frequency ranges that ap-proximately correspond to the usual Pc1-Pc4 classification scheme. In addition, we separated the Pc3 band in two dif-ferent frequency intervals (20–45 and 45–100 mHz) in which Pc3a and Pc3b would be preferentially expected. At lower frequencies, the power spectra were computed with the same technique over 1-h intervals considering as initial data the 15-s averages of the geomagnetic field components. Several other techniques for the power spectra evaluation have been adopted with similar results.
Our results are organized in six frequency bands: Pc1 (200–500 mHz), Pc2 (100–200 mHz), Pc3a (45–100 mHz), Pc3b (20–45 mHz), Pc4 (5–20 mHz), Pc5 (1.6–5 mHz). Ob-viously, fluxgate measurements are poorly accurate at the highest frequencies; so the results obtained in Pc1 band should be considered only indicative. In the following we compare the results obtained at three sites in Italy, Austria and Hungary; however, similar results were obtained also at other stations. The best data coverage (Station A, Italy, ∼50 km far from electric railway) has ∼92% of expected mea-surements.
In general, man-made disturbances are expected to perturb electromagnetic measurements on a wide range of temporal scales (at least from daily to seasonal). On the other hand, natural signals are also expected to show daily, seasonal and solar cycle variations (Jacobs, 1970). Therefore, we found
it useful to focus our attention mostly on the analysis of the weekly variation which is better related to artificial effects.
The average power values as organized in terms of the weekdays (Monday=1) are shown in Fig. 1 for station A. These averages have been obtained after removing, for each frequency band, component, and weekday, the 10% highest power values; as a matter of fact, this procedure accounts for extreme power levels associated with peculiar events, such as geomagnetic storms, highly localized artificial disturbances, and major micropulsation activity. Dashed lines in Fig. 1 identify the region of 99% occurrence computed from ran-domly selected hourly powers. In addition, in order to pro-vide the same visual representation for equal relative varia-tions, we normalized weekday values to the Sunday value, and chose the same vertical limits (0.7–1.5) for all panels.
As shown in Fig. 1, daytime results reveal in the Z com-ponent (which is much less influenced by natural signals of external origin), in any frequency band, a clear weekly modu-lation with minimum power values on Sundays, and reduced power levels on Saturdays. In the Pc2 band (and, to some extent, Pc1 band), where natural signals rarely occur at low latitudes, clear evidence for a weekly variation can also be identified in the horizontal components. Conversely, at lower frequencies, the horizontal components show more dramatic natural variations which overcome the possible effects of the working days contamination.
Figure 2a shows the results obtained for the same sta-tion and time interval after removing the 50% highest power values. This procedure practically removes most effects of the natural micropulsation activity. As can be seen, a clear weekly variation now explicitly appears on horizontal com-ponents also in the Pc3a and Pc3b bands. The ratio R be-tween the Monday through Friday average value and the Sun-day value can be considered indicative of the additional con-tamination during working days. At Station A, R has a max-imum value in the Pc3a band (∼1.13, on H and D; ∼1.17, on Z). In the Pc4 and Pc5 band the weekly modulation still appears only in the Z component, suggesting a significant contribution of longer term natural signals in the horizontal components. Figure 2b shows the results obtained at Station B (Hungary): as can be seen, the weekend effect is clear in the Pc1–Pc3 band while it vanishes in the Pc4–Pc5 band.
Figure 3 (Station A) shows the results that are typically obtained during nighttime intervals: as can be seen, they con-firm in the Z component a clear weekend effect and suggest Saturday nights as the quietest intervals. In this case the man-made contamination in the Pc3b band reaches R∼1.19 (with respect to the Saturday value).
Figure 4 shows the results of an independent test (Sta-tion A) which reinforce the conclusions of the previous para-graph and suggest some additional interesting features. In this case we selected for each component and frequency band, the 5% of hourly intervals that correspond to the low-est power values. In agreement with previous results, their distributions vs. week days (dashed lines in Fig. 4 identify the theoretical 99% confidence interval for a flat occurrence probability) clearly confirm that the lowest power levels are
Fig. 6. (a) Weekly variation of the average power (22–2 LT) of magnetic field components in different frequency bands at Station A (50% of
original spectra). (b) Weekly distribution of the lowest values of power (5% of the whole population) in different frequency bands at Station C (2–6 LT).
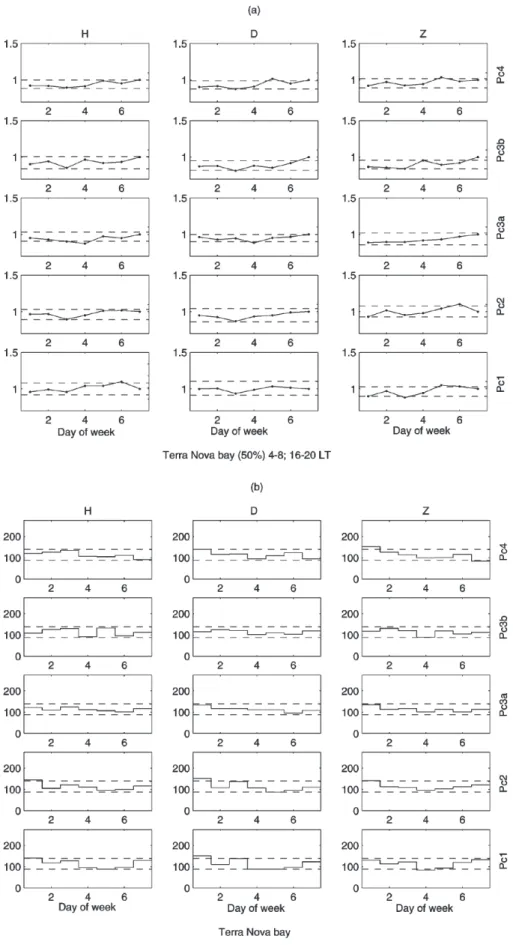
Fig. 7. (a) Weekly variation of the average power of magnetic field components in different frequency bands at Terra Nova Bay (Antarctica,
50% of original spectra). Dashed lines identify the 99% confidence interval. (b) Weekly distribution of the lowest values of power (5% of the whole population) in different frequency bands at Terra Nova Bay (Antarctica). Dashed lines identify the 99% confidence interval.
C (Austria), where the percentage of quiet hours on Monday morning are appreciably greater than in other days (a feature that also emerges at other sites).
In order to investigate the possible disappearance (or sig-nificant reduction) of the man-made contamination during shorter intervals in the middle of the night, we conducted the same kind of analysis for different time intervals in the nighttime sector. As typical examples we show the results obtained at station A (22–2 LT, Fig. 6a) and station C (2–6 LT, Fig. 6b): as can be seen, they clearly reveal the same effects obtained for the entire time sector (Fig. 3 and Fig. 5b).
In Antarctica, at Terra Nova Bay (geom. lat. 80◦S), ULF measurements are conducted by means of a search coil in-strument originally sampled at 10 Hz and then averaged and stored at 1 Hz. For the present investigation 1-s data (1994– 1998) have been processed; obviously, search coil measure-ments do not extend to the lowest frequencies. Due to the Earth’s rotation, Terra Nova Bay has a variable distance, through the day, from the cusp projection and is located in-side the polar cap during the major part of the day. As a con-sequence, the ULF activity often shows a significant power enhancement (approximately of an order of magnitude in the Pc3 and Pc4 bands) around local magnetic noon, when the station approaches closed field lines (Villante et al., 2000a, 2000b). On the other hand, the effects of the substorm occur-rence might be expected in the midnight sector. So, in order to evaluate the effects of the possible contamination from ar-tificial signals, we examined ULF measurements obtained far from local noon and midnight. As a matter of fact, a visual inspection of experimental results (Fig. 7) does not reveal in this case any significant weekly variation of the spectral power.
3 Discussion
A careful evaluation of the possible contamination of natu-ral ULF signals from artificial man made disturbances repre-sents an interesting aspect of geophysical science in that for several applications (magnetospheric physics, magnetotel-lurics, possible earthquakes precursors, biological aspects, etc.), it is important to conduct ULF measurements not far from densely populated areas. Obviously, the contamination level is strongly dependent upon site, technical apparatus and data processing. However, we found common characteristics that can be considered indicative of the level of man-made contamination in populated areas in western Europe, namely the following:
In the micropulsation regime, the working day contami-nation is detected even at suitably selected sites in populated areas. It basically consists of reduced power levels, as well as of greater percentages of quiet hours during weekends (and, to a lesser extent, Monday morning). The reduced power
magnetic contamination from local industries during work-ing days. Nevertheless, since lower weekend signals are also detected during short time intervals in the middle of the night, we tentatively speculate a possible relationship between the experimental results and a reduced power generation during the entire weekend in European countries.
Typically, the noise amplitude is order of magnitudes lower than significant natural signals. In this sense it does not affect the scientific analysis of single events. It is clear, however, that a preliminary analysis of the man made con-tamination is important before drawing conclusions on the short- and long-term modulation of the ULF activity. For example, any analysis of the weekly distribution of automati-cally selected events (Fraser-Smith, 1979; Tsirs and Loginov, 1985; Vero, 1986) might be influenced by the different noise levels on different days. A similar conclusion holds for the spectral analysis of long time series of the integrated power whose results might be significantly affected by the reduced weekend levels.
The possible modulation of the geomagnetic activity in-dices have been discussed by several authors with some con-troversial results. Fraser-Smith (1979) suggested a possi-ble weekend increase in Ap and aa indices since 1940. He proposed that the smaller geomagnetic activity during week-days might reflect a higher power line radiation that would affect magnetospheric processes suppressing natural distur-bances. Recently, however, Karinen et al. (2002) reexamined the weekend effect of the Ap and aa indices and concluded that the weekend/weekday difference should be considered as a purely statistical nature.
At Antarctic latitudes our observations do not support any firm evidence for a significant man-made contamination in the ULF band, suggesting a negligible influence from remote areas. It is, however, interesting to remark that, at higher frequencies, Park and Miller (1979) found a distinct Sun-day minimum in the VLF wave activity in Antarctica (1974– 1975) and interpreted the experimental results in terms of a reduced power consumption in conjugate regions in Canada. Acknowledgements. This research activity is supported by MIUR/COFIN, PNRA (Programma Nazionale Ricerche in Antar-tide) and Consorzio Area di Ricerca in Astrogeofisica. V. W. acknowledges financial support by the Hungarian Research Fund OTKA T032173, TS40848. The editor in chief thanks two referees for their help in evaluating this paper.
References
Breus, T. K., Cornelissen, G., Halberg, F., and Levitin, A. E.: Tem-poral associations of life with solar and geophysical activity, Ann. Geophysicae, 13, 1211, 1995.
Francia, P. and Villante, U.: Some evidence for ground power en-hancements at frequencies of global magnetospheric modes at low latitudes, Ann. Geophysicae, 15, 17, 1997.
Fraser-Smith, A. C.: A weekend increase in geomagnetic activity, J. Geophys. Res., 84, 2089, 1979.
Fraser-Smith, A. C., Bernardi, A., McGill, P. R., Ladd, E., Helli-well, R. A., and Villard, O. G.: Low frequency magnetic field measurements near the epicenter of the Ms=7.1 Loma Prieta earthquake, Geophys. Res. Lett., 17, 1465, 1990.
Fraser-Smith, A. C., McGill, P. R., Helliwell, R. A., and Villard, O. G.: Ultra-low frequency magnetic field measurements in south-ern California during the Northridge earthquake of 17 January 1994, Geophys. Res. Lett., 21, 2195, 1994.
Gotoh, K., Akinaga, Y., Hayakawa, M., and Hattori, K.: Princi-pal component analysis of ULF geomagnetic data for Izu islands earthquakes in July 2000, J. Atmosph. Electr., 22, 01, 2002. Hayakawa, M., Kawate, R., Molchanov, O. A., and Yumoto,K.:
Re-sults of ultra-low-frequency magnetic field measurements during the Guam earthquake of 8 August 1993, Geophys. Res. Lett., 23, 241, 1996.
Jacobs, J. A.: Geomagnetic micropulsations, in physics and chem-istry in space, edited by J.G. Roeder (Springer-Verlag), vol. 1, 1970.
Karinen, A., Mursula, K., Ulich, T., and Manninen, J.: Does the magnetosphere behave differently on weekends? Solar Cycle and Space Weather Conference, ESA SP–477, 439, 2002.
Lanzerotti, L. J., Maclennan, C. G., and Webb, D. C.: Comparisons of inferred total plasmasphere content with measured plasma density profiles, J. Geophys. Res., 84, 2648, 1979.
Meloni, A., Medford, L. V., and Lanzerotti, L. J.: Geomagnetic anomaly detected at hydromagnetic wave frequencies, J. Geo-phys. Res., 90, 3569, 1985.
Molchanov, O. A., Kopytenko, Yu. A., Voronov, P. M., Kopytenko, E. A., Matiashvili, T. G., Fraser-Smith, A. C., and Bernardi, A.: Results of ULF magnetic field measurements near the epicenters of the Spitak (Ms=6.9) and Loma Prieta (Ms=7.1) earthquakes: Comparative analysis, Geophys. Res. Lett., 19, 1495, 1992. Nagao, T., Enomoto, Y., Fujinawa, Y., Hata, M., Hayakawa, M.,
Huang, Q., Izutsu, J., Kushida, Y., Maeda, K., Oike, K., Uyeda, S., and Yoshino, T.: Electromagnetic anomalies associated with 1995 Kobe earthquake, J. Geodyn., 33, 401, 2002.
Park, C. G. and Miller, T. R.: Sunday decrease in magnetospheric VLF wave activity, J. Geophys. Res., 83, 943, 1979.
Pilipenko, V. A. and Fedorov, E. N.: Magnetotelluric sounding of the crust and hydromagnetic monitoring of the magnetosphere with the use of ULF waves, Ann. Geofis., 36, 19, 1993. Ptitsyna, N. G., Villoresi, G., Kopytenko, Y. A., Kudrin, V. A.,
Tyasto, M. I., Kopytenko, E. A., Iucci, N., Voronov, P. M., and, Zaitsev, D. B. : Coronary heart diseases: An assessment of risk associated with work exposure to ultra-low frequency magnetic fields, Bioelectromagnetics, 17, 436, 1996.
Tsirs, G. P. and Loginov, G. A.: Peculiarities of week variations of Pc 1 and Pi 2 geomagnetic pulsations, Geomagn. Aeron., 25, 165, 1985.
Vellante, M.: Some theoretical aspects of the two-level magneto-variational metod, Ann. Geofis., 40, 1445, 1997.
Vellante, M., De Lauretis, M., F¨orster, M., Lepidi, S., Zieger, B., Villante, U., Pilipenko, V. A., and Zolesi, B.: Geo-magnetic field line resonances at low latitudes: Pulsation event study of 16 August 1993, J. Geophys. Res., 107 (A5), doi:10.1029/2001JA900123, 2002.
Vero, J.: Experimental aspects of low-latitude pulsations-a review, J. Geophys., 60, 106, 1986.
Villante, U. and Vellante, M.: Experimental aspects of low latitude ground pulsations, in solar system plasma physics, conference proceedings, edited by F. Mariani and N. F. Ness (SIF, Bologna), 56, 189, 1997.
Villante, U. and Vellante, M.: An analysis of working days contam-ination in micropulsation measurements, Ann. Geofis., 41, 325, 1998.
Villante, U., Vellante, M., De Biase, M., Lanzerotti, L. J., and Med-ford, L. V.: Pi2 pulsations at separated sites (18=90◦): A com-parison between mid- and low-latitude observations, Ann. Geo-physicae, 10, 472, 1992.
Villante, U., Vellante, M., De Lauretis, M., Cerulli-Irelli, P., Lanze-rotti, L. J., Medford, L. V., and Maclennan, C. G.: Surface and underground measurements of geomagnetic variations in the mi-cropulsations band, Geophys. Prospect., 46, 121, 1998. Villante, U., Lepidi, S., Francia, P., Vellante, M., Meloni, A., and
Palangio, P.: ULF fluctuations at Terra Nova Bay (Antarctica), Ann. Geofis., 43, 217, 2000a.
Villante, U., Vellante, M., and De Sanctis, G.: An analysis of Pc3 and Pc4 pulsations at Terra Nova Bay (Antarctica), Ann. Geo-physicae, 18, 1412, 2000b.
Villante, U., Francia, P., and Lepidi, S.: Pc5 geomagnetic field fluc-tuations at discrete frequencies at a low latitude station, Ann. Geophysicae, 19, 321, 2001.
Villoresi, G., Kopytenko, Y. A., Ptitsyna, N. G., Tyasto, M. I., Kopy-tenko, E. A., Iucci, N., and Voronov, P. M.: The influence of ge-omagnetic storms and man-made magnetic field disturbances on the incidence of myocardial infarction in St. Petersburg (Russia), Physica Medica, 4, 107, 1994.
Webb, D. C., Lanzerotti, L. J., and Park, C. G.: A comparison of ULF and VLF measurements of magnetospheric cold plasma densities, J. Geophys. Res., 82, 5063, 1977.