Economic and Environmental Opportunities in Electronics
Industry
by
Weitong Liu
BEng. Materials Science and Engineering, Tsinghua University (2015)
Submitted to the Institute for Data, Systems, and Society in partial fulfillment of
the requirements for the degree of
Master of Science in Technology and Policy
at the
MASSACHUSETTS INSTITUTE OF TECHNOLOGY
June 2017
© Massachusetts Institute of Technology 2017. All rights reserved.
Author...
Institute for Data, Systems, and Society
10 May 2017
Certified by...
Elsa Olivetti
Thomas Lord Assistant Professor of Materials Science and Engineering
Thesis Advisor
Accepted by...
Munther Dahleh
William A. Coolidge Professor of Electrical Engineering and Computer Science
Acting Director, Technology and Policy Program
Director, Institute for Data, Systems, and Society
Economic and Environmental Opportunities in Electronics
Industry
by Weitong Liu
Submitted to the Institute for Data, Systems, and Society on May 10, 2017 in Partial Fulfillment of the Requirements for the Degree of Master of Science in
Technology and Policy
ABSTRACT
Due to industrial development and technological innovation, many problems arise from the increasing number of electronics devices that need to be managed at end of life. The two main market failures related to waste electrical and electronic equipment (WEEE) are economic loss and environmental externalities. Incomplete recovery of materials in waste mobile phones results in a great amount of economic loss. Many studies aim to improve the situation by characterizing metals within printed circuit boards (PCBs). My work focuses on the evolving composition and the flow of materials located outside of PCBs. I have discovered significant economic potential of non-PCB metals, and provide suggestions for optimization of different preprocessing steps. I recommend that preprocessors pay special attention to precious metals in fine shredding. And I have also provided strategies for plastics recycling by forecasting the demand and supply of it in Portugal. Besides opportunities for addressing environmental impact in the end-of-life stage of electronics products, there are also opportunities in other life cycle stages such as GHG savings by the enablement of semiconductors in the use stage. I identify six areas of GHG savings and provide insights for more informed policy to better evaluate the influence of technologies in the electronics industry.
Thesis Advisor: Elsa Olivetti
Acknowledgements
This work was supported by the Government of Portugal through the Portuguese Foundation for International Cooperation in Science, Technology, and Higher Education, and was undertaken in the MIT Portugal Program. Professor Paulo Ferrão and Professor Fernanda Margarido of IST in Lisbon helped scope this work and shred the materials in mobile phones. Dr. Eduardo Santos from 3DRIVERS helped analyzed the preprocessing data, which he collected as a part of his PhD. ALS Environmental in Tucson, AZ performed the ICP-OES analysis for this work. Hugo Uvegi from MIT Olivetti Group, my group mate, helped conduct the SEM for the materials characterization. I would like to thank all of them.
I would also like to thank MIT Technology and Policy Program (TPP), which provided lots of guidance, resource and support over these two years. Thanks Dr. Frank Field, Barbara DeLaBarre, Ed Ballo for being so kind and helpful.
My advisor, Professor Elsa Olivetti, has been extremely supportive all the time. She was very patient providing guidance on my research and gave me much freedom to conduct it. I also enjoy the time with all of the other members in our group and will miss them all.
Last, I would definitely thank my family and friends here. I am very glad that my parents can see my growth during my time at MIT, and they always give me the greatest support. I am also very happy that I made many great friends at MIT, making the memories here unforgettable.
Contents
Chapter 1: Introduction ... 9
1.1. Motivation ... 9
1.2. Research Questions ... 9
1.3. Overview ... 10
Chapter 2: Policy Background in WEEE Recycling ... 11
2.1. WEEE ... 11
2.2. Market Failures ... 12
2.2.1. Market Failures from Incomplete Recovery ... 12
2.2.2. Market Failures from Environmental Externality ... 13
2.2.3. Other Market Failures ... 14
2.3. Policy Interventions ... 15
2.3.1. ‘Do Nothing’ ... 15
2.3.2. Command and Control ... 15
2.3.3. Market-based Instruments (MBIs): Taxes/Trading Schemes ... 20
2.3.4. Technology and Spending Programmes ... 21
2.3.5. Non-regulatory Behavioral Interventions ... 23
2.3.6. Negotiated Agreement ... 24
2.4. Summary and Outlook ... 25
Chapter 3: Economic Opportunities in Mobile Phone Preprocessing ... 27
3.1. Mobile Phone Recycling Background ... 27
3.2. Materials and Methods ... 30
3.2.1. Materials ... 30
3.2.2. Methods... 31
3.3. Results ... 35
3.4. Discussion ... 42
3.5. Conclusion ... 44
3.6. Summary and Outlook ... 45
Chapter 4: Environmental Opportunities in Electronics Industry ... 47
4.2. GHG Savings in Electronics Industry ... 48
4.2.1. Electric Cars ... 49
4.2.2. Automatic Start and Stop System ... 51
4.2.3. Telecommuting ... 52
4.2.4. Smart Home ... 53
4.2.5. Energy Management System ... 54
4.2.6. Solar Cell ... 56
4.3. Summary ... 57
Chapter 5: Conclusions ... 58
Appendix. ICP-OES Results ... 61
List of Figures
Figure 1. Waste management hierarchy (reproduced from Kamalski, 2010) ... 12
Figure 2. Simplified recycling chain for WEEE (reproduced from Chancerel et al., 2009) ... 29
Figure 3. Dismantled mobile phone fractions ... 32
Figure 4. Shredded materials from non-PCB parts of mobile phones ... 33
Figure 5. SEM result for spring connect in mobile phone ... 36
Figure 6. Potential economic value of materials in PCB and non-PCB parts in a mobile phone during two time periods (2002-2006 and 2009-2013) ... 37
Figure 7. (a) Mass flow of non-PCB materials for every ton of waste mobile phone input during preprocessing (b) Economic flow of non-PCB materials for every 1000 tons of waste mobile phone input during preprocessing ... 39
Figure 8. Total economic loss from non-PCB parts in mobile phones during collection and preprocessing in Portugal in 2006-2014 ... 42
Figure 9. Forecast of the demand of post-consumer recycled PC for EEE and its supply from waste mobile phones in Portugal ... 44
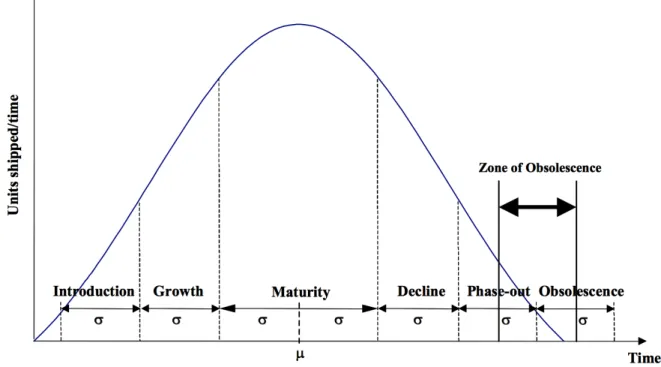
Figure 10. Definitions for a standardized life cycle curve for a device/technology group (reproduce from Solomon et al., 2000) ... 48
Figure 11. Total U.S. greenhouse gas emissions by sector with electricity distributed (reproduced from US EPA, 2015) ... 49
Figure 12. A model of an electric car (reproduced from “Electric Cars,” 2017) ... 50
Figure 13. The concept of telecommuting (reproduced from Reynolds, 2011) ... 52
Figure 14. The concept of smart home (reproduced from “Smart Home Smart Office Systems,” 2016) ... 54
Figure 15. The concept of energy management system (reproduced from Salem, 2017) ... 55
Figure 16. Solar Cells (reproduced from Despa, 2015) ... 57
Chapter 1: Introduction
1.1. Motivation
Due to significant industrial development and technological innovation, more and more problems occur in electronics industry.
One of the main problems is from WEEE. Since electrical and electronic equipment (EEE) go to the end of their life faster than ever before based on reduced lifetimes as consumers upgrade their products more frequently, a huge amount of waste is waiting to be treated. Many of these WEEEs contain abundant valuable materials that can be recovered thus landfilling them will cause a loss of resources. Some hazardous wastes can also pollute the environment and do harm to human health. Therefore, several policy interventions have been made to deal with these problems. However, to drive more informed policy in recycling, it is helpful to conduct quantitative research on economic loss and environmental externality from WEEE. Among WEEEs, mobile phones are a significant fraction of the total volume, and its economic loss from incomplete recovery is worth delving into.
Besides opportunities in the end-of-life stage of electronics products, there are also opportunities in other life cycle stages that we can work on such as GHG savings by the enablement of semiconductors. The results are able to provide insights for policy to better evaluate the influence of technologies in the electronics industry.
1.2. Research Questions
This thesis aims to identify and quantify economic and environmental opportunities in the electronic industry. Three main research questions are:
1) What is the composition of materials located outside of printed circuit boards (PCBs) in mobile phones, and what are their dynamic impacts on the recycling economics? 2) What is the flow of the non-PCB materials in mobile phones during preprocessing?
How can we optimize the preprocessing operations?
3) How much GHG emissions can be saved by enablement of semiconductors within the six chosen areas?
1.3. Overview
This thesis will be organized into the following sections:
• Policy background in WEEE recycling including market failures in economic loss and environmental externality, and policy interventions
• Characterization of materials located outside of the PCBs in mobile phones, and estimation of their dynamic impacts on the recycling economics
• Analysis of the flow of non-PCB materials in mobile phones during preprocessing, and identification of steps to be improved
• Forecast of the demand of recycled plastics for EEE in Portugal, and suggestions for the supply to meet the demand
• Identification and quantification of GHG savings by enablement of semiconductors within the six chosen areas
Chapter 2: Policy Background in WEEE Recycling
Portions of this chapter are based on a final paper in a MIT course IDS.412 Science, Technology and Public Policy.
2.1. WEEE
We are living in an era where the EEE market is growing very fast around the world. One of the important evidences is that the lives of EEEs are getting reduced drastically. Taking the mobile phone as an example, its life is no more than three years in both developed and developing countries (Vats and Singh, 2015). The fast development also means that an increasing amount of WEEE is generated every year despite the global efforts to management them (Hischier et al., 2005). About 40-70 million tons of WEEE is being generated annually around the world (Vats and Singh, 2015). The WEEE directives classified WEEE into 10 categories: 1) large household appliances, 2) small household appliances, 3) IT and telecommunications equipment, 4) consumer equipment, 5) lighting equipment, 6) electrical and electronic tools, 7) toys, leisure and sports equipment, 8) medical devices, 9) monitoring and control instruments, 10) automatic dispensers (Environment Agency, 2012). Typical WEEE materials include gold, silver, palladium, copper, lead, tin and etc. Many of them are hazardous materials and if not discarded properly, they can cause huge economic losses as well as serious environmental impacts. So a waste management hierarchy (Figure 1) is created (Kamalski, 2010). Prevention of wastes is on the top, followed by minimization, reuse, recycling, energy recovery and disposal. The higher position the option is in, the more priority it has in order to reduce and manage wastes. For management of WEEE, prevention and minimization are usually
Figure 1. Waste management hierarchy (reproduced from Kamalski, 2010)
2.2. Market Failures
2.2.1. Market Failures from Incomplete Recovery
Economic efficiency occurs when resources are best allocated with minimal waste and inefficiency. However, in current WEEE management systems, there is an incomplete recovery of materials and an over-production of wastes. Different from food wastes or paper wastes whose economic contributions are small, WEEE contains a huge amount of valuable materials like gold and silver, and an inappropriate disposal of them will cause great economic losses.
Recycling is encouraged, but in a market without government intervention recycling only happens when the revenue from selling recycled products exceeds the cost of producing them. Therefore, to make recycling happen, there are only two ways: either increasing the price of the
recycled products, or decreasing the cost of producing them (DG Environment, 2008). When the price is not high enough to cover the cost, there will be very weak incentives to do recycling. This explains why many firms do not choose recycling when there are alternative methods and why recycling rate is usually not very high.
There are several reasons for the inequality of the prices and costs of recycled products. From the demand side, some consumers prefer primary products because they have not been contaminated, especially for recycled plastics. So there is much higher demand for primary products than recycled products. In addition, there can exist Stigler’s regulatory capture where interest groups and other political participants use the regulatory and coercive powers of government to shape laws and regulations in a way that is beneficial to them. For example, if some consumers have market power, they can push down prices with that power. From the supply side, there is technological externality to design products that are recyclable thus producers have to endure additional costs. As mentioned above, there is also similar regulatory capture where producers use market power to push up the prices of recycled products thus restricts volumes of products to be recycled (DG Environment, 2008). Any of the reasons shown here can contribute to the occurrence of market failure.
2.2.2. Market Failures from Environmental Externality
Since WEEEs contain many different kinds of hazardous materials that can be harmful to human health, another main concern regarding the end-of-life treatment of WEEEs is their environmental impacts. When WEEEs are disassembled to remove hazardous components and recover the valuable ones, there is possibility of accidental releases of hazardous substances and a risk of downstream pollution. For example, mercury inside light sources can be released into
the air of a recycling facility upon breakage of the shell. And the mechanical preprocessing by the shredding and grinding of printed circuit boards (PCBs) as well as the burning of them can give rise to the atmosphere containing substances of concern (Tsydenova and Bengtsson, 2009).
These problems are even more severe in developing countries due to the existence of informal recycling where individuals collect wastes from households and sell them to demanders. Compared to formal recycling, informal recycling can collect wastes at lower prices from households and can treat these wastes in informal workshops at lower costs. Besides, informal recycling uses manual sorting, which can separate components more accurately than the most advanced machines up to now (Chi et al., 2011). These are the reasons why it is difficult for formal recycling to beat informal recycling. However, developing countries usually lack the necessary technology or expertise to deal with the hazardous wastes properly (Hackett, 1990). For example, acids and cyanides are used to recover gold in circuit boards, and are dumped afterwards in local systems. And non-skilled labors are used in the manual separation process, resulting in release of hazardous materials (Williams et al., 2013). It is true that not all of the pollutants will lead to serious environmental problems, since the environment itself has assimilative capacity and can recover by itself. But when the damage reaches to a point that the environment cannot afford anymore, in order to avoid the situation to take an irreversible turn to the worse, outside assistance has to be needed to help with the recovery process.
2.2.3. Other Market Failures
Apart from economic losses from incomplete recovery and environmental externalities from hazardous materials, there are also some other market failures. For example, whether the market has the ability to deliver the necessary infrastructure is one particular concern.
Governments may need to incentivize investment to some extent to prevent capital market imperfections, lags in the investment coming on-line, a combination of uncertainty and long payback periods, and planning problems (Defra UK, 2011).
2.3. Policy Interventions
2.3.1. ‘Do Nothing’
There is no need of government interventions when the market is working well itself or when the costs of policies exceed benefits (Defra UK, 2011). For example, in the WEEE industry, the costs of policies include expenses on policy analysis and development, policy enactment, and policy implementation. Before making interventions, cost-benefit analysis should be done to check whether the interventions are worthy or not. Sometimes even though the benefits are great, the costs behind are even greater. In such cases, government interventions should be avoided.
2.3.2. Command and Control
2.3.2.1. RoHS Directive
In February 2003, EU adopted the Restriction of Hazardous Substances Directive 2002/95/EC (RoHS 1), aiming to reduce the environmental externalities coming from WEEEs with substitutes to replace the hazardous materials (The European Parliament and of the Council, 2003). It took effect in July 2006, and each member state is required to implement policies under the guidance of RoHS 1. The directive set content restrictions for six hazardous materials including lead, cadmium, mercury, hexavalent chromium, polybrominated biphenyl and
polybrominated diphenylether flame retardant (Ongondo et al., 2011). Four more substances were added in Directive 2015/863/EU: bis (2-ethylhexyl) phthalate, butyl benzyl phthalate, dibutyl phthalate and diisobutyl phthalate. The RoHS 2 directive (2011/65/EU) is an enhanced version of RoHS 1 improving regulatory conditions and legal clarity.
Other regions also have similar restrictions but not as strict as EU RoHS. China implemented the Administrative Measures on the Control of Pollution Caused by Electronic Information Products, known as China RoHS in 2007, which imposes regulations on some electronic information products (EIPs) while EU RoHS includes products in specified categories unless specifically excluded. California has also passed the Electronic Waste Recycling Act of 2003 (EWRA) following the EU RoHS but across a much narrower scope.
There are some criticisms of RoHS because of its effects on economy and reliability. The economic effect comes from the cost of product failures in the transition stage to comply with RoHS. And the reliability effect comes from the performance change as a result of lacking specific materials. For instance, the growth of tin whiskers in lead-free solders can lead to a handful of product failures, and manufacturers have tried a variety of ways to deal with it (“New Sn-Zn Solder Bonds at Under 200 celsius,” 2002). Fortunately, no significant numbers of failures have been reported, which is also a gain from another perspective because it has encouraged technological innovations. In addition, disadvantages usually also come with advantages. Lead-free solders in their liquid state lack the ability to flow along the metal surfaces, but have the advantage of clinging tightly to where it is (Lasky, 2006). Most importantly, decrease of hazardous contents in RoHS products largely reduces risks exposed to human health.
The WEEE Directive (Directive 2012/19/EU) became European Law in 2003, and set collection, recycling and recovery goals for all types of electrical goods. After several times of revision, the current goal for the EU is to recycle at least 2% of WEEE by 2016. The directive also emphasizes the producers’ responsibility for the entire lifecycle of their own products, known as Extended Producer Responsibility (EPR) (Gamberini et al., 2010). But it only applies to EEE placed on the market after 2005. According to the Directive, the producers are required to recycle their products from consumers and conduct end-of-life treatment in an environmental-friendly way (Ongondo et al., 2011). This shift of responsibility from local authorities and consumers to producers aimed to encourage eco-design of the products and reduce the amount of WEEE from their sources. It promotes developing products that are cleaner, more energy saving, with less hazardous contents and easier to disassemble for recycling (Gottberg et al., 2006).
Therefore, several ways to achieve eco-design include improvements on product size, serviceable life, recyclability and in use characteristics. Reducing product size can save a lot of materials but may result in complexity of products that make them difficult to disassemble. Extending product life can be realized by using durable materials but it might affect the performance of products after used for several years. Same problem can also apply to the products with fewer components and less complexity but higher possibility of recycling. Improving performance in use also faces the risk of failure due to changes in structures or components (Gottberg et al., 2006). Despite the disadvantages of eco-design, a huge benefit is the reduced harm of these products to the environment.
One thing not clear is whether EPR has relationship with eco-design or not. Producers can pass costs and the pressure from the WEEE Directive to consumers without conducting eco-design, especially when the demand for the products is price inelastic. If this is true, then EPR
becomes less effective than expected. So some studies suggest EPR should work together with other drivers such as bans through the RoHS Directive, product declarations and supply chain pressures, which are more powerful (Gottberg et al., 2006).
2.3.2.3. Battery Directive
The Directive 2006/66/EC, known as the Battery Directive, was adopted in 2006 with an aim to reduce the negative impacts of waste batteries and accumulators on the environment. The most hazardous materials in batteries are cadmium, lead and mercury, and if they are improperly discarded, serious risks can be posed to human health. So the Battery Directive sets maximum quantities of certain materials in batteries and accumulators, and makes regulations on processes including collection, recycling, marking, documentation and etc. It requires that the removal of batteries from equipment should be easy for the purpose of recycling and subsequent management. It also encourages member states to establish infrastructures to better collect batteries so that less will go directly to landfills (The European Parliament and of the Council, 2006).
2.3.2.4. Regulations on Trade
As said before, developing countries have many serious environmental problems due to the inappropriate disposal of wastes. But even faced with these problems, they still find it difficult to decline the waste from developed countries because of the substantial revenue coming with dealing these those wastes. But what the recipient countries don’t know is that sometimes exporters will misinform or deceive them of the true contents of the waste.
Due to all of these reasons, regulations on trade are adopted at both national and international levels. The amended 1984 Directive from European Community (EC) allows export of waste to non-EC countries only after the receiving country agrees to accept it and demonstrates a capacity for handling the hazardous waste. The United States Environmental Protection Agency (EPA) implemented the Resources Conservation and Recovery Act (RCRA) that was enacted by the United States Congress, requiring advance written notifications of the export from parties. The World Bank provides developing countries with loans to assist in economic development projects but it will not finance any project involving disposal of hazardous waste from another country. The Basel Convention on the Control of Transboundary Movements of Hazardous Wastes and Their Disposal (Basel Convention) was endorsed by over 116 nations under the auspices of the United Nations Environment Programme (UNEP) in 1989 (Hackett, 1990). “It is the primary multilateral framework to manage flows in hazardous materials, requiring prior notification of transboundary shipments of hazardous substances, and explicit consent by the receiving country. More strictly, there are also trade bans rather than regulations. For example, China banned the import of used electronic products and parts in 2000, and the EU does not allow any export of e-scrap for processing or disposal in non-OECD countries (Williams et al., 2013).”
Trade regulations provide guarantees for reliable transactions to some extent, especially when there are information barriers. Because of the existence of the regulations, exporters of electronic wastes will not be able to act boldly, thus damages to the recipient countries can be reduced or avoided. In addition, since regulations are coercive economic instruments, lower monitoring costs have to be spent (Defra UK, 2011). It also encourages innovation of technology to find out better ways dealing with the wastes. Just as the Porter hypothesis suggests, “strict
environmental regulation triggers the discovery and introduction of cleaner technologies and environmental improvements, the innovation effect, making production processes and products more efficient (Wagner, 2003).” However, there are a number of concerns regarding trade regulations. The first one is the effectiveness of these policies in practice. For instance, even though e-scrap exportation is banned around Europe, anecdotal evidence suggests there are still widespread violations (Williams et al., 2013). Second, regulations can solve the problems in many cases but may not be the most effective approach. Even if foreign e-wastes do not pollute domestic environments, domestic electronic wastes are still generated. Trade regulations are not able to solve this problem fundamentally. As long as informal recycling exists, there are always environmental problems associated with it (Williams et al., 2013).
2.3.3. Market-based Instruments (MBIs): Taxes/Trading Schemes
Market-based instrument is a type of instrument used to reduce the amount of waste. The costs of environmental externalities can be reflected by taxes and trading schemes. For example, a Landfill Tax, the UK’s first environmental tax, was introduced by the UK Government in 1996. There are two aims associated with it. First, it ensures that the environmental cost from landfill wastes is properly priced. Second, it encourages sustainable waste management towards recovery, recycling, reuse, and if possible, reduction (Martin and Scott, 2003). The justification is that by increasing the cost of landfill, different agents will automatically turn to other more sustainable options. But in practice it seems that tax itself is not powerful enough to achieve this purpose. Another expectation from launching the Landfill Tax is to raise money and apply part of the money to promote a more sustainable approach of waste management. There are also several problems with it. First, the money raised may also be used for other purposes like
education, insurance, etc. besides only promoting sustainable waste management. In this case, there might not be as much as money as expected put into managing the wastes in practice. Second, it is still kind of acceptable if the money goes to other directions as long as it can also benefit the society. What makes things worse is the potential existence of corruption, which greatly impedes the whole progress in promoting sustainable waste management. Third, even if all of the tax is used for managing the wastes, it is still inadequate because a comprehensive prorgramme needs to be support if the government wants to solve the problem effectively (Morris et al., 1998).
An example of the trading scheme is the Landfill Allowance Trading Scheme (LATS) that was launched in 2004 and aimed to help England reduce the amount of waste sent to landfill. It was found that LATS, together with the Landfill Tax, has reinforcing positive effects (Calaf-Forn et al., 2014).
Market-based instruments are effective when individuals and firms are sensitive to price changes and when costs to them are unknown. For the WEEE industry, however, taxes and trading schemes may not be necessarily suitable because they are too weak incentives to prevent hazardous wastes from going to landfills where the environmental costs are pretty high (Defra UK, 2011).
2.3.4. Technology and Spending Programmes
Investment grants and subsidies is another method to encourage sustainable waste management (Defra UK, 2011). In 2011, China enacted the home appliances trade-in policy with funds from central government and provincial authorities. Consumers were able to get subsidies of 10% when buying new appliances if they have the old ones diverted to recyclers. Statistics
showed that during the implementation period of the policy, the number of the waste home appliances (WHA) collected reached 57.61 million units – nearly 14% of the total WHA generated in China. Unfortunately, due to the financial burden, the policy only lasted for two years (L et al., 2014). But the good side of this method is that it let to significant enthusiasm of consumers, which seldom can be achieved by other methods.
Another form of funding is realized by the private finance initiative (PFI) where public infrastructure projects are funded with private capital. Sometimes due to the borrowing restrictions, local authorities are not able to get money from central government. But solving the landfill problems still needs a great amount of investment in order to meet targets, so other sources like PFI become very attractive (Ball et al., 2006; Davies, 2007). A study was once carried out in a UK county council that used the PFI to fund an £850 million waste disposal contract. On one hand, PFI creates “public-private partnerships” (PPPs) and provides an alternative solution to the government funding alone. On the other hand, the purpose of the government was to encourage eco-modernization, but local authorities have waste management targets to meet, thus what is realized in practice is often chemico-energy modernization. That is the reason why building incinerators under PFI is very attractive. It is a choice both out of its simpleness of realization and the pressures from EU’s landfill directive to reduce landfill dumping (Ball et al., 2006). However, technology innovation needs to be taken into consideration when signing contracts because what seems to be a promising method currently may not still be the most effective way to deal with waste disposals in the next couple of years. In an age of fast development of technology, better methods are constantly come up with and replace the old ones. Hence, there should be greater flexibility for future adjustment in the
contracts (Davies, 2007). With more investments and subsidies, PFI can also in turn promote the development of technology.
2.3.5. Non-regulatory Behavioral Interventions
Non-regulatory behavioral interventions such as information and public engagement programme can be used to reduce wastes in the production stage. UK has been doing very well in this area. In Wales, Waste Aware Wales has developed a seasonal WEEE press release. In Scotland, Zero Waste Scotland is also promoting WEEE recycling on their website. And in England, Recycle Now has developed a communications campaign “Don’t bin it, bring it” to raise public awareness of the necessity of WEEE recycling and how to achieve it. Instead of simply throwing WEEEs away since their importance is easy to be ignored due to the relatively small size, householders are encouraged to take them to nearby recycling centers.
Non-regulatory behavioral interventions have quite a few advantages. First, they are useful tools to overcome information barriers. Many households and firms know that there is a great amount of valuable materials embedded in WEEEs, but they just lack the relevant knowledge or skills to properly dispose of them thus resulting in both economic losses as well as environmental externalities. Therefore, there is necessity to increase public awareness and educate them how to do recycling properly. This method is used when it is possible to convey the concepts and instructions in clear and simple messages. Second, the method also paves the way for the implementation of other interventions, making them more efficient. But it only works when there is no rush to getting immediate response from the public because the spread of information requires some time delay. Third, different from substantial subsidies given to technological innovation in waste management, non-regulatory behavioral interventions are
much cheaper, and no additional costs have to be imposed to firms or individuals. However, one big problem with this kind of method is its weak effectiveness, since it is not mandatory and there is weak incentive to follow these interventions. So it is reasonable that governments just use this method in conjunction with other instruments to achieve environmental goals (Defra UK, 2011).
2.3.6. Negotiated Agreement
Instead of mandatory regulations, governments can also negotiate with other governments or private parties and reach an agreement on how to better solve the environmental problems. In 1996, Intel Corporation being the first major U.S. manufacturer participated in Project XL, which is a negotiated regulation between EPA and Intel aiming to achieve performance superior environmental and economic results. Since Intel makes manufacturing changes for more than 30 times a year and each time it needs a new air permit from EPA, a five-year permit is made under Project XL for its new facility in Chandler, Arizona, so that Intel will not have to ask for an air permit every time a change is made (Environment Policy Committee, 2003).
Through this method, regulation costs can be avoided but there are still negotiation costs. Sometimes the negotiation costs can also be very high. The method is usually used when there is still some room for negotiation. Otherwise, coercive regulations would be a better choice. That is why negotiated agreement is often used when the environmental risk is not very high while regulation is used when it is high. Information asymmetry can also cause a problem. Firms usually know more about its own products, operations, environmental impacts, etc., and therefore are more likely to make use of this information asymmetry and create capture. As a
result, the agreement may not be equally fair to both parties, and the environmental externalities from disposal of WEEEs may not be properly reflected in the agreement (Defra UK, 2011).
2.4. Summary and Outlook
In this Chapter, I discussed two market failures resulted from the fast development of EEE industry: 1) economic losses from incomplete recovery of WEEE, and 2) environmental externalities from hazardous materials in WEEE. The formal market failure comes from the inequality of the prices and costs of recycled products, and the latter one comes from collective action problems as well as informal recycling in developing countries. Several policy interventions have been developed to deal with these problems. Command and control is a relatively common and effective tool. The RoHS Directive was enacted with standards to restrict contents of hazardous materials in EEEs, and WEEE Directive sets recycling goals and emphasizes EPR to promote eco-design. Trade regulations prevent developed countries from selling wastes and exerting environmental burdens to developing countries, but may not be able to solve the problem fundamentally. Market-based instruments like taxes and trading schemes aim to reduce the amount of wastes by increasing their cost of generation, with a disadvantage of not being powerful enough to promote WEEE recycling. Technology and spending programmes are used when investment is insufficient to deal with the wastes. PFI is an example though the funding is from private capital rather than central government. It provides an alternative way of collecting funds, but the environmental problems are not always solved in the most efficient way because local authorities have regulation standards to meet. Besides mandatory regulations, there are also non-regulatory behavioral interventions such as information and public engagement programmes as an auxiliary instrument to arise public awareness of recycling. When the
environmental risks are not very high, negotiated agreement is another tool to solve problems based on specific situations. Sometimes several different instruments can be combined together to reduce environmental externalities and realize the highest economic value from WEEEs.
Among WEEE, waste mobile phones form a significant volume of the waste generated. In Chapter 3, I will examine the evolving composition of metals and plastics that are located outside of the PCBs in mobile phones and their dynamic impacts on recycling economics. I will also analyze the flow of these non-PCB materials during preprocessing in order to provide suggestions for preprocessor to improve recycling efficiency in manual and mechanical dismantling. Finally, I will forecast the demand of recycled plastics for Electrical and Electronic Equipment (EEE) in Portugal and provide suggestions for the supply to meet the demand with part of the results from our work.
Chapter 2 and 3 discuss the policy interventions and economic opportunities in electronics industry from the perspective of WEEE. In Chapter 4, I will focus on identifying environmental opportunities in electronics industry from another perspective, namely, semiconductors. Even though the use and manufacturing of semiconductors emit lot of GHG, the enablement of them in different areas can help reduce GHG emissions by saving energy use. Chapter 4 will model GHG savings in six areas enabled by semiconductors including electric cars, automatic start and stop system, telecommuting, smart home, energy management system, and solar cell. The results are able to provide insights for policy to better evaluate the influence of semiconductors on different industries.
Chapter 3: Economic Opportunities in Mobile Phone Preprocessing
3.1. Mobile Phone Recycling Background
Due to the fast technological development in the consumer electronics industry, WEEEs are rapidly increasing despite the global efforts to manage them. According to (Vats and Singh, 2015), about 40-70 million tons of WEEE is being generated annually around the world. Special attentions are constantly paid to WEEE mainly because of two reasons: substantial environmental and economic losses caused by these devices (Angela C. Kasper et al., 2011). Materials contained in WEEE usually include base metals, precious metals, rare earths and plastics (Palmieri et al., 2014). Some of these materials such as lead, mercury and some flame retardants used in plastics can cause environmental contamination and detrimental effects on human health if not recycled properly (Dimitrakakis et al., 2009; Hischier et al., 2005; Robinson, 2009). Besides these risks, on the other hand, WEEE materials are also very valuable, which provide another incentive for effective recycling. Compared to precious metals in ores, the concentration of them in PCBs can reach tenfold higher (Wäger et al., 2011). However, most of the materials are lost during the recycling process. In Europe, for instance, the amount of WEEE generated is 12 million tons per year while only 2.2 million tons are treated (Menad et al., 2013). Among these WEEEs, mobile phone waste is a very important part of it as a result of the fast developing IT industry. It is estimated that around 10 million kilograms of mobile phones are discarded yearly (Yamane et al., 2011). This number is not likely to decrease in the near future, since the decreasing lifetime of mobile phones makes the amount of waste generated stay high.
To recover the maximum values from mobile phones, efforts can be made along recycling chain (Figure 2), which includes waste collection, preprocessing and end-processing.
Preprocessing plays a key role in connecting collection and end-processing because it determined the subsequent end-processing streams the substances should be steered into after collection.The effectiveness of preprocessing is very important for the reason that an incorrect categorization of substances in this step probably means a complete loss of them over the entire recycling chain (Chancerel et al., 2009). For the preprocessors to get more materials recovered, they need to know 1) where materials such as metals and plastics are located and 2) how to optimize current preprocessing operations for a given set of devices or device components.
For the reasons above, a good understanding of the mobile phone composition becomes essential. A typical mobile phone comprises of PCBs, battery, front and back cases and display unit. Most studies just focus on the characterization of metals within PCBs, since it has the highest concentration and is relatively easy to disassemble compared to other components in mobile phones (Angela C. Kasper et al., 2011; Palmieri et al., 2014; Vats and Singh, 2015; Yamane et al., 2011). (Vats and Singh, 2015) assessed the recoverable metallic fraction of gold and silver from PCBs of mobile phones. (Yamane et al., 2011) did similar work but also examined other metals in PCBs. Several studies did characterization of metals on the device level (Chancerel et al., 2015; Chancerel and Rotter, 2009; Christian et al., 2014; Oguchi et al., 2011, 2013). (Oguchi et al., 2011) estimated the composition of metals in mobile phones where Fe, Al and Cu in different components such as PCBs, metallic housings, frames and cables are taken into consideration while for the other metals only the amount in PCBs are calculated. (Christian et al., 2014) have examined 38 elements in mobile phones, and have explored the connection between material composition and economic value in great details, but did not present a dynamic analysis in which the impacts on recycling of composition over time are considered. There are also some studies looking into plastics, LCD screens and other assemblies
(Maragkos et al., 2013; Moltó et al., 2011; Palmieri et al., 2014). (Palmieri et al., 2014) studied composition of plastics in mobile phones but just qualitatively and focus on plastic frames alone. (Moltó et al., 2011) also did work on mobile phone case, but instead of plastics composition, they investigated its thermal decomposition. (Peeters et al., 2015) forecasted the annual collection of plastics from TVs and monitors, though not phones.
Figure 2. Simplified recycling chain for WEEE (reproduced from Chancerel et al., 2009)
preprocessing becomes necessary. Many studies have characterized mobile phones with respect to recycling operations, specifically the preprocessing stage including manual and mechanical dismantling, and the downstream refining stage (Chancerel and Rotter, 2009; Angela C. Kasper et al., 2011; Oguchi et al., 2011; Palmieri et al., 2014; Yamane et al., 2011). These studies either more focused on characterization of the refining process rather than preprocessing or did not include the dynamic impacts of evolving material flows on the economics of mobile phone recycling. (Chancerel et al., 2009) tracked the material flow in WEEE preprocessing and discussed the economic impacts, but still stated that the location of target materials introduced uncertainty into their analysis and the result may not be accurately applicable to mobile phones.
Therefore, our work aims to fill two gaps: 1) examining the evolving composition of metals and plastics that are located outside of the PCBs in mobile phones, and their dynamic impacts on the recycling economics; 2) analyzing the flow of these non-PCB materials during preprocessing in order to provide suggestions for preprocessor to improve recycling efficiency in manual and mechanical dismantling. Finally, we also forecast the demand of recycled plastics for EEE in Portugal and provide suggestions for the supply to meet the demand with part of the results from our work.
3.2. Materials and Methods
3.2.1. Materials
24 mobile phones collected at several different locations in the US were studied: 13 were manufactured during 2002-2006, and the other 11 were during 2009-2013. The brands analyzed included Motorola, Nokia, LG, Samsung, and Pantech.
3.2.2. Methods
The analysis completed by (Ford et al., 2016) contains a complete breakdown of the methods used in the product flow analysis (PFA) that was also employed here. However, the PFA used in this analysis focused only on the non-PCB parts in mobile phones and do not consider metals in batteries. The economic data, sales data, collection data all remained almost the same before 2015, though there are some small adjustments. We added the price of plastics in the economics part and the sales of mobile phones in year 2014 and 2015 in the sales part, and updated the composition to include more references (Ari, 2016; Christian et al., 2014). For period after 2015, several assumptions were made for the forecast of the demand and supply of recycled plastics in Portugal. The most significant updates of the whole model were to the material composition data and the preprocessing data. We included additional studies from the literature and the results of the ICP-OES testing to the composition data where it was divided into three time periods, 2002-2006, 2007-2008, and 2009-2013 . We also did a more detailed material flow analysis for preprocessing according to different manual or mechanical shredding processes.
3.2.2.1. Composition
The analysis to determine the material composition outside of PCBs was performed by manual dismantling, SEM/EDS analysis, mechanical shredding, and ICP-OES analysis. Materials discussed here include: silver, gold, palladium, platinum, copper, cobalt, nickel, tin, tantalum, tungsten, aluminum, ferrous metals, polycarbonates (PC) and acrylonitrile butadiene styrene (ABS). Detailed characterizations were only conducted for metals, and the composition
existence of flame retardant were taken into consideration when calculating compositions (Palmieri et al., 2014).
3.2.2.1.1. Manual Dismantling
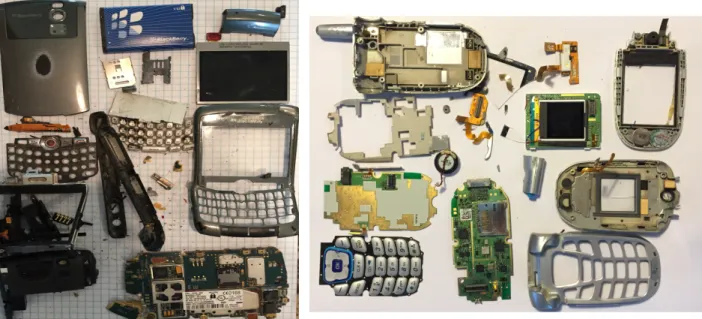
Phones from two different time periods were dismantled using handheld tools and the process was carried out in a non-destructive manner so as to limit the loss of materials in the form of dust or small debris (Figure 3). Both the total mass and the mass of PCBs for each individual device were weighed.
Figure 3. Dismantled mobile phone fractions
3.2.2.1.2. SEM/EDS Analysis
SEM/EDS analysis was conducted to characterize several mobile phone pieces that were located outside of the PCBs, and only the qualitative portion of the output data was used. SEM/EDS is a commonly used technique for characterizing the materials present on the surface of a given sample.
The machine used to carry out the analysis was a Philips XL30 FEG ESEM. The Philips machine is described as a “high performance, extremely flexible and well-equipped microscope for general-purpose microscopy, low-vacuum and environmental scanning microscopy (ESEM). It is also equipped with a Peltier Stage. Resolution at 30KV is 3.5 nm. The minimum magnification is about 20x.”
3.2.2.1.3. Mechanical Shredding
The non-PCB parts from these 24 phones were shredded down to a size of approximately 0.25 mm using a Retsch SM 2000 with tungsten carbide blades (Figure 4).
Figure 4. Shredded materials from non-PCB parts of mobile phones
3.2.2.1.4. ICP-OES Analysis
Following shredding, the non-PCB/Battery materials were sent to be analyzed by ALS Environmental in Tucson, AZ using ICP-OES. The result from phones in 2009-2013 was also
barium, beryllium, cadmium, calcium, chromium, cobalt, copper, neodymium, gallium, gold, iron, lead, lithium, magnesium, manganese, molybdenum, nickel, palladium, phosphorous, platinum, potassium, selenium, silicon, silver, sodium, strontium, tantalum, tin, titanium, tungsten, vanadium, zinc, and zirconium. But in this paper, the metals we will focus on are just silver, gold, palladium, platinum, copper, cobalt, nickel, tin, tantalum, tungsten, aluminum, and iron.
The lab that carried out the analysis noted that approximately 120-140 mg of sample was ashed at 750 °C and 50 mg were then digested using HF, HNO3, and HCl in a microwave
followed by ICP-OES analysis. Antimony, arsenic, cadmium, lead, and selenium were not ashed, and were digested as received.
3.2.2.2. Preprocessing
To analyze the material flow during preprocessing into details, we examined different steps including manual dismantling, medium shredding and fine shredding. Among the 16 Portugal preprocessing facilities which we have data, 13 facilities have manual dismantling and medium shredding steps while the other three have an additional fine shredding step during preprocessing. Here we use the result from the three facilities for discussion, since it contains a more complete preprocessing process and the results from manual dismantling and medium shredding are not much different from those of the 13 facilities. The original data was for WEEEs, but we just used the ones applicable to mobile phones.
Since not many studies have done analysis to forecast the supply of plastics from waste mobile phones and how it meets the demand of plastics in Portugal, we make several assumptions here to do the forecast for the time until 2025.
The overall demand of plastics for EEE in Portugal from 2007 to 2015 was estimated from the data in the report of PlasticsEurope. Here we just focus on PC because it is the main output of waste plastics. For time period after 2015, the demand was assumed to be the average of previous years and kept constant because there is no such trend of big fluctuations. What needs to be pointed out is that the demand we looked at was not the overall demand but the demand from post-consumer recycled (PCR) plastics, since these are the fractions that can be supplied by plastics in waste mobile phones. We assumed the PCR to be 20% for EE category. From the supply side of waste plastics, the sales data for 2016-2015 were estimated according to the increasing rate of that before 2015. The collection rates were assumed to meet the goals of WEEE Directive, which are 45% from 2016 to 2018 and 65% after 2019. In our model, PC goes through the same preprocessing process as described above. After that, it is separated by NIR separator and sink float separation before gets fully recovered. An additional consideration is the loss of materials during processing, which we assume to be 20%.
3.3. Results
The rapid technological development and the diversity of materials in mobile phones provide incentives to investigate the economic potential from recovered materials. We focus specifically on materials outside of PCBs, since there are already lots of studies working on either PCB level or device level. Not only do we examine the composition of materials outside of PCBs and their impacts on the recycling economics, we also take evolvement into consideration
and think about the impacts from a dynamic perspective. We track the flow of non-PCB materials during preprocessing as well to identify the inefficient steps in manual and mechanical dismantling for improvement. The results below indicate the huge economic potential for non-PCB materials recovery and help us point out correct directions to solve the problem.
Figure 5 shows the SEM result for spring connector, from which we can see the existence of gold in the non-PCB parts in mobile phones.
Figure 5. SEM result for spring connect in mobile phone
Figure 6 shows the potential economic value contained in PCB and non-PCB parts of a mobile phone in 2002-2006 and 2009-2013. Here we provide the results of 12 metals and 2 plastics. As we can see in Figure 6, the total economic value from metals and plastics outside of PCBs in 2009-2013 (red bar) are about half that of PCBs of the same time period (blue bar). Similar results can also be found for other materials except palladium. The total economic value
generated from non-PCB materials of waste mobile phones in 2013 can scale up to 5.9 million dollars, indicating a big economic potential that could be recovered, especially from gold and palladium. It is estimated that 1000 kg of waste mobile phones can yield about 300-500 g of gold along with other metals while this number for a ton of ore from gold mines is just about 5 g (Hagelüken and Corti, 2010; Sarath et al., 2015).
When comparing the results of non-PCB parts in 2002-2006 (green bar) and 2009-2013 (red bar), we can find the over time trend of decreasing economic value in non-PCB parts, which applies to all materials contained. This provides challenges for preprocessors, since both the decreasing mass of materials, and the increasing complexity of devices and difficulty to disassemble make it even harder to recover the materials from non-PCB parts.
Figure 6. Potential economic value of materials in PCB and non-PCB parts in a mobile phone during two time periods (2002-2006 and 2009-2013)
Once we know the information of composition and economic potential of materials outside of PCBs in mobile phones from the figures above, the next question would be how to
0.0 0.2 0.4 0.6 0.8 1.0 1.2 Ag Au Pd Pt Cu Co Ni Sn Ta W Al Fe PC ABS Tota l Ec o n o m ic Va lu e per Ph o n e ($ ) Non-PCB (2002-2006) Non-PCB (2009-2013) PCB (2009-2013)
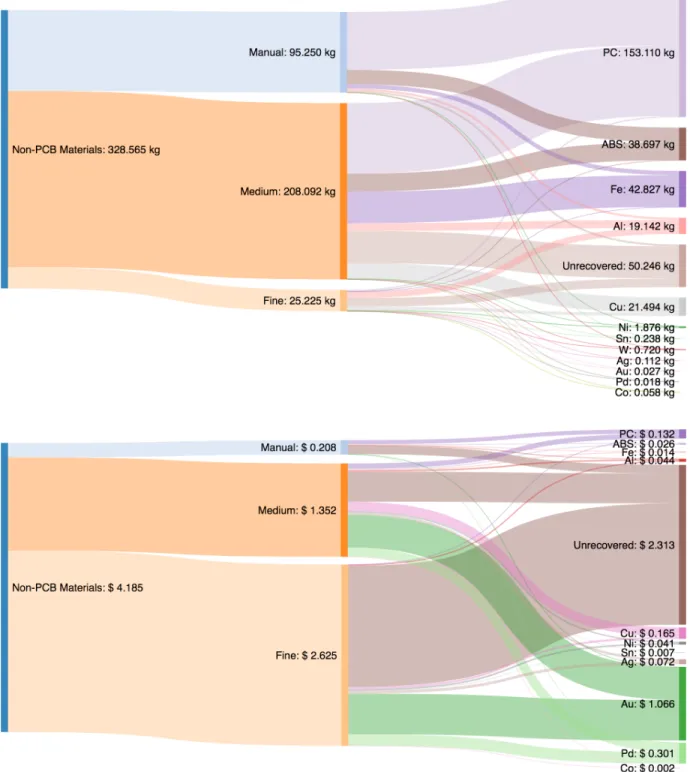
optimize the preprocessing operations in order to get the maximum recovery of these materials. The mass and economic flow of non-PCB materials in Figure 7 can help us analyze the preprocessing efficiency of different materials in different preprocessing steps. Composition data from phones manufactured in 2009-2013 were used to calculate the flows. In Figure 7a and 7b, the left sides indicate the three steps non-PCB materials go through during preprocessing: manual dismantling, medium shredding and fine shredding, and the right sides indicate the material or economic outputs from each step. The widths of the bands are proportional to the volumes of the flows.
As we can see from the right side of Figure 7a, for every ton of waste mobile phone input into preprocessing, the mass output of plastics (PC and ABS) can reach 192kg, and is much higher than any metals shown in the figure. But when comparing this result with the same side of Figure 7b, the huge mass of plastics only take up a small fraction of economic values among other materials. In contract, even though the amount of precious metals such as gold and palladium in Figure 7a is almost negligible, their economic values are the largest in Figure 7b. It is because precious metals are much more expensive than plastics, thus a tiny amount can make a big difference. This result points out the need to consider value-based metrics in addition to mass based metrics to improve the recovery of valuable materials.
Figure 7. (a) Mass flow of non-PCB materials for every ton of waste mobile phone input during preprocessing (b) Economic flow of non-PCB materials for every 1000 tons of waste mobile phone input during
preprocessing. The left sides indicate the three preprocessing steps: manual sorting, medium shredding and fine shredding. The right sides indicate the material or economic outputs from each step.
Turning to the left sides of Figure 7a, we can see that only a small fraction of materials go through fine shredding step. However, most of the economic values are contained in this step, as indicated in Figure 7b. Another interesting thing we can find from Figure 7b is that while shredding processes have the biggest economic potential, most of them are lost to be unrecovered. To find out what makes this high rate of incomplete recovery, we also examined the preprocessing efficiency of different materials, which implies the rate of material loss during preprocessing. We find that ferrous metals, aluminum and copper have a total efficiency of nearly 100% because they are mass relevant and easy to be sorted out. But the efficiencies for other materials can be very different depending on which steps the materials have gone through. For manual sorting, the efficiency for other metals is only 5% because most of them are contained in batteries, which is different from ferrous, aluminum, copper and plastics, thus considered to be lost. For medium shredding and fine shredding, the efficiencies for other metals are 62% and 32%, and for plastics they are 74% and 24%. It is reasonable that fine shredding has lower preprocessing efficiency compared to medium shredding because the mass of materials go through this step is very small, making it difficult to recycle those fragmentary parts. Therefore, since ferrous metals, aluminum and copper have very high preprocessing efficiencies, the low recovery rate in fine shredding is then due to the material loss from plastics and other metals, especially precious metals.
Similar conclusions can also be supported by the information in Figure 8. It shows the total economic loss from non-PCB parts during collection and different preprocessing steps in Portugal in 2006-2014. We can see that the main economic losses are from precious metals such
as gold and palladium, and from fine shredding step. The results imply that preprocessors should pay special attention to improving preprocessing efficiency of precious metals, especially in fine shredding.
The second thing we can get from this figure is that, if we add the economic losses from PC and ABS together, this number is comparable to that of silver. It means that for preprocessors, if they want to recover materials besides gold and palladium, then both silver and plastics are good choices. We mention this because usually there is less incentive for preprocessors to recycle plastics in mobile phones, since they are much cheaper than most metals. But here the result tells us that plastics have at least comparable economic potential as silver and are worthy of attentions. In addition, studies revealed that the mechanical performance of recovered plastics make it possible for their use in new products (Angela C Kasper et al., 2011; Monteiro et al., 2007; Sarath et al., 2016).
The last thing this figure shows is the comparison of economic loss between preprocessing and collection. Even though there is economic gap to be filled in preprocessing, a much bigger gap exists in collection. As can be found from Figure 8, the economic loss from collection is more than double of that loss from preprocessing. So a more efficient way to save the lost economic values from mobile phones is to increase the collection rate.
Figure 8. Total economic loss from non-PCB parts in mobile phones during collection and preprocessing in Portugal in 2006-2014
3.4. Discussion
In the result part, we have examined the composition of non-PCB parts in mobile phones, and found out that not only PCBs, these non-PCB parts also contain much economic potential to be recovered. But one of the challenges for preprocessor would be the decreasing amount of metals located outside of PCBs making recovery even more difficult as time goes by. We have also explored preprocessing efficiencies of materials in manual dismantling, medium shredding and fine shredding, and provided suggestions to preprocessors that they should focus on precious metals in the fine shredding step. At the very end, we have made a point that plastics is worthy of more attention in preprocessing, since the economic loss from it is not low but preprocessors lack incentives to consider value based metrics for plastics recovery. Here we will discuss the opportunities and challenges faced with preprocessors in plastics recycling.
0 3 6 9 12 15 18 21 24 27 Ag Au Pd Pt Cu Co Ni Sn Ta W Al Fe PC ABS Tota l Ec o n o m ic Loss fr o m N o n -PC B s (Mi lli o n s $) Manual Medium Fine Collection
Figure 9 shows a forecast of the demand of PCR polycarbonates for EEE and the supply of it from waste mobile phones in Portugal. As we can find from the figure, the demand is around 1200 tons per year and does not change much from 2007 to 2025. The supply of PC from waste mobile phones, on the other hand, cannot meet the most needs of EEE, needless to say that the supply/demand ratio is decreasing over time. To fill the huge gap between the demand and supply of PC, there are several ways by walking down the chain. First, as we can see from the biggest gap between demand and waste generation, even if all of the PC in mobile phones gets fully recovered, it is still far away from meeting the demand. A possible solution is to consider about recovering PC from other devices such as computers and printers as well, which also are big categories in WEEE and contain much plastics like PC and ABS. Second, as mentioned above, the gap between generation and collection is possible to be reduced by increasing the collection rate. WEEE Directive set standards and goals for it, but there is still much room for improvement. Third, if preprocessors work on improving the preprocessing efficiency of plastics in medium shredding and fine shredding, which has been discussed a lot in this work, it can also help increase the supply of PC. Fourth, efforts can also be put into the end-processing recovery where the main problem from recycling plastics is the existence of brominated flame retardants, including polybrominated diphenyl ethers (PBDF) and tetrabromobisphenol A (TBBA). They should be removed because they reduce the melting point of materials, making mechanical and other recycling treatment difficult, and they also raise environmental and safety concerns because they are almost entirely prohibited from burning in incineration plants (Martinho et al., 2012; Taurino et al., 2010). (Wang and Xu, 2014) discussed three technologies to recycle plastics from WEEE: pyrolysis, supercritical fluids and gasification. The material loss from these processes should be taken into consideration. Last, there is a processing step before recovered
plastics getting integrated into final products. According to (Kutz, 2011), the six main processing techniques are molding, extrusion, blow molding, thermoforming, rotational molding, and composites fabrication. Hence more materials are needed in order to make up for the loss during processing.
Figure 9. Forecast of the demand of post-consumer recycled PC for EEE and its supply from waste mobile phones in Portugal. The values for demand and supply are plotted on the primary y-axis, and the
supply/demand ratios (black solid line) are plotted on the secondary y-axis.
Therefore, future work can be done in mainly three fields: 1) exploring the supply of recycled plastics from waste computers and printers; 2) investigating the influence of flame retardants on plastics recovery; 3) considering material loss in plastics processing.
3.5. Conclusion
An increasing amount of WEEE is generated as a result of the fast development of the consumer electronics industry. One of the examples is the mobile phone where lots of valuable materials are lost due to the incomplete recovery. Not many studies work on the characterization
0% 1% 2% 3% 4% 0 200 400 600 800 1,000 1,200 1,400 1,600 Su p p ly /Demand Demand and Su p p ly of PC (T o n s) Year Demand Generation Collection Preprocessing Supply Supply/Demand
of materials outside of PCBs and especially its dynamic impact on the recycling economics, but our research have found that there are at least half the economic value from non-PCB metals compared to PCB metals. The decreasing composition of these metals located outside of PCBs also presents challenges for preprocessors. This research has also studied the mass flow and economic flow of non-PCB metals and plastics along manual and mechanical dismantling steps. Most of the economic losses are from gold and palladium during fine shredding, since the preprocessing efficiency of this step is relatively low for these precious metals. For preprocessors, if they aim to get more economic value recovered from preprocessing, not only should they pay attention to gold and palladium, they can also put efforts on plastics, which has comparable economic potential as silver. In fact, a more effective way to extract economic value from recycling is to increase collection rate, which has a bigger room to improve than preprocessing. Finally, our research also forecasts the demand of PCR plastics in EEE in Portugal and how the needs can be met by several approaches. For example, future work can look into the recycled plastics from waste computers and printers, the influence of flame retardants on plastics recovery, and plastics loss during processing.
3.6. Summary and Outlook
Waste mobile phone is an important part of WEEE. In this Chapter, I examined the evolving composition of metals and plastics that are located outside of the PCBs in mobile phones, and their dynamic impacts on the recycling economics. I also analyzed the flow of these non-PCB materials during preprocessing in order to provide suggestions for preprocessor to improve recycling efficiency in manual and mechanical dismantling. Finally, I forecasted the
demand of recycled plastics for Electrical and Electronic Equipment (EEE) in Portugal and provide suggestions for the supply to meet the demand with part of the results from our work.
Chapter 2 pointed out two problems in electronics industry from the policy side: economic loss and environmental externality from WEEE. Chapter 3 delved into the economic impact of mobile phone preprocessing. Both of them attach great importance to the end-of-life stage of electronics products. However, there are also opportunities in other stages of their life cycle that we can work on. In Chapter 4 I will focus on identifying and quantifying environmental opportunities in other stages in the electronics industry, namely, GHG savings by the enablement of semiconductors in different areas. Even though the use and manufacturing of semiconductors emit lot of GHG, the enablement of them in different areas can help reduce GHG emissions by saving energy use. Chapter 4 will model GHG savings in six areas including electric cars, automatic start and stop system, telecommuting, smart home, energy management system, and solar cell. The results are able to provide insights for policy to better evaluate the influence of technologies in the electronics industry.