HAL Id: hal-02944147
https://hal.uca.fr/hal-02944147
Submitted on 19 Nov 2020
HAL is a multi-disciplinary open access
archive for the deposit and dissemination of sci-entific research documents, whether they are pub-lished or not. The documents may come from teaching and research institutions in France or abroad, or from public or private research centers.
L’archive ouverte pluridisciplinaire HAL, est destinée au dépôt et à la diffusion de documents scientifiques de niveau recherche, publiés ou non, émanant des établissements d’enseignement et de recherche français ou étrangers, des laboratoires publics ou privés.
Radon Activity in Volcanic Gases of Mt. Etna by
Passive Dosimetry
Luca Terray, Pierre-Jean Gauthier, Vincent Breton, Salvatore Giammanco,
Olgeir Sigmarsson, Giuseppe Salerno, Tommaso Caltabiano, Alain Falvard
To cite this version:
Luca Terray, Pierre-Jean Gauthier, Vincent Breton, Salvatore Giammanco, Olgeir Sigmarsson, et al.. Radon Activity in Volcanic Gases of Mt. Etna by Passive Dosimetry. Journal of Geophysical Research : Solid Earth, American Geophysical Union, 2020, 125 (9), pp.e2019JB019149. �10.1029/2019jb019149�. �hal-02944147�
1
Radon activity in volcanic gases of Mt. Etna by passive dosimetry
1
Luca Terray1,2, Pierre-Jean Gauthier1, Vincent Breton2, Salvatore Giammanco3, Olgeir Sigmarsson1,
2
Giuseppe Salerno3, Tommaso Caltabiano3 and Alain Falvard2.
3
1 Laboratoire Magmas et Volcans, Université Clermont Auvergne, Aubière, France
4
2 Laboratoire de Physique de Clermont, Université Clermont Auvergne, Aubière, France
5
3 Istituto Nazionale di Geofisica e Vulcanologia, Osservatorio Etneo, Catania, Italy
6 7 8 9 10 11 12 13 14 15 16 17
2
Abstract
18
Radon (222Rn) activity in air was measured for about six months at the summit of Mt. Etna Central
19
Crater (Sicily) by integrative radon dosimetry at two different heights above ground level (5 cm and 1 20
m). This technique for air radon monitoring proved operational in the harsh volcanic environment of 21
Mt. Etna summit with a 94% recovery rate of dosimeters. In the South-East sector exposed to the main 22
gas plume, mean radon activity in free air (height 1 m) is significantly higher than the local background 23
and the ground level activity (height 5 cm). The results strongly suggest that the plume is enriched in 24
radon by ≈ 550 Bq/m3, which has never been evidenced before. Radon activities also reflect soil
25
degassing occurring in the proximity of the crater, with increased ground level activities in zones of 26
enhanced soil fracturing and degassing. Radon measurements also revealed a hotspot in front of the 27
Voragine vent with extraordinary high levels of air activities (26 kBq/m3 at ground level and 8 kBq/m3
28
in free air). The temporal variation of radon activity was investigated by replacing a few stations half 29
way through the exposure period. The only significant increase was associated with the site located 30
under the main gas plume and correlated with eruptive unrest within the crater. Finally, air radon 31
levels higher than the recommended threshold of 300 Bq/m3 were detected in several zones on the
32
rim and could generate a non-negligible radiologic dose for workers on the volcano. 33
34
35
36
3
1) Introduction
38
[1] Radon (222Rn) is a radioactive noble gas produced by the decay of 226Ra. As such, radon abundance
39
is generally high in U-bearing geological formations, including volcanic and geothermal zones (e.g., 40
Monnin, 2001). Since the pioneering work of Chirkov at Karymsky volcano, Kamchatka (Chirkov, 1975), 41
radon measurements at active volcanoes, either in fumaroles or in soil gases, have been carried out 42
worldwide in order to investigate radon activity variations as a precursory monitoring tool (see recent 43
reviews by Cigolini et al., 2016 and Morales-Simfors et al., 2020, and references therein). Albeit 44
promising, the radon signature in soil gases and/or fumarolic discharges appears however not always 45
easy to decipher. Besides the well-known diurnal and seasonal variation of radon emissions related to 46
meteorological effects and earth tides, radon activities can indeed be affected by local variations of 47
soil temperature and humidity, local stress regime constraints and other parameters which may hide 48
the signature of magmatic processes at depth (Zimmer and Erzinger, 2003; Cigolini et al., 2016; Mollo 49
et al., 2018). 50
[2] The primary magmatic vapor released in gaseous plumes at open-conduit degassing volcanoes thus
51
could be an ideal candidate to investigate radon anomalies directly linked to magmatic processes at 52
depth. Unfortunately, almost no systematic survey of in-air radon activities in volcanic plumes have 53
been carried out so far, apart from a single study on short-lived 222Rn daughters at Mount Erebus,
54
Antarctica (Polian and Lambert, 1979). In marked contrast, emissions of the last three radon daughters 55
(namely 210Pb, 210Bi and 210Po) in volcanic plumes have been well established for more than 40 years
56
(e.g., Lambert et al., 1976). The study of 210Pb-210Bi-210Po radioactive disequilibria in magmatic gases
4
has proved efficient to infer degassing dynamics of active volcanic systems, either in a state of open-58
conduit persistent degassing (Lambert et al., 1985; Gauthier et al., 2000; Le Cloarec and Pennisi, 2001; 59
Allard et al., 2016), in an eruptive dome setting (Le Cloarec and Gauthier, 2003) or during lateral fissure 60
eruptions (Gauthier et al., 2016). 61
[3] Early experiments by Sato et al. (1980) suggested that radon is thoroughly degassed from liquid
62
silicates at magmatic temperatures, a finding later confirmed by radon analyses of freshly erupted 63
lavas (Gill et al., 1985). However, an experimental investigation of radon diffusion in andesitic melts 64
(Gauthier et al., 1999) suggested that complete radon degassing is achieved only when major gas 65
species (mostly CO2 and H2O) act as a radon carrier. Indirect evidence of sustained radon degassing
66
from erupting magmas can be found in the observation of large 210Pb deficits over 226Ra in some recent
67
lavas (e.g., Gauthier and Condomines, 1999; Berlo et al., 2006). Meanwhile, 210Pb excesses over 226Ra
68
have been observed elsewhere suggesting the reverse behavior, that is radon accumulation at depth 69
followed by its subsequent radioactive decay within the magma (e.g., Berlo et al., 2006; Condomines 70
et al., 2010; Sigmarsson et al., 2015). The question whether radon is efficiently released through 71
outgassing of magmatic volatiles at volcanic craters or decays out at depth, due to its relatively short 72
half-life of 3.8 days, remains largely unanswered because magmatic plume emissions of radon have 73
not yet been documented. 74
[4] In May 2018, we installed a network of radon passive dosimeters all around the rim of Mt. Etna
75
Central Crater, in Sicily. The dosimeters were left on site for about five months (from May 24, 2018 to 76
October 11, 2018), until their retrieval for the laboratory determination of radon activity. The first goal 77
5
of the study was to determine mean radon levels in the air around the crater in order to constrain 78
radon emissions related to volcanic plume, fumaroles, high soil degassing, or a combination of these 79
various sources. The second goal of the study was to test the capability of radon measurements in air 80
to be part of the monitoring system of active volcanoes, Mt. Etna being one of the best monitored 81
volcano laboratory in the world (Bonaccorso et al., 2004). Finally, this study was also aimed at 82
assessing the potential radiologic hazard associated to high radon levels in air around the crater, since 83
Mt. Etna summit is systematically visited every year by thousands of tourists, scientists and 84
volcanological guides, and health hazards related to volcanic gas plumes are often pointed out 85
(Delmelle et al., 2002; Hansell and Oppenheimer, 2004). 86
2) Area of study
87
[5] Mt. Etna is a stratovolcano located on the east coast of Sicily and one of the most active volcanoes
88
in Europe. Its edifice is a 3300 m above sea level (a.s.l.) high cone with a collapsed eastern flank (Valle 89
del Bove) and a complex summit morphology (e.g., Neri et al., 2017) composed of three different 90
groups of active craters (see Figures 1 and 2): (i) the Central Crater (CC) hosting two inner craters 91
named Bocca Nuova (BN) and Voragine (VOR), (ii) the North-East Crater (NEC), and (iii) the South-East 92
Craters. Its present eruptive activity is characterized by diverse eruptive styles, from purely effusive to 93
mild and violent strombolian with very energetic lava fountains (e.g., Allard et al., 2016). In addition, 94
Mt. Etna is often classified as an open-conduit volcano because of the continuous emission of large 95
quantities of magmatic gases from its main craters (Aiuppa et al., 2008; Salerno et al., 2009a). An active 96
hydrothermal system is also located at shallow depth beneath its summit (Liotta et al., 2010). 97
6
[6] This study focused on the Central Crater because persistent passive or active plume emissions from
98
Bocca Nuova and Voragine vents ensured an almost continuous presence of magmatic gases on the 99
crater rim, whereas other craters were mostly emitting gas through fumarole fields. The degassing 100
regime of the Central Crater between May and October 2018 reflects the recent eruptive activity: 101
- (i) BN and VOR craters merged after the December 2015 and May 2016 paroxysmal eruptions and 102
eruptive products totally filled the two craters (Corsaro et al., 2017; Marchese et al., 2018). 103
Subsequently, the tectonic structure of the summit was considerably modified and a swarm of North-104
South oriented fractures opened from the North-East Crater to the South-East Craters, passing east of 105
the Central Crater (Fig. 1a; see also Marchese et al., 2018). It led to both enhanced fumarolic activity 106
and increased diffuse soil degassing within the Central Crater and around it (see for instance Figure 3 107
in Marchese et al., 2018). Our field observations suggest that this degassing activity was still present, 108
albeit at lower intensity, in 2018 at the time of the study. 109
- (ii) Since May 2016, BN and VOR craters have been subsiding, progressively reforming the former 110
geometry of the Central Crater. In August 2016, a degassing pit opened on the inner east flank of VOR 111
crater twenty meters below the rim (Marchese et al., 2018; VOR vent, see Figures 1 and 2), apparently 112
draining most of diffuse emissions nearby and remained active in 2018 at the time of our 113
measurements. In early 2018, a new degassing pit opened on the west side of BN crater floor (BN1, 114
see Figures 1 and 2), where most of the degassing activity took place. 115
- (iii) In late May/early June 2018, at the start of the experiment, activity mostly consisted in sustained 116
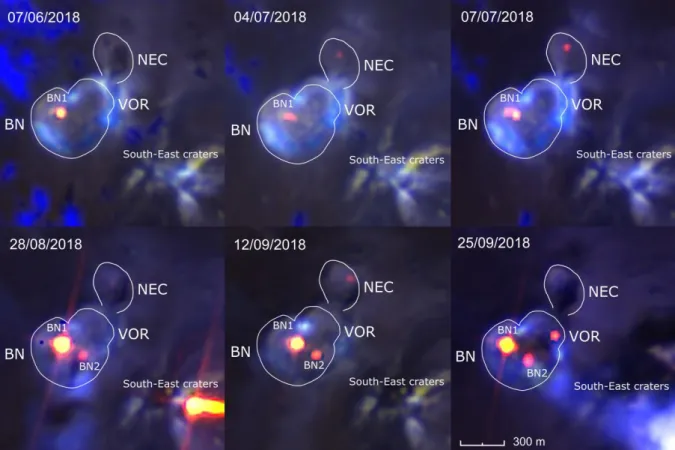
degassing from the BN1 vent, and additional mild degassing at the NE Crater (Figure 2). In the course 117
7
of summer 2018, a slight unrest occurred in the eruptive activity as witnessed by thermal anomalies 118
observed from the Sentinel imager satellite (Figure 2) and other remote sensing approaches (Marchese 119
et al., 2019), as well as an increase in SO2 fluxes (see Supplementary Material) and volcanic tremor
120
(e.g., Bollettino settimanale sul monitoraggio vulcanico, geochimico e sismico del vulcano Etna, 121
20/08/2018 - 26/08/2018, 2018). Magmatic explosions were further reported by witnesses at BN
122
(explosion bangs and visual observations of volcanic bombs ejected from the craters), this unrest 123
period culminating in the opening of a new vent on the east side of the BN crater (BN2, see Figures 1 124
and 2) in August 2018 (see Figure 4 in Marchese et al., 2019). 125
[7] Beside the activity at Central Crater, major eruptive events during the 2016-2018 period included
126
a sequence of six effusive eruptions at South East Craters in February-March 2017 (De Beni et al., 127
2019), a short strombolian and effusive episode at New South East Crater by late August 2018 and a 128
lateral fissure eruption in December 2018 (De Novellis et al., 2019). 129
3) Methods
130
[8] A temporary network of radon passive dosimeters was deployed for five months (from May to
131
October 2018) around the Central Crater of Etna and in the close vicinity of the summit area in order 132
to assess radon levels at Mt. Etna summit. The network initially consisted in 29 monitoring stations set 133
on the Central Crater rim (yellow and purple dots in Figure 1a) and 3 reference stations at distance 134
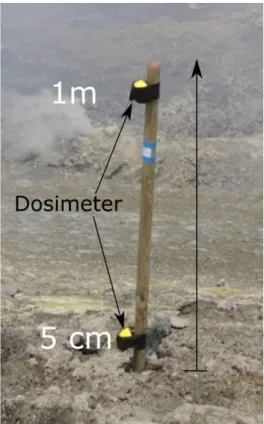
from the summit area (La Montagnola, Pizzi Deneri, Torre del Filosofo, Fig. 1b). An example of radon 135
station is shown in Figure 3. It consists of two dosimeters (one at ground level - i.e., 5 cm above ground 136
- and one in free air - i.e., at 1 m elevation) fixed to a 1.5 m high wooden stick solidly anchored to the 137
8
ground. This configuration was chosen in order to discriminate the contribution of soil radon emissions 138
from that of plume radon emissions. The bottom dosimeter would indeed mostly reveal the intensity 139
of very local soil emissions while the top dosimeter will also be sensitive to radon from further distant 140
sources and transported by the wind (such as degassing vents). In July 2018, dosimeters at five 141
monitoring stations were picked up for analysis and immediately replaced by new dosimeters. 142
Additionally, a fourth reference station was installed further from the summit area, down in the Valle 143
del Bove (Fig 1b). As a whole, no less than 76 passive dosimeters were used for this experiment. 144
[9] For this experiment, we used DPR2 dosimeters provided by the Algade company
(Bessines-sur-145
Gartempe, France). These dosimeters are made of a LR-115 (cellulose nitrate) sensitive film, 146
encapsulated in a sealed plastic half-dome in order to prevent both thoron (220Rn) and radioactive
147
aerosol particles from contributing to the measurement. The Algade company indicates a minimum 148
exposure period of two months (indoor conditions) in order to properly measure a radon activity of 149
about 20 Bq/m3. Although LR-115 films had been previously used to measure in-soil radon activities on
150
volcanoes (e.g., Seidel and Monnin, 1984), they were used for the first time in outdoor conditions on 151
a volcano during the present study. It was thus decided to leave dosimeters in the field for the whole 152
summer period (May 24 – October 11) in order to ensure sufficient radon exposure. Nonetheless, five 153
crater stations were replaced on the 6th of July 2018 with several objectives: (i) validate the
154
methodology by checking that cellulose nitrate films were not corroded by acid gases and damaged by 155
moisture, (ii) check the exposure level after two months in order to avoid film saturation and (iii) look 156
for potential temporal variations between May-July and July-October 2018. After collection of the 157
passive dosimeters in the field, they were sent to the Algade laboratory (within two days) where the 158
9
films were analyzed (see previous studies using LR-115 films for further methodological and analytical 159
details; e.g., Seidel and Monnin, 1984). Radon activities were obtained within two weeks, with a global 160
2σ uncertainty (counting statistics, calibration error, error due to temperature variations during the 161
chemical processing of the dosimeter, error coming from the slightly variable quality of the sensitive 162
films). 163
[10] Because passive dosimetry integrates radon activity in air over a long period of time (weeks to
164
months), it filters out the large variability of radon activity in air due to short-period (< 1 day) 165
fluctuations, often inherited from meteorological fluctuations (e.g. Zimmer and Erzinger, 2003). As 166
such, it is an easy-to-deploy and low-cost technics allowing determination of a mean value 167
representative of radon emission and accumulation at a given place over a given time period. 168
Moreover, a dosimeter does neither require a power supply nor data logging system and it can be 169
installed for several months even in harsh outdoor conditions without damage. 170
[11] In order to identify the zone under volcanic plume influence, wind direction and intensity over
171
the crater during the experiment period, May to October 2018, are needed. We used open-access data 172
acquired by radiosondes launched twice a day at Trapani in western Sicily 173
(http://weather.uwyo.edu/upperair/sounding.html). Wind direction and horizontal wind speed were 174
obtained from each radiosonde profile, selecting the values measured in the range of elevation of Mt. 175
Etna summit craters (between 3000 and 3400 meters a.s.l.). Although radiosonde data refer to a site 176
located 220 km away from Mt. Etna, high-altitude winds are relatively stable over long distances, 177
especially when there is no obstacle from the terrain in between, as it is the case of Sicily where no 178
10
3000m-high mountains exist apart from Mt. Etna. Trapani data are thus a good proxy for Mt. Etna high-179
altitude wind-field, as evidenced in other studies on Mt. Etna’s plume (e.g., Scollo et al., 2014). 180
4) Results
181
[12] Out of 76 installed dosimeters, only three were missing at the end of the experiment. All films but
182
one could be analyzed and did not present any sign of acid degradation. A single pair of dosimeters 183
was clogged into a cm-thick crust of soldered dust and therefore excluded from the dataset as it was 184
impossible to determine if radon could still enter the capsule. We finally obtained a global recovery 185
rate of 94% (number of interpretable dosimeters/number of installed dosimeters). This demonstrates 186
that passive dosimetry is a technique suitable for harsh outdoor volcanic conditions (windy, cold, 187
humid and acid atmosphere). 188
4.1 Spatial distribution of radon anomalies
189
[13] All results and station details are given in Table 1. The overall uncertainty on obtained 222Rn
190
activities varies between 14% and 38% with a mean value of 22% (2σ relative uncertainty). Reference 191
stations located far from the active crater zone (see Figure 1b) present a mean activity of 63 ± 18 Bq/m3
192
at ground level and a mean activity of 36 ± 9 Bq/m3 at a meter above the ground (free air). Higher
193
values near the ground are not surprising because the only source of radon far from degassing vents 194
is soil degassing. The activity found in free air is in qualitative agreement with previous radon 195
measurements in the outdoor air of Mt. Etna region, ranging from 3 to 20 Bq/m3 (Vaupotič et al., 2010).
196
[14] Radon activities measured on the crater rim are characterized by a high variability: ground level
197
activities are found in the range 40 - 26,000 Bq/m3, while free air activities range from 37 to 8800
11
Bq/m3. Despite these wide ranges of values, geographical patterns can be observed. Figures 4a and 4b
199
represent the spatial distribution of integrated ground-level and free-air radon activities measured at 200
each station in the main four sectors of the crater rim (North-West, North-East, East and South-201
West), as well as the wind directions during the exposure period. The main wind direction is from NW 202
to SE with an occurrence percentage > 80%. It is noteworthy that the NW sector presents the lowest 203
ground-level and free-air activities among those recorded all around the crater. In this sector, mean 204
activity at ground level (82 ± 17 Bq/m3) is in agreement with the respective mean background activity
205
measured at reference stations (63 ± 18 Bq/m3) while mean activity in free air (71 ± 13 Bq/m3) is slightly
206
higher than reference stations mean value (36 ± 9 Bq/m3). No statistical difference between the two
207
elevations is found, even though the mean ground-level activity is slightly higher than the mean free-208
air activity. Both NE and SW sectors show a very similar pattern with significantly higher ground-level 209
activities (155 ± 43 and 186 ± 62 Bq/m3, respectively) but low free-air activities (75 ± 10 and 90 ± 15
210
Bq/m3, respectively) similar to those in the NW sector. Finally, the SE sector presents the highest mean
211
values of both ground-level and free-air activity with mean free-air activity (704 ± 409 Bq/m3) markedly
212
higher than mean ground-level activity (301 ± 114 Bq/m3). This latter pattern implies the contribution
213
of an external radon source (i.e., different from soil degassing) transported by the wind. Since the two 214
main degassing vents of Bocca Nuova (BN1 and BN2) and the SE sector of the crater rim are aligned 215
along the main wind direction, these results strongly suggest that the observed radon anomaly might 216
be associated with the gas plume released by BN. This observation is the first direct evidence that 217
magmatic gases released in the main crater plume of Mt. Etna are significantly enriched in radon. 218
12
[15] Ground-level radon anomalies observed both in the SW and NE sectors of the crater rim are
219
coherent with the degassing phenomenology observed in the field. The SW sector of Mt. Etna’s Central 220
Crater mostly consists of a terrace covered by a massively altered yellow soil that likely results from 221
the chemical alteration of basaltic rocks by acidic soil gases. The NE sector is a highly fractured zone 222
(Marchese et al., 2018; see also Figure 1a) that also presents many features of severesoil alteration. 223
Both sectors are sites of elevated soil CO2 diffuse degassing (Giammanco et al., 2016) that is likely
224
associated with important radon soil emanations that can produce a significant radon anomaly at 225
ground level.They are also areas of intense fumarolic activity as witnessed by the water vapor intensity 226
seen in Sentinel images (see Figure 2). In marked contrast, important diffuse or fumarole degassing 227
was not observed in the NW sector, which is in agreement with the low levels of radon activity 228
measured close to ambient background. 229
[16] A hotspot of anomalous radon emission was also identified near the Voragine degassing vent (at
230
the station located twenty meters upslope of the vent, see Figure 1a). At ground level, radon activity 231
reaches 26,000 Bq/m3 whereas at 1 m height, it is 8,800 Bq/m3. No equivalent activity levels were
232
found elsewhere around the crater including at stations adjacent to the hotspot site, and no 233
progressive increase of radon activity towards it can be observed. It suggests that the hotspot is due 234
to a very localized and peculiar structure, likely related to the strong degassing from the Voragine vent. 235
In any case, this station was excluded from the computation of the sector mean radon activity. 236
4.2 Temporal evolution of radon anomalies
13
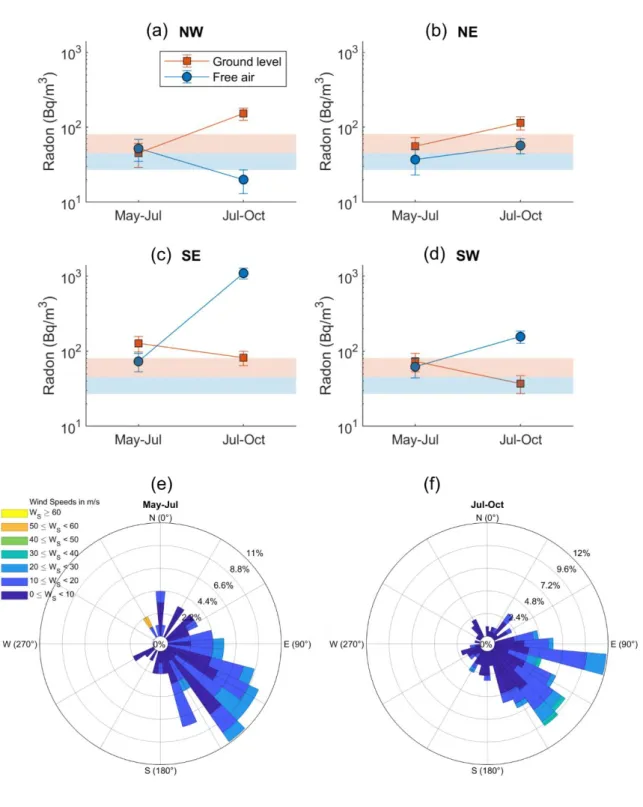
[17] Figure 5 represents, for each of the four sectors around the Central Crater (Fig. 5a to 5d), the
238
temporal evolution of radon activity at stations that were retrieved and immediately replaced in July 239
2018. Coherent patterns between the two periods of exposure can be observed for the different 240
sectors, although only one pair of dosimeters (ground-level and free-air) has been collected and 241
analyzed from each sector. For the two northern sector stations (NW and NE), free-air integrated radon 242
activities decreased (NW) or increased (NE) by a factor of ~2 during the second period of exposure but 243
remained within the range of reference values, in agreement with the hypothesis of limited influence 244
of the gas plume. Ground-level activities increased by a factor of ~3 in both cases and exhibit values 245
significantly higher than the reference level (Fig. 5a and 5b). This pattern could be tentatively 246
interpreted as resulting from enhanced soil degassing during the second period although a 247
meteorological effect , for instance due to an increased stability of the surface air layer, cannot be 248
ruled out. The two southern sector stations (SW and SE) are both characterized by a decrease in radon 249
activity at ground-level between the two periods (by a factor or ~2), hence producing values at the 250
reference level (Fig. 5c and 5d). In marked contrast, free-air radon activities are significantly higher and 251
above the reference value, which is especially obvious for the SE station where radon activity at 1 m 252
above ground level is 15 times higher than during the first period of exposure. Such decoupling 253
between ground-level and free-air activities excludes any interpretation based on a modification of 254
the local soil radon flux (either from meteorological or volcanological origin). In which case, an even 255
more important increase of ground-level activity should have been observed too. In fumaroles, 256
rainfalls can trigger positive radon anomalies but such induced radon enrichments usually are of much 257
lower magnitude (Zimmer and Erzinger, 2003). Furthermore, weather conditions during the whole 258
14
period of the experiment were rather calm, with rare rainy events evenly distributed at the end of the 259
spring season and the beginning of the fall season. Since both wind direction and speed were similar 260
during May-Jul and Jul-Oct periods (see Fig. 5e and 5f), it can thus be suggested that the tremendous 261
increase in free-air radon activity observed at the SE station is related to the volcanic plume itself, 262
especially because this station was installed in the windiest part of the SE sector (Fig. 4), downwind 263
the active Bocca Nuova vents. Although sustained degassing activity occurred throughout the study 264
period, it is worth noting that several signs of volcanic unrest were noticed, starting mid-July 2018 right 265
after the new sets of dosimeters were installed around the crater rim. Evidences for this unrest may 266
be found in the occurrence of strombolian explosions within the Central Crater (see also section 2 and 267
Marchese et al., 2019), increasing thermal anomalies (Fig. 2), increasing SO2 fluxes (see Supplementary
268
Material) and higher tremor with noticeable excursions into the red alert zone (e.g., Bollettino 269
settimanale sul monitoraggio vulcanico, geochimico e sismico del vulcano Etna, 20/08/2018 -
270
26/08/2018, 2018). It thus suggests a correlation between stronger magmatic activity at the summit
271
craters and increased radon activity in the air (and possibly also at the ground level) at the summit 272
area of the volcano (see discussion hereafter). 273
5) Discussion
274
5.1 Radon enrichments in Mt. Etna gas plume
275
[18] In each summit sector of the volcano where the plume contribution is low or even virtually
276
negligible (reference stations, NW, NE (including the Voragine hotspot)and SW sectors), the ratio of 277
free-air to ground-level radon activities (termed hereafter air-soil ratio) range from 0.33 ± 0.23 to 0.86 278
15
± 0.37, with an average value of 0.53 ± 0.20. In marked contrast, the air-soil ratio in the SE sector 279
averages 2.34 ± 0.85. Together with the high mean free-air activity observed in the same sector, this 280
suggests a significant radon enrichment in the crater plume compared to the atmospheric background, 281
in agreement with a theoretical model that proposed high plume emissions of radon from open-282
conduit volcanoes due to the persistent regeneration of radon in the degassing reservoir at depth by 283
the decay of non-volatile 226Ra (Terray et al., 2018). In order to quantify this enrichment, the local
284
contribution of soil degassing must be taken into account and subtracted. To do so, we assume that 285
the air-soil ratio of 0.53 ± 20 represents the typical vertical gradient of radon activity in air from soil 286
degassing in the absence of external aerial sources, which is in qualitative agreement with 1D vertical 287
turbulent diffusion models (Jacobi and André, 1963). It can be tentatively assumed that such a vertical 288
gradient also applies to the SE sector of Mt. Etna Central Crater. Therefore, it is possible to compute 289
that the contribution from radon soil emanation at 1 m above ground level is 0.53 × 301 (mean ground 290
level activity) = 160 Bq/m3. Considering the average free air radon activity for the SE sector (704 Bq/m3,
291
Table 1), this leads to a radon enrichment in the plume of 704 – 160 ≈ 550 Bq/m3.
292
[19] This figure is the first direct estimate of radon activity in a gas plume released by an open-conduit 293
volcano. Nonetheless, a previous study on Mount Erebus (Polian and Lambert, 1979) dealt with plume 294
activities of aerosol-attached 218Po (the first daughter of 222Rn) in the range 170-586 pCi/m3 (6.3-21.7
295
Bq/m3). The comparison of these two estimates is not straightforward since significant radioactive
296
disequilibria prevail between radon and its first daughter in the lower atmosphere ((218Po/222Rn)
297
activity ratio as low as 0.45 during summertime, e.g. Kojima, 1996). Furthermore, a significant fraction 298
of 218Po atoms is not attached to aerosol particles and cannot be sampled by standard filtration
16
methods (Tokonami et al., 1996), this fraction of unattached atoms being preponderant in water-300
saturated atmospheres like volcanic plumes. Accordingly, the estimate proposed by Polian and 301
Lambert (1979) must be regarded as a minimum value. Conversely, our estimate of radon activity in 302
the volcanic plume is one order of magnitude lower than that measured in mid-temperature fumarole 303
discharges from VOR Crater (Giammanco et al., 2007). Because many fumaroles are located on the 304
inner walls of the Central Crater and along the fracture swarm extending from North-East Crater to 305
South-East Craters (Figure 1a), it cannot be ruled out that they contributed to the radon activity 306
measured by our monitoring stations. This contribution however, likely remains moderate since active 307
fissures in the SE sector are mostly located downslope the summit flank (Fig. 1a), so that dominant 308
winds blow fumarolic gases away from our monitoring stations. Whatever be this contribution, the 309
value of 550 Bq/m3 for the bulk volcanic plume in the SE sector thus should be regarded as a maximum
310
estimate, albeit realistic. 311
5.2 Spatial variability of radon activity and degassing pathways
312
[20] As previously discussed and apart from the Voragine hotspot, the highest radon activities were
313
measured in the SE sector of the Central Crater, which is the most exposed area to the volcanic plume 314
during the study period. Looking into more details, a significant variability of free-air radon activities is 315
observed in this sector (Table 1). The three southernmost stations in the SE sector show relatively 316
medium to high values (in the range 80-222 Bq/m3) whereas the two northernmost stations measured
317
up to 2500 Bq/m3, the highest value recorded in free-air at the summit of Mt. Etna, with the exception
318
of the VOR hotspot. These two latter stations were located not only in the windiest subsector of the 319
17
SE sector (Fig. 4b), but also the closest to the BN2 vent, a few tens of meters downwind. Furthermore, 320
passive dosimeters at one of these two stations were retrieved in July 2018 and immediately replaced 321
by new ones. While radon activity at this station remained moderate between May and July (73 ± 20 322
Bq/m3), a sharp increase was noticed for the second period, peaking at 1091 Bq/m3. Interestingly, the
323
BN2 vent opened and started to be active on August 16, 2018, which implies that the gas released from 324
the new vent could be associated with the observed radon increase during the second period of 325
exposure. This could be due either to a lower dilution of the gas plume arising from BN2, or to a higher 326
content of radon in the gas discharge from the new BN2 vent. No matter what scenario applies best, 327
these results suggest that a change in the degassing process – through the opening of a new vent – 328
can be tracked through radon monitoring in air. 329
[21] The situation is rather different for the Voragine hotspot, where the highest radon activity is found
330
at ground level. At this station, free-air radon activity could merely result from the vertical gradient of 331
radon diffusion from soil to air at 1 meter above ground level (air-soil ratio of 0.33). The high radon 332
activity at this place, thus, does not necessarily implies that the plume issued from VOR vent was 333
particularly enriched in radon. Nevertheless, extremely high radon activities next to the VOR vent are 334
not puzzling, even at ground level. This vent formed in August 2016 in a zone that was highly fractured 335
by the 2015-2016 paroxysmal episodes at Voragine Crater. Before the vent opening, those fractures 336
served as main pathways for soil gas emissions and fumarole discharges while the main degassing vents 337
within the Voragine were still plugged (Marchese et al., 2018). When the radon monitoring station was 338
installed in 2018, we measured a soil temperature of 360°C at a depth of 30 cm with a Type K 339
thermocouple placed within one sealed crack on the eastern rim of Voragine, just nearby the station 340
18
that recorded the radon hotspot. Therefore we propose that the fissure swarm on the eastern rim of 341
Voragine was one of the most permeable part of the crater structure, allowing deep gas ascent, as 342
suggested for a previous eruptive cycle (Giammanco et al., 2007). 343
5.3 Temporal variability of radon activities as a tool for volcano monitoring?
344
[22] As shown in Figures 5a to 5d, a marked temporal evolution between the two exposure periods in
345
each sector of the volcano was observed. While ground-level emissions of radon appear slightly higher 346
during the second period on the northern side of Central Craters, free-air activities are markedly 347
enriched on the southern side, especially at that station most exposed to dominant wind in the SE 348
sector (Figure 5). It suggests that most radon emissions, either through soil degassing or by plume 349
outgassing, occurred during the period July-October 2018 when the volcano was more active. 350
Increased radon activities in soils were previously noted during eruptive periods at Mt. Etna, notably 351
on the southern flank of the summit area (Neri et al., 2016). However, this is the first time that an 352
increase in radon activity is observed in a gaseous plume released from the craters of an open-conduit 353
volcano. A simple wind effect due to a change in wind direction can be ruled out since the wind regime 354
remained stable between the two periods (Fig. 5e and 5f). In the meantime, as the summit craters 355
were progressively reactivating, SO2 flux analysis suggests a gradual increase of the degassing activity
356
between May and October 2018 (see Supplementary Material). Even though the day-to-day variability 357
of SO2 flux is high, both mean and maximum SO2 fluxes are higher during the second period as well as
358
the detrended cumulated SO2 flux values (see Supplementary Material). Although the time-evolution
359
of radon activity in the plume of Etna is based on rather limited number of samples, its apparent 360
19
correlation with SO2 fluxes in a period of progressive unrest may give expectancies for the potential of
361
in-air radon measurements as a tracer of volcanic activity. 362
[23] Furthermore, while radon activity in the volcanic plume could be up to 15 times higher during the
363
July-October period (Table 1; Figure 5), it is worth noting that the SO2 flux showed a much more limited
364
increase, by about 10% (see Supplementary Material). It is well known that variations in SO2 fluxes
365
released in the atmosphere are directly proportional to the magma influx at depth (Andres et al., 1993). 366
Hence, despite slightly increased SO2 degassing during the second period, it can be assumed that the
367
amount of magma degassing per unit of time did not drastically change between the two periods. In 368
such a case, theoretical models predict that the flux of radon produced in the degassing magma is 369
constant (Terray et al., 2018). However, because radon is a radio-isotope with a short half-life (3.8 370
days), radon activity in the gas phase can vary according to the transfer time of gases from the 371
degassing reservoir to the surface (Terray et al., 2018). We can assume that the 15 times increasein 372
radon activity between the two exposure periods was solely due to a transfer time variation, which 373
would be the case if the mean plume dilution rate at the monitoring station was not significantly 374
different for the two periods and if the contribution of steaming fumaroles was negligible. An increase 375
in radon activity by a factor of 15 would be achieved in 3.9 radon half-lives. In other words, the 376
observed increase in radon activity could be explained by a transfer time of gases 15 days shorter after 377
the beginning of the July 2018 volcanic unrest. The 210Pb-210Bi-210Po systematics in Mt. Etna gases
378
allowed estimating a gas transfer time in the range of 1-3 days during eruptive events (Terray et al., 379
2018) and up to 17 days during quiescent degassing (Lambert et al., 1985). Although the 15-day shorter 380
transfer time deduced from the present study corresponds to a maximum estimate, it is in fair 381
20
agreement with the difference between the estimates of Lambert et al. (1985) and those of Terray et 382
al. (2018). It thus suggests, in agreement with the moderate increase in SO2 flux, that the summer 2018
383
eruptive activity was not triggered by an important reinjection of deep volatile-rich magma in the 384
shallow plumbing system but instead by the shallower degassing of the already present magma batch 385
(shorter transfer time of gases leading to higher radon activities). We propose that in-air 222Rn activities
386
- thanks to the radioactive properties of radon which make it sensitive to degassing kinetics and, hence, 387
degassing depth - could be an interesting monitoring parameter in addition to SO2 and other
388
geochemical and geophysical methods. 389
5.4 Radiological effects and radon hazard assessment
390
[24] The European regulations for public exposure to radon (EURATOM, 2013) recommend that radon
391
activity in working places always remains below the threshold of 300 Bq/m3 because of the potential
392
damages of this radioactive gas to the respiratory system. Exposure to high levels of radon has been 393
recognized as a major cause of lung cancer (Lubin et al., 1995). Two hotspots where radon activities 394
exceed by far this threshold were found on the crater rim of Mt. Etna, on each side of the small hill 395
between the Voragine and Bocca Nuova craters (Fig. 4b). Radon activities as high as 1 kBq/m3 are rare
396
for outdoor environments and indicate that volcanic exhalations are a major source of radioactivity 397
into the local air. Accordingly, the radon uptake through inhalation may be of concern for those people 398
who either visit the volcano or work on it (e.g., volcano guides, scientists). Radon activities measured 399
at one meter of elevation above the ground are the most relevant to assess the respiratory uptake. 400
For activities between 1.1 and 8.8 kBq/m3 (Table 1), the radiological dose rate can be calculated in the
21
range 16-131 µSv/h using a conversion coefficient of 1,5.10-5 mSv per Bq.h.m-3 (obtained from a dose
402
coefficient of 6,7 mSv per mJ.h.m-3 and an equilibrium factor of 0.4 between radon and its daughters)
403
as recommended by the International Commission on Radiological Protection (norm 137, Paquet et 404
al., 2017). For tourists spending a few tens of minutes at the summit of Mt. Etna once in a lifetime, the 405
equivalent dose transmitted to their body remains very low and most likely harmless. For instance, a 406
tourist walking on the path around the Central Crater, spending 10 minutes close to the Voragine 407
hotspot and 20 minutes on the southern slope, would receive a dose of ca. 27 µSv, which is only 2% of 408
the worldwide typical yearly exposure to radon. However, for volcano guides spending up to 4 hours 409
per day at the summit of the volcano, this on a daily basis all the touristic season long, the dose rate 410
may be significantly higher. In a probable scenario of 30 minutes exposure at the identified radon 411
hotspots once a day, the received radiological dose can be computed as: (131×10’/60’ + 16×20’/60’) × 412
10-3 (mSv/working day) × 100 (working day/y) (assuming the season peak lasts from early May to late
413
September with 5 working days a week) = 2.7 mSv/yr. This value is twice higher than the typical 414
exposure due to radon (1.26 mSv/yr, UNSCEAR, 2008). Although many other factors - out of the scope 415
of the present study - should be considered in order to refine this assessment (radon daughters 416
concentrations, radioactive aerosol particle size distribution, exact duration of exposure, use of 417
individual protective devices such as gas masks), the present study strongly suggests that radon should 418
be included in future studies on volcanic-gas-related health hazards. 419
420
22
6) Conclusions
422
[25] This first experiment of radon dosimetry in air at an active volcano revealed free-air radon levels
423
significantly higher than the atmospheric background in the zones most exposed to volcanic gases (up 424
to a few kBq/m3). Radon in such a dynamic environment could come from diffuse soil degassing, low-
425
to mid-temperature steaming fumaroles and from the main gas plume made of primary magmatic 426
vapor. In the lack of a detailed knowledge of local meteorological effects inside the Central Crater of 427
Mt. Etna, the contribution of each potential source of radon could not be deciphered. However, in the 428
SE sector of the Central Crater, the most exposed to the volcanic plume because of the main regional 429
NW wind, a significant radon enrichment was measured in air at 1 m above the ground. This 430
observation strongly supports high radon concentrations in the main gas plume (≈ 550 Bq/m3). This is
431
the first direct evidence of primary magmatic gases being significantly enriched in radon, which implies 432
that radon does not completely decay away within magmatic gas bubbles before reaching the surface. 433
The transfer time of gases between the degassing reservoir and the surface is thus as short as a few 434
days, or a few weeks at most, thus supporting previous theoretical studies. 435
[26] The main degassing pathways, either through open vents or through fracture systems, are
436
markedly identified by radon hotspots with free-air activities above 1,000 Bq/m3 and up to 8,800
437
Bq/m3. This observation confirms that radon is a useful geochemical tracer of shallow degassing
438
processes at active volcanoes. Furthermore, an increase of radon free-air activity in the SE sector, most 439
exposed to the crater plume, was observed during an episode of eruptive activity, starting in July 2018 440
and characterized by increasing SO2 fluxes, volcanic tremor and surface manifestations. Interestingly,
23
radon activities increased up to 15 times during the volcanic unrest. Such pattern is best explained by 442
a 15-day shorter transfer time of gases from a constant volume of magma, or in other words by 443
degassing occurring at shallower depth beneath the active craters. The results of the study should 444
encourage further studies on radon in volcanic plumes in order to fully appraise the potential of radon 445
monitoring in ambient air at active volcanoes as a useful tool for volcano monitoring, in complement 446
to other geochemical and geophysical parameters. While passive dosimetry appears of interest as an 447
easy-to-deploy and cheap technology to characterize the baseline of in-air radon activities, efficient 448
volcanic monitoring will require more sophisticated technologies with near-real time response (e.g., 449
Terray et al., 2020). In particular, it will be of the utmost importance to quantify radon fluxes of primary 450
magmatic origin and to understand how they may vary in relation with shallow magma dynamics. 451
[27] Finally, radon activities higher than1 kBq/m3 found at some places of Mt. Etna summit area could
452
cause health concern for regular workers on the volcano. Further studies should be devoted to a 453
detailed radiological study of exposure to radon of volcanic origin in order to propose individual actions 454
leading to a mitigation of potential health effects. 455
456
457
Contributions and Acknowledgments
458
[28] LT, VB and PJG designed the passive dosimetry experiment and set it in the field with the help of
459
OS and others (Clarisse Mallet, LMGE Clermont-Ferrand, Jean-Luc Devidal, LMV Clermont-Ferrand and 460
Romain Lauzeral, McGill University Montréal) who are warmly thanked. F. Muré is acknowledged for 461
24
his technical assistance in the management of FLAME SO2 flux measurement network. All authors
462
contributed to the ideas presented in this paper and to its writing. We thank the Associate Editor and 463
anonymous reviewers for their meaningful suggestions and comments which led to improve the 464
manuscript. 465
[29] The scientific support of INGV - Osservatorio Etneo and the logistical help provided by both Parco
466
dell’Etna, Funivia dell’Etna and Gruppo Guide Alpine Etna Sud & Nord were essential for the success 467
of this study. This research is part of the project RAVE@Etna that has received funding from the 468
European Union’s Horizon 2020 research and innovation program under grant agreement N° 654182. 469
This is Laboratory of Excellence ClerVolc contribution number XXX [NB: ClerVolc number will be 470
communicated once the manuscript is accepted for publication]. 471
[30] In order to comply with FAIR standards, the two datasets presented in the manuscript (radon
472
measurements presented in Table 1 and daily SO2 flux data provided in Figure 6) are archived in zenodo
473
general repository (https://zenodo.org/) with the DOI 10.5281/zenodo.3560896. These datasets can 474 be found at https://zenodo.org/record/3560896. 475 476 References 477
Aiuppa, A., Giudice, G., Gurrieri, S., Liuzzo, M., Burton, M., Caltabiano, T., McGonigle,
478
A.J.S., Salerno, G., Shinohara, H., Valenza, M., 2008. Total volatile flux from Mount
479
Etna. Geophysical Research Letters 35. https://doi.org/10.1029/2008GL035871
480
Allard, P., Aiuppa, A., Bani, P., Métrich, N., Bertagnini, A., Gauthier, P.-J., Shinohara, H.,
481
Sawyer, G., Parello, F., Bagnato, E., Pelletier, B., Garaebiti, E., 2016. Prodigious
482
emission rates and magma degassing budget of major, trace and radioactive volatile
483
species from Ambrym basaltic volcano, Vanuatu island Arc. Journal of Volcanology
25
and Geothermal Research, Understanding volcanoes in the Vanuatu arc 322, 119–143.
485
https://doi.org/10.1016/j.jvolgeores.2015.10.004
486
Andres, R., Rose, W., Stoiber, R., Williams, S., Matías, O., Morales, R., 1993. A summary of
487
sulfur dioxide emission rate measuremnts from Guatemalan volcanoes. Bull Volcanol
488
55, 379–388. https://doi.org/10.1007/BF00301150
489
Berlo, K., Turner, S., Blundy, J., Black, S., Hawkesworth, C., 2006. Tracing pre-eruptive
490
magma degassing using (210Pb/226Ra) disequilibria in the volcanic deposits of the
491
1980–1986 eruption of Mount St. Helens. Earth and Planetary Science Letters 249,
492
337–349. https://doi.org/10.1016/j.epsl.2006.07.018
493
Bollettino settimanale sul monitoraggio vulcanico, geochimico e sismico del vulcano Etna,
494
20/08/2018 - 26/08/2018, 2018. INGV-OE.
495
Bonaccorso, A., Calvari, S., Coltelli, M., Del Negro, C., Falsaperla, S., 2004. Mt. Etna:
496
Volcano Laboratory. Washington DC American Geophysical Union Geophysical
497
Monograph Series 143. https://doi.org/10.1029/GM143
498
Campion, R., Salerno, G.G., Coheur, P.-F., Hurtmans, D., Clarisse, L., Kazahaya, K., Burton,
499
M., Caltabiano, T., Clerbaux, C., Bernard, A., 2010. Measuring volcanic degassing of
500
SO2 in the lower troposphere with ASTER band ratios. Journal of Volcanology and
501
Geothermal Research 194, 42–54. https://doi.org/10.1016/j.jvolgeores.2010.04.010
502
Chirkov, A.M., 1975. Radon as a possible criterion for predicting eruptions as observed at
503
Karymsky volcano. Bull Volcanol 39, 126–131. https://doi.org/10.1007/BF02596952
504
Cigolini, C., Laiolo, M., Coppola, D., Trovato, C., Borgogno, G., 2016. Radon surveys and
505
monitoring at active volcanoes: learning from Vesuvius, Stromboli, La Soufrière and
506
Villarrica. Geological Society, London, Special Publications 451, 183–208.
507
https://doi.org/10.1144/SP451.1
508
Condomines, M., Sigmarsson, O., Gauthier, P.J., 2010. A simple model of 222Rn
509
accumulation leading to 210Pb excesses in volcanic rocks. Earth and Planetary
510
Science Letters 293, 331–338. https://doi.org/10.1016/j.epsl.2010.02.048
511
Corsaro, R.A., Andronico, D., Behncke, B., Branca, S., Caltabiano, T., Ciancitto, F., Cristaldi,
512
A., De Beni, E., La Spina, A., Lodato, L., Miraglia, L., Neri, M., Salerno, G., Scollo,
513
S., Spata, G., 2017. Monitoring the December 2015 summit eruptions of Mt. Etna
514
(Italy): Implications on eruptive dynamics. Journal of Volcanology and Geothermal
515
Research 341, 53–69. https://doi.org/10.1016/j.jvolgeores.2017.04.018
516
De Beni, E., Cantarero, M., Messina, A., 2019. UAVs for volcano monitoring: A new
517
approach applied on an active lava flow on Mt. Etna (Italy), during the 27 February–
518
02 March 2017 eruption. Journal of Volcanology and Geothermal Research 369, 250–
519
262. https://doi.org/10.1016/j.jvolgeores.2018.12.001
520
De Novellis, V., Atzori, S., Luca, C.D., Manzo, M., Valerio, E., Bonano, M., Cardaci, C.,
521
Castaldo, R., Bucci, D.D., Manunta, M., Onorato, G., Pepe, S., Solaro, G., Tizzani, P.,
522
Zinno, I., Neri, M., Lanari, R., Casu, F., 2019. DInSAR Analysis and Analytical
523
Modeling of Mount Etna Displacements: The December 2018 Volcano-Tectonic
524
Crisis. Geophysical Research Letters 46, 5817–5827.
525
https://doi.org/10.1029/2019GL082467
526
Delmelle, P., Stix, J., Baxter, P., Garcia-Alvarez, J., Barquero, J., 2002. Atmospheric
527
dispersion, environmental effects and potential health hazard associated with the
low-528
altitude gas plume of Masaya volcano, Nicaragua. Bull Volcanol 64, 423–434.
529
https://doi.org/10.1007/s00445-002-0221-6
530
EURATOM, 2013. Directive laying down basic safety standards for protection against the
531
dangers arising from exposure to ionising radiation [WWW Document]. URL
532
https://eur-lex.europa.eu/eli/dir/2013/59/oj (accessed 10.9.19).
26
Gauthier, P.-J., Condomines, M., 1999. 210Pb–226Ra radioactive disequilibria in recent lavas
534
and radon degassing: inferences on the magma chamber dynamics at Stromboli and
535
Merapi volcanoes. Earth and Planetary Science Letters 172, 111–126.
536
https://doi.org/10.1016/S0012-821X(99)00195-8
537
Gauthier, P.-J., Condomines, M., Hammouda, T., 1999. An experimental investigation of
538
radon diffusion in an anhydrous andesitic melt at atmospheric pressure: implications
539
for radon degassing from erupting magmas. Geochimica et Cosmochimica Acta 63,
540
645–656. https://doi.org/10.1016/S0016-7037(98)00305-6
541
Gauthier, P.-J., Le Cloarec, M.-F., Condomines, M., 2000. Degassing processes at Stromboli
542
volcano inferred from short-lived disequilibria (210Pb–210Bi–210Po) in volcanic
543
gases. Journal of Volcanology and Geothermal Research 102, 1–19.
544
https://doi.org/10.1016/S0377-0273(00)00179-7
545
Gauthier, P.-J., Sigmarsson, O., Gouhier, M., Haddadi, B., Moune, S., 2016. Elevated gas flux
546
and trace metal degassing from the 2014–2015 fissure eruption at the Bárðarbunga
547
volcanic system, Iceland. Journal of Geophysical Research: Solid Earth 121, 1610–
548
1630. https://doi.org/10.1002/2015JB012111
549
Giammanco, S., Melián, G., Neri, M., Hernández, P.A., Sortino, F., Barrancos, J., López, M.,
550
Pecoraino, G., Perez, N.M., 2016. Active tectonic features and structural dynamics of
551
the summit area of Mt. Etna (Italy) revealed by soil CO2 and soil temperature
552
surveying. Journal of Volcanology and Geothermal Research 311, 79–98.
553
https://doi.org/10.1016/j.jvolgeores.2016.01.004
554
Giammanco, S., Sims, K.W.W., Neri, M., 2007. Measurements of 220Rn and 222Rn and CO2
555
emissions in soil and fumarole gases on Mt. Etna volcano (Italy): Implications for gas
556
transport and shallow ground fracture. Geochemistry, Geophysics, Geosystems 8.
557
https://doi.org/10.1029/2007GC001644
558
Gill, J., Williams, R., Bruland, K., 1985. Eruption of basalt and andesite lava degasses 222Rn
559
and 210Po. Geophysical Research Letters 12, 17–20.
560
https://doi.org/10.1029/GL012i001p00017
561
Hansell, A., Oppenheimer, C., 2004. Health Hazards from Volcanic Gases: A Systematic
562
Literature Review. Archives of Environmental Health: An International Journal 59,
563
628–639. https://doi.org/10.1080/00039890409602947
564
Jacobi, W., André, K., 1963. The vertical distribution of radon 222, radon 220 and their decay
565
products in the atmosphere. Journal of Geophysical Research (1896-1977) 3799–3814.
566
https://doi.org/10.1029/JZ068i013p03799@10.1002/(ISSN)2156-2202.TGNARA1
567
Lambert, G., Bristeau, P., Polian, G., 1976. Emission and enrichments of radon daughters
568
from Etna Volcano magma. Geophysical Research Letters 3, 724–726.
569
https://doi.org/10.1029/GL003i012p00724
570
Lambert, G., Le Cloarec, M.F., Ardouin, B., Le Roulley, J.C., 1985. Volcanic emission of
571
radionuclides and magma dynamics. Earth and Planetary Science Letters 76, 185–192.
572
https://doi.org/10.1016/0012-821X(85)90158-X
573
Le Cloarec, M.-F., Gauthier, P.-J., 2003. Merapi Volcano, Central Java, Indonesia: A case
574
study of radionuclide behavior in volcanic gases and its implications for magma
575
dynamics at andesitic volcanoes: RADIONUCLIDE BEHAVIOR IN VOLCANIC
576
GASES. Journal of Geophysical Research: Solid Earth 108.
577
https://doi.org/10.1029/2001JB001709
578
Le Cloarec, M.F., Pennisi, M., 2001. Radionuclides and sulfur content in Mount Etna plume
579
in 1983–1995: new constraints on the magma feeding system. Journal of Volcanology
580
and Geothermal Research 108, 141–155.
https://doi.org/10.1016/S0377-581
0273(00)00282-1
27
Liotta, M., Paonita, A., Caracausi, A., Martelli, M., Rizzo, A., Favara, R., 2010.
583
Hydrothermal processes governing the geochemistry of the crater fumaroles at Mount
584
Etna volcano (Italy). Chemical Geology 278, 92–104.
585
https://doi.org/10.1016/j.chemgeo.2010.09.004
586
Lubin, J.H., Boice, J.D., Edling, C., Hornung, R.W., Howe, G.R., Kunz, E., Kusiak, R.A.,
587
Morrison, H.I., Radford, E.P., Samet, J.M., Tirmarche, M., Woodward, A., Yao, S.X.,
588
Pierce, D.A., 1995. Lung Cancer in Radon-Exposed Miners and Estimation of Risk
589
From Indoor Exposure. J Natl Cancer Inst 87, 817–827.
590
https://doi.org/10.1093/jnci/87.11.817
591
Marchese, F., Genzano, N., Neri, M., Falconieri, A., Mazzeo, G., Pergola, N., 2019. A
Multi-592
Channel Algorithm for Mapping Volcanic Thermal Anomalies by Means of Sentinel-2
593
MSI and Landsat-8 OLI Data. Remote Sensing 11, 2876.
594
https://doi.org/10.3390/rs11232876
595
Marchese, F., Neri, M., Falconieri, A., Lacava, T., Mazzeo, G., Pergola, N., Tramutoli, V.,
596
2018. The Contribution of Multi-Sensor Infrared Satellite Observations to Monitor Mt.
597
Etna (Italy) Activity during May to August 2016. Remote Sensing 10, 1948.
598
https://doi.org/10.3390/rs10121948
599
Mollo, S., Tuccimei, P., Soligo, M., Galli, G., Scarlato, P., 2018. Chapter 18 - Advancements
600
in Understanding the Radon Signal in Volcanic Areas: A Laboratory Approach Based
601
on Rock Physicochemical Changes, in: Samui, P., Kim, D., Ghosh, C. (Eds.),
602
Integrating Disaster Science and Management. Elsevier, pp. 309–328.
603
https://doi.org/10.1016/B978-0-12-812056-9.00018-X
604
Monnin, M.M., 2001. Radon Over Volcanic and Seismic Areas, in: Frontasyeva, M.V.,
605
Perelygin, V.P., Vater, P. (Eds.), Radionuclides and Heavy Metals in Environment,
606
NATO Science Series. Springer Netherlands, Dordrecht, pp. 319–330.
607
https://doi.org/10.1007/978-94-010-0993-5_44
608
Morales-Simfors, N., Wyss, R.A., Bundschuh, J., 2020. Recent progress in radon-based
609
monitoring as seismic and volcanic precursor: A critical review. Critical Reviews in
610
Environmental Science and Technology 50, 979–1012.
611
https://doi.org/10.1080/10643389.2019.1642833
612
Neri, M., Ferrera, E., Giammanco, S., Currenti, G., Cirrincione, R., Patanè, G., Zanon, V.,
613
2016. Soil radon measurements as a potential tracer of tectonic and volcanic activity.
614
Scientific Reports 6, 24581. https://doi.org/10.1038/srep24581
615
Neri, M., Maio, M.D., Crepaldi, S., Suozzi, E., Lavy, M., Marchionatti, F., Calvari, S.,
616
Buongiorno, M.F., 2017. Topographic Maps of Mount Etna’s Summit Craters,
617
updated to December 2015. Journal of Maps 13, 674–683.
618
https://doi.org/10.1080/17445647.2017.1352041
619
Paquet, F., Bailey, M.R., Leggett, R.W., Lipsztein, J., Marsh, J., Fell, T.P., Smith, T., Nosske,
620
D., Eckerman, K.F., Berkovski, V., 2017. ICRP Publication 137: Occupational Intakes
621
of Radionuclides: Part 3. Annals of the ICRP 46, 1–486.
622
Salerno, G.G., Burton, M., Di Grazia, G., Caltabiano, T., Oppenheimer, C., 2018. Coupling
623
Between Magmatic Degassing and Volcanic Tremor in Basaltic Volcanism. Front.
624
Earth Sci. 6. https://doi.org/10.3389/feart.2018.00157
625
Salerno, G.G., Burton, M.R., Oppenheimer, C., Caltabiano, T., Randazzo, D., Bruno, N.,
626
Longo, V., 2009a. Three-years of SO2 flux measurements of Mt. Etna using an
627
automated UV scanner array: Comparison with conventional traverses and
628
uncertainties in flux retrieval. Journal of Volcanology and Geothermal Research 183,
629
76–83. https://doi.org/10.1016/j.jvolgeores.2009.02.013
630
Salerno, G.G., Burton, M.R., Oppenheimer, C., Caltabiano, T., Tsanev, V.I., Bruno, N.,
631
2009b. Novel retrieval of volcanic SO2 abundance from ultraviolet spectra. Journal of
28
Volcanology and Geothermal Research 181, 141–153.
633
https://doi.org/10.1016/j.jvolgeores.2009.01.009
634
Sato, K., Kaneoka, I., Sato, J., 1980. Rare-gas releasing experiments and Rn degassing from
635
erupting magma. Geochemical Journal 14, 91–94.
636
https://doi.org/10.2343/geochemj.14.91
637
Scollo, S., Prestifilippo, M., Pecora, E., Corradini, S., Merucci, L., Spata, G., Coltelli, M.,
638
2014. Eruption column height estimation of the 2011-2013 Etna lava fountains.
639
Annals of Geophysics 57, 0214. https://doi.org/10.4401/ag-6396
640
Seidel, J.L., Monnin, M., 1984. Mesures de Radon-222 dans le sol de l’Etna (Sicile): 1980–
641
1983. Bull Volcanol 47, 1071–1077. https://doi.org/10.1007/BF01952363
642
Sigmarsson, O., Condomines, M., Gauthier, P.-J., 2015. Excess 210Po in 2010
643
Eyjafjallajökull tephra (Iceland): Evidence for pre-eruptive gas accumulation. Earth
644
and Planetary Science Letters 427, 66–73. https://doi.org/10.1016/j.epsl.2015.06.054
645
Sources and effects of ionizing radiation, UNSCEAR 2008 Report, 2010. . Volume I. Annex
646
A. United Nations, New York.
647
Terray, L., Gauthier, P.-J., Salerno, G., Caltabiano, T., La Spina, A., Sellitto, P., Briole, P.,
648
2018. A New Degassing Model to Infer Magma Dynamics from Radioactive
649
Disequilibria in Volcanic Plumes. Geosciences 8, 27.
650
https://doi.org/10.3390/geosciences8010027
651
Terray, L., Royer, L., Sarramia, D., Achard, C., Bourdeau, E., Chardon, P., Claude, A.,
652
Fuchet, J., Gauthier, P.-J., Grimbichler, D., Mezhoud, J., Ogereau, F., Vandaële, R.,
653
Breton, V., 2020. From Sensor to Cloud: An IoT Network of Radon Outdoor Probes to
654
Monitor Active Volcanoes. Sensors 20, 2755. https://doi.org/10.3390/s20102755
655
Tokonami, S., Iimoto, T., Kurosawa, R., 1996. Continuous measurement of the equilibrium
656
factor F and the unattached fraction fp of radon progeny in the environment.
657
Environment International, The Natural Radiation Environment VI 22, 611–616.
658
https://doi.org/10.1016/S0160-4120(96)00163-8
659
Vaupotič, J., Žvab, P., Giammanco, S., 2010. Radon in outdoor air in the Mt. Etna area, Italy.
660
Nukleonika Vol. 55, No. 4, 573–577.
661
Wu, Z., Huang, N.E., Long, S.R., Peng, C.-K., 2007. On the trend, detrending, and variability
662
of nonlinear and nonstationary time series. Proceedings of the National Academy of
663
Sciences 104, 14889–14894.
664
Zimmer, M., Erzinger, J., 2003. Continuous H2O, CO2, 222Rn and temperature
665
measurements on Merapi Volcano, Indonesia. Journal of Volcanology and Geothermal
666
Research, Understanding volcanoes through multiparameter measurements and their
667
interpretation: In memory of Bruno Martinelli 125, 25–38.
668
https://doi.org/10.1016/S0377-0273(03)00087-8
669 670 671 672 673 67429 675 676 677 678 679 680 681 682
Figures and tables
30 684
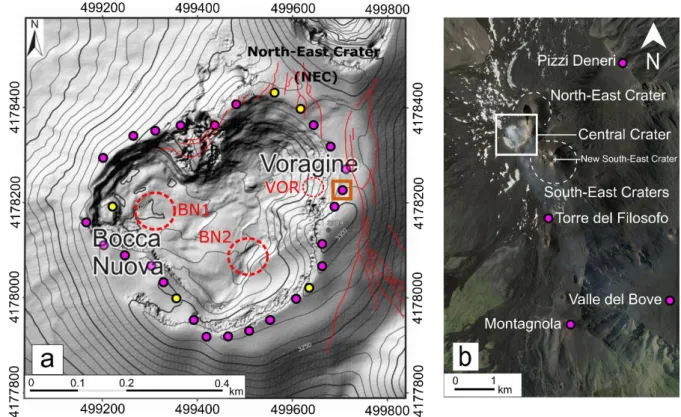
Figure 1: (a) Map of the summit craters of Mt. Etna (modified from Neri et al., 2017) with the location of the radon 685
dosimetry stations (yellow dots represent the stations that were replaced in July and purple dots the other stations). Dotted
686
red circles represent the degassing vents active during the period of exposure of dosimeters. VOR stands for the Voragine
687
vent and BN1-BN2 for the two Bocca Nuova vents. The radon hotspot in front of VOR vent (see text for details) is indicated
688
with an orange frame. Red lines depict the main North-South fractures formed on the rim after the May 2016 eruption
689
(drawn after Marchese et al., 2018) (b) Wider view of Mt. Etna summit area (extracted from Google Earth) with the position
690
of the four remote reference dosimetry stations. The white frame corresponds to the map in (a).
691 692 693 694 695 696 697 698