HAL Id: hal-02743483
https://hal.inrae.fr/hal-02743483
Submitted on 3 Jun 2020
HAL is a multi-disciplinary open access archive for the deposit and dissemination of sci-entific research documents, whether they are pub-lished or not. The documents may come from teaching and research institutions in France or abroad, or from public or private research centers.
L’archive ouverte pluridisciplinaire HAL, est destinée au dépôt et à la diffusion de documents scientifiques de niveau recherche, publiés ou non, émanant des établissements d’enseignement et de recherche français ou étrangers, des laboratoires publics ou privés.
biotic-resource depletion of fisheries
Arnaud Helias, Juliette Langlois, Pierre Fréon
To cite this version:
Arnaud Helias, Juliette Langlois, Pierre Fréon. Improvement of the characterization factor for biotic-resource depletion of fisheries. 9. International Conference on Life Cycle Assessment in the Agri-Food Sector (LCA Food 2014), Oct 2014, San Francisco, United States. pp.1574. �hal-02743483�
Improvement of the characterization factor for biotic-resource
depletion of fisheries
Arnaud Hélias1, 2, 3,*, Juliette Langlois1, 2, 3, Pierre Fréon3, 4
1 Montpellier SupAgro, 2 Place Viala, Montpellier, F-34060, France
2 INRA, UR050, Laboratoire de Biotechnologie de l’Environnement, Avenue des Etangs, Narbonne, F-11100, France
3 ELSA, Research group for environmental life cycle sustainability assessment, 2 place Pierre Viala, Montpellier, F-34060, France 4 IRD EME UMR212, Av. J. Monnet, F-34203, Sète, France
* Corresponding author. E-mail: arnaud.helias@supagro.inra.fr
ABSTRACT
Langlois et al. (2012; 2014a)proposed characterization factors (CF) for fish biotic resource extraction impact assessment at the species level. This paper is an improvement of this approach. In the present work, the CF depends on the Maximum Sustainability Yield (MSY), weighted by the ratio of the current total fishing effort to the fishing effort at the MSY value. Because this ratio often cannot be computed from current databases, it is here obtained from the ratio of total catches to MSY and roots of the parabola linking catches to fishing ef-fort. The new version of the CF is proposed for 125 fish stocks. This work allows assessment of fisheries in the LCA formalism. It con-tributes to a better representation of the depletion of biotic resources.
Keywords: Biotic resource depletion, Fisheries, Maximum sustainable yield, Characterization factor
1. Introduction
Food production is a major sector for environmental burden due to increase of foodstuff demand and food production intensification. The sea is more and more exploited for human food, and environmental assessment approaches have to take into account this use. Seafood products, coming from direct fishery activities or from aquaculture, where a part of the feeding comes from fish catches, induce a large consumption of biotic resources for human activities. An environmental assessment of these systems by Life Cycle Assessment (LCA) cannot be performed without a focus on this impact.
Langlois et al. (2014b) review the use of the sea in LCA and propose related impact pathways dedicated to the biodiversity damage potential, the ecosystem services damage potential, climate change, and the biotic re-source damage potential. Recently, Emanuelsson et al. (2014) proposed new characterization factors (CFs) for fish resource depletion based on the lost potential yield (LPY). The LPY represents the average of lost catches owing to ongoing overfishing and is assessed by simplified biomass projections covering different fishing mor-tality scenarios. This useful approach provides CFs for 31 European fish species, but several parameters are needed: CFs are computed from (1) current biomass and fish mortality, and (2) target biomass and target fish mortality to Maximum Sustainability Yield (MSY).
The biotic resource damage potential is studied in Langlois et al. (2012; 2014a) for fishing activities at both species, for a given stock, and ecosystem levels. Proposed CF values have been used by Avadí et al. (2014). For the species level, CFs are built based on MSY and catches to deal with the biotic resource states. The present work is an improvement of CF determination at the species level.
2. Methods
2.1. Maximum Sustainability Yield.
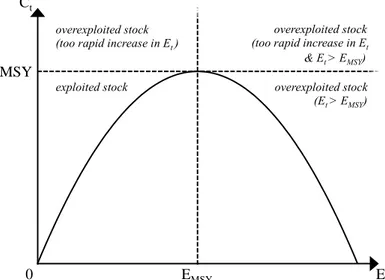
The relation between catches and fishing effort is commonly modelled by a parabola, where the MSY is equal to the catches at the inflexion point (see Figure 1). Fish stocks are classically assessed with MSY: the highest fish catch that can be sustained in the long term (Graham 1935; Schaefer 1991). Fishery exploitation of a given stock at time t (Ct) can be increased up to a maximum level by increasing the fishing effort (Et), because the catches are compensated by an equivalent fish production. Above the MSY and its corresponding EMSY, re-newal of the resource (reproduction and body growth) cannot keep pace with the removal caused by fishing and natural mortality. The MSY can be estimated either with a variety of stock-assessment methods or empirically. The most useful database for this is the RAM Legacy Stock Assessment Database (Ricard et al. 2012).
Figure 1. Fish catch (Ct) as a function of fishing effort (Et) at the steady state
2.2. Characterization factors previously proposed
In Langlois et al. (2012; 2014a), CFs are computed as follows
CF = { 1 MSY if exploited 1 MSY× MSY 𝐶̅𝑡 = 1 𝐶̅𝑡 elseif Eq. 1
where 𝐶̅𝑡 represents mean fish catches over five years prior to impact assessment to approximate the equilibrium value (if average catches are higher than the MSY due to non-equilibrium situation, 𝐶̅𝑡 is set equal to MSY). For an exploited stock, CF allows to place landings in front of renewability of the stock. When the stock is overex-ploited, the ratio of MSY to 𝐶̅𝑡 is added. The ratio varies from 1 to infinity for catch rates ranging from MSY to zero (i.e. when the stock is overexploited close to MSY or when it is severely depleted, respectively). The ratio allows introducing the seriousness of the overexploitation based on catches only, which are common data (unfor-tunately, fishing efforts are often unavailable data). See Langlois et al. (2014a) for the determination of the stock status (i.e. overexploited or not).
2.3. Improvement of the characterization factors
In the present work, to determine the CF, MSY is changed in accordance with the ratio 𝐸𝐸𝑡
MSY, which describes
the extent of exploitation or overexploitation. Let the relation presented in Figure 1 be
𝐶̅𝑡 = −𝑎1𝐸𝑡2+ 𝑎2𝐸𝑡 Eq. 2
The derivative is the following:
𝑑𝐶̅𝑡
𝑑𝐸𝑡= −2𝑎1𝐸𝑡+ 𝑎2 Eq. 3
𝑑𝐶̅𝑡
𝑑𝐸𝑡|𝐸𝑡=𝐸MSY = 0 = −2𝑎1𝐸MSY+ 𝑎2 Eq. 4
With (2) and (4), we have
𝐶̅𝑡 = −𝑎1𝐸𝑡2+ 2𝑎1𝐸MSY𝐸𝑡 Eq. 5 MSY EMSY Ct Et 0 overexploited stock (too rapid increase in Et )
overexploited stock (too rapid increase in Et & Et > EMSY)
overexploited stock (Et > EMSY)
MSY = −𝑎1𝐸MSY2 + 2𝑎
1𝐸MSY𝐸MSY Eq. 6
𝐶̅𝑡 MSY= − ( 𝐸𝑡 𝐸MSY) 2 + 2 𝐸𝑡 𝐸MSY Eq. 7
The polynomial (7) allows finding the ratio of fishing effort to fishing effort for the MSY as a function of the ratio of catches to MSY. The roots are the following:
𝑟1= 1 + √1 −MSY𝐶̅𝑡 , 𝑟2= 1 − √1 −MSY𝐶̅𝑡 Eq. 8
and are used in the CF to weigh MSY
CF = { 1 MSY(1+√1−MSY𝐶̅𝑡) if exploited 1 MSY(1−√1−MSY𝐶̅𝑡) elseif Eq. 9
This weight varies theoretically from 2 (unexploited resource) to 0 (totally depleted resource) and introduces a relative position for the stocks according to the fishing effort only with catches and MSY values.
3. Results
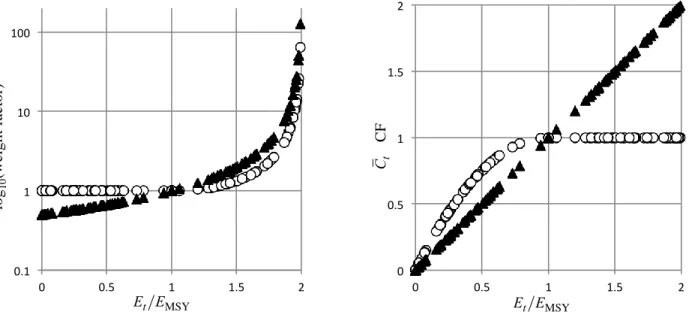
The RAM Legacy database includes biological reference points for over 361 stocks, of which 138 have MSY values and 313 have catches data. The number of stocks with both values is 125. Table 1 gives CF values for overexploited (55) and exploited (70) stocks, where both catches and MSY are available in the RAM legacy da-tabase. Figure 2, left part, shows the CF weight factors according to the relative finishing effort both for previous
(1 for exploited, MSY𝐶̅
𝑡 for overexploited stock) and current CFs (1 ± √1 −
𝐶̅𝑡
MSY). Figure 2, right part, shows the total biotic resource depletion impacts (i.e. 𝐶̅𝑡× MSY) for both previous and current work.
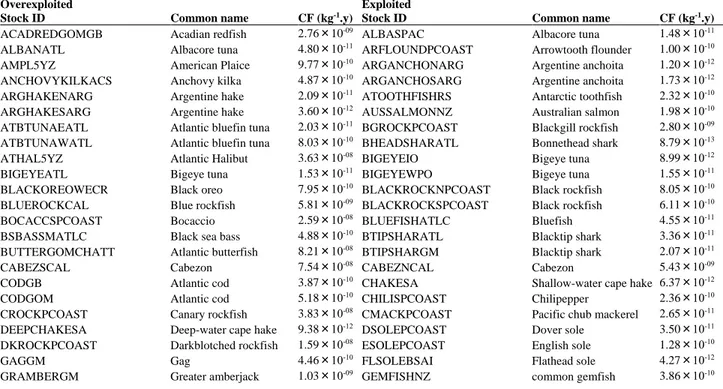
Table 1. Characterization factors (CF) for biotic-resource depletion at the species-stocks level in the RAM Legacy database.
Overexploited Exploited
Stock ID Common name CF (kg-1.y) Stock ID Common name CF (kg-1.y)
ACADREDGOMGB Acadian redfish 2.76×10-09 ALBASPAC Albacore tuna 1.48×10⁻¹¹
ALBANATL Albacore tuna 4.80×10⁻¹¹ ARFLOUNDPCOAST Arrowtooth flounder 1.00×10⁻¹⁰ AMPL5YZ American Plaice 9.77×10⁻¹⁰ ARGANCHONARG Argentine anchoita 1.20×10⁻¹² ANCHOVYKILKACS Anchovy kilka 4.87×10⁻¹⁰ ARGANCHOSARG Argentine anchoita 1.73×10⁻¹² ARGHAKENARG Argentine hake 2.09×10⁻¹¹ ATOOTHFISHRS Antarctic toothfish 2.32×10⁻¹⁰ ARGHAKESARG Argentine hake 3.60×10⁻¹² AUSSALMONNZ Australian salmon 1.98×10⁻¹⁰ ATBTUNAEATL Atlantic bluefin tuna 2.03×10⁻¹¹ BGROCKPCOAST Blackgill rockfish 2.80×10-09 ATBTUNAWATL Atlantic bluefin tuna 8.03×10⁻¹⁰ BHEADSHARATL Bonnethead shark 8.79×10⁻¹³
ATHAL5YZ Atlantic Halibut 3.63×10-08 BIGEYEIO Bigeye tuna 8.99×10⁻¹²
BIGEYEATL Bigeye tuna 1.53×10⁻¹¹ BIGEYEWPO Bigeye tuna 1.55×10⁻¹¹
BLACKOREOWECR Black oreo 7.95×10⁻¹⁰ BLACKROCKNPCOAST Black rockfish 8.05×10⁻¹⁰ BLUEROCKCAL Blue rockfish 5.81×10-09 BLACKROCKSPCOAST Black rockfish 6.11×10⁻¹⁰
BOCACCSPCOAST Bocaccio 2.59×10-08 BLUEFISHATLC Bluefish 4.55×10⁻¹¹
BSBASSMATLC Black sea bass 4.88×10⁻¹⁰ BTIPSHARATL Blacktip shark 3.36×10⁻¹¹ BUTTERGOMCHATT Atlantic butterfish 8.21×10-08 BTIPSHARGM Blacktip shark 2.07×10⁻¹¹
CABEZSCAL Cabezon 7.54×10-08 CABEZNCAL Cabezon 5.43×10-09
CODGB Atlantic cod 3.87×10⁻¹⁰ CHAKESA Shallow-water cape hake 6.37×10⁻¹²
CODGOM Atlantic cod 5.18×10⁻¹⁰ CHILISPCOAST Chilipepper 2.36×10⁻¹⁰
CROCKPCOAST Canary rockfish 3.83×10-08 CMACKPCOAST Pacific chub mackerel 2.65×10⁻¹¹ DEEPCHAKESA Deep-water cape hake 9.38×10⁻¹² DSOLEPCOAST Dover sole 3.50×10⁻¹¹ DKROCKPCOAST Darkblotched rockfish 1.59×10-08 ESOLEPCOAST English sole 1.28×10⁻¹⁰
GAGGM Gag 4.46×10⁻¹⁰ FLSOLEBSAI Flathead sole 4.27×10⁻¹²
Overexploited Exploited
Stock ID Common name CF (kg-1.y) Stock ID Common name CF (kg-1.y)
HAD5Y Haddock 7.35×10⁻¹⁰ GOPHERSPCOAST Gopher rockfish 9.90×10-09
KMACKGM King Mackerel 3.91×10⁻¹⁰ HADGB Haddock 1.69×10⁻¹¹
NZSNAPNZ8 New Zealand snapper 6.48×10⁻¹⁰ HERRNWATLC Herring 3.14×10⁻¹²
POLL5YZ Pollock 1.94×10⁻¹⁰ KELPGREENLINGORECOAST Kelp greenling 7.98×10-09 POPERCHPCOAST Pacific ocean perch 1.54×10-08 KINGKLIPSA Kingklip 7.57×10⁻¹² PTOOTHFISHMI Patagonian toothfish 5.42×10-09 KMACKSATLC King Mackerel 3.88×10⁻¹⁰
RGROUPGM Red grouper 2.86×10⁻¹⁰ LNOSESKAPCOAST Longnose skate 5.35×10⁻¹⁰
RPORGYSATLC Red porgy 3.20×10-08 LSTHORNHPCOAST Longspine thornyhead 1.56×10⁻¹⁰
RSNAPEGM Red snapper 1.08×10-09 MACKGOMCHATT Mackerel 7.85×10⁻¹²
RSNAPWGM Red snapper 8.77×10⁻¹⁰ MONKGOMNGB Monkfish 2.86×10⁻¹⁰
SBARSHARATL Sandbar shark 2.91×10-08 NRSOLEEBSAI Northern rock sole 1.72×10⁻¹²
SNOWGROUPSATLC Snowy grouper 7.04×10-09 NZLINGLIN3-4 Ling 5.89×10⁻¹¹
SPANMACKSATLC Spanish mackerel 7.27×10⁻¹⁰ NZLINGLIN5-6 Ling 2.75×10⁻¹¹
STMARLINSWPO Striped marlin 6.56×10⁻¹⁰ NZLINGLIN6b Ling 7.00×10⁻¹⁰
STRIPEDBASSGOMCHATT Striped bass 9.89×10⁻¹¹ NZLINGLIN72 Ling 1.41×10-09
SWORDMED Swordfish 8.24×10⁻¹¹ NZLINGLIN7WC Ling 9.32×10⁻¹¹
SWORDNATL Swordfish 1.16×10⁻¹⁰ OROUGHYNZMEC Orange roughy 2.37×10⁻¹⁰
TAUTOGRI Tautog 7.44×10-09 PATGRENADIERSARG Patagonian grenadier 7.57×10⁻¹²
TILESATLC Tilefish 6.55×10-09 PHAKEPCOAST Pacific hake 1.32×10⁻¹²
VSNAPSATLC Vermilion snapper 3.83×10-09 POPERCHGA Pacific ocean perch 3.11×10⁻¹¹
WHAKEGBGOM White hake 4.87×10⁻¹⁰ PSOLENPCOAST Petrale sole 3.90×10⁻¹⁰
Windowpane 1.79×10-09 PSOLESPCOAST Petrale sole 4.06×10⁻¹⁰
WINDOWSNEMATL Windowpane 3.63×10-09 PTOOTHFISHPEI Patagonian toothfish 2.43×10⁻¹⁰ WINFLOUN5Z Winter Flounder 8.03×10⁻¹⁰ REDFISHSPP3LN Redfish species 2.07×10⁻¹¹ WINFLOUNSNEMATL Winter Flounder 9.25×10⁻¹⁰ SABLEFEBSAIGA Sablefish 3.73×10⁻¹¹
WITFLOUN5Y Witch Flounder 4.25×10⁻¹⁰ SABLEFPCOAST Sablefish 1.16×10⁻¹⁰
WPOLLEBS Walleye pollock 1.02×10⁻¹² SBWHITACIR Southern blue whiting 5.19×10⁻¹¹
WPOLLGA Walleye pollock 2.80×10⁻¹¹ SKJCWPAC Skipjack tuna 6.43×10⁻¹³
YELLCCODGOM Yellowtail flounder 1.49×10-09 SKJEATL Skipjack tuna 2.63×10⁻¹²
YELLGB Yellowtail flounder 4.11×10⁻¹⁰ SKJWATL Skipjack tuna 9.91×10⁻¹²
YELLSNEMATL Yellowtail Flounder 4.17×10-09 SMOOTHOREOCR Smooth oreo 1.95×10⁻¹⁰ YEYEROCKPCOAST Yelloweye rockfish 1.48×10-07 SMOOTHOREOWECR Smooth oreo 2.93×10⁻¹⁰ SNOSESHARATL Atlantic sharpnose shark 3.94×10⁻¹³
SOUTHHAKECR Southern hake 2.07×10⁻¹⁰
SOUTHHAKESA Southern hake 9.87×10⁻¹¹
SSTHORNHPCOAST Shortspine thornyhead 3.32×10⁻¹⁰ STFLOUNNPCOAST Starry flounder 6.20×10⁻¹⁰ STFLOUNSPCOAST Starry flounder 1.31×10-09
SWORDSATL Swordfish 4.18×10⁻¹¹
TREVALLYTRE7 Trevally 4.61×10⁻¹⁰
VSNAPGM Vermilion snapper 1.63×10⁻¹⁰
WPOLLNSO Walleye pollock 3.29×10⁻¹³
YELL3LNO Yellowtail Flounder 3.11×10⁻¹¹
YFINATL Yellowfin tuna 6.07×10⁻¹²
YFINCWPAC Yellowfin tuna 2.50×10⁻¹²
YTROCKNPCOAST Yellowtail rockfish 1.22×10⁻¹⁰ YTSNAPSATLC Yellowtail snapper 4.35×10⁻¹⁰
Figure 2. Weight factors (left part) and total impact (right part) according to relative fishing effort. White cir-cle: approach proposed in Langlois et al. (2014a); black triangle: this study.
4. Discussion
This work is an improvement of the previous CF calculations in two respects:
The CF value increases now continuously according to the total fishing effort for exploited species. The CF for a species where the current total catches is close to the MSY (i.e. close to overexploitation) is now higher than the CF for a species where catches are low, as it is shown in Figure 2, left part, when the relative fishing effort is lower than 1.
The total impact (total catches by CF) increases continuously from low exploited species to depleted re-sources, whereas in the previous equations, the total impact was identical for all overexploited species (Figure 2, right part, when the relative fishing effort exceeds 1).
As already expressed in Langlois et al. (2014a), the use of MSY and steady state assumption present some limitations. The transition periods for a given stock are not properly taken into account, being it the result of a drastic increase in effort leading to overexploitation, or to a fast decrease in effort, resulting from the implemen-tation of a low quota aimed at the rapid restoration of the stock biomass. In order to limit this inconvenient and to approximate the equilibrium state, a five-year catches average has been used.
5. Conclusion
While many impacts are now consensual in LCA and standard frameworks are starting to be available (JRC-EIS 2011), no guidelines exist for biotic impact assessment (Emanuelsson et al. 2014). This work proposes CFs at midpoint level for fishing activities, where the use of the biotic resource is taken into account in front of the resource recovery capacity (expressed by the MSY). This work allows assessment of fisheries in the LCA for-malism. It contributes to a better representation of the depletion of biotic resources.
6. Acknowledgments
This work benefited from the support of the French National Research Agency (WinSeaFuel ANR-09-BIOE-05). J. Langlois, P. Fréon and A. Hélias are members of the ELSA research group (Environmental Life Cycle and Sustainability Assessment, http:// www.elsa-lca.org); they thank all the members of ELSA for their precious advice. Ct ´ C F Et EMSY Et EMSY 0.1 1 10 100 0 0.5 1 1.5 2 0 0.5 1 1.5 2 0 0.5 1 1.5 2 lo g10 (w e ig h t fa ct o r)
7. References
Avadí A, Fréon P, Quispe I (2014) Environmental assessment of Peruvian anchoveta food products: is less refined better? Int J Life Cycle Assess. doi: 10.1007/s11367-014-0737-y
Emanuelsson A, Ziegler F, Pihl L, et al. (2014) Accounting for overfishing in life cycle assessment: new impact categories for biotic resource use. Int J Life Cycle Assess. doi: 10.1007/s11367-013-0684-z
Graham M (1935) Modern Theory of Exploiting a Fishery, and Application to North Sea Trawling. ICES J Mar Sci 10:264–274. doi: 10.1093/icesjms/10.3.264
JRC-EIS (2011) International Reference Life Cycle Data System (ILCD) Handbook: Recommendations for Life Cycle Impact Assessment in the European context EUR 24571 EN - 2011, First Edit. Eur Comm 159. doi: 10.278/33030
Langlois J, Fréon P, Delgenès J, et al. (2012) Biotic resources extraction impact assessment in LCA of fisheries. 8th Int. Conf. Life Cycle Assess. Agri-Food Sect. (LCA Food 2012),. INRA, Rennes, France, Saint Malo, France, pp 517–522
Langlois J, Fréon P, Delgenes J-P, et al. (2014a) New methods for impact assessment of biotic-resource depletion in LCA of fisheries: theory and application. J Clean Prod. doi: 10.1016/j.jclepro.2014.01.087 Langlois J, Fréon P, Steyer J-P, et al. (2014b) Sea-use impact category in life cycle assessment: state of the art
and perspectives. Int J Life Cycle Assess. doi: 10.1007/s11367-014-0700-y
Ricard D, Minto C, Jensen OP, Baum JK (2012) Examining the knowledge base and status of commercially exploited marine species with the RAM Legacy Stock Assessment Database. Fish Fish 13:380–398. doi: 10.1111/j.1467-2979.2011.00435.x
Schaefer M (1991) Some aspects of the dynamics of populations important to the management of the commercial marine fisheries. Bull Math Biol 53:253–279. doi: 10.1016/S0092-8240(05)80049-7