HAL Id: halshs-00703466
https://halshs.archives-ouvertes.fr/halshs-00703466
Submitted on 1 Jun 2012
HAL is a multi-disciplinary open access archive for the deposit and dissemination of sci-entific research documents, whether they are pub-lished or not. The documents may come from teaching and research institutions in France or abroad, or from public or private research centers.
L’archive ouverte pluridisciplinaire HAL, est destinée au dépôt et à la diffusion de documents scientifiques de niveau recherche, publiés ou non, émanant des établissements d’enseignement et de recherche français ou étrangers, des laboratoires publics ou privés.
The winner’s curse: why is the cost of sports
mega-events so often underestimated?
Wladimir Andreff
To cite this version:
Wladimir Andreff. The winner’s curse: why is the cost of sports mega-events so often underestimated?. Wolfgang Maennig et Andrew Zimbalist. International Handbook on the Economics of Mega Sporting Events, Edward Elgar, pp.37-69, 2012. �halshs-00703466�
In Wolfgang Maennig and Andrew Zimbalist, eds., Handbook on the Economics of Mega-Sporting Events, Edward Elgar (March 2012).
Chapter 4
THE WINNER’S CURSE:
Why is the cost of sports mega-events so often underestimated?
Wladimir Andreff 1
Grenoble taxpayers were not very happy to pay local taxes up to 1992 for covering the financial deficit from the 1968 Winter Games! The 1976 Summer Olympics in Montreal outperformed Grenoble Winter Olympics in terms of deficit: the latter was so deep that Montreal taxpayers had been repaying the debt until 2006, for thirty years. After Montreal's financial mess, the number of candidate cities wishing to host such sports mega-events dropped, and since the 1984 Games in Los Angeles the watchword of local Olympics organizing committees (LOOC) and the IOC became “the Games will pay for the Games”. Such watchword was incentive enough to trigger a new increase in the number of candidates to host the Olympics but not enough to cure the financial mess disease. After having claimed for seven years that the Games will pay for the Games, the 1992 Winter Olympics in Albertville resulted in a $ 60 million deficit2. Were those three exceptions proving the rule that sport mega-events usually are organised at a reasonable and correctly anticipated cost? Unfortunately it is not so.
In the same vein, when the 2012 Summer Games had been allocated to London in July 2005, the expected and advertised cost was in the range of £ 2.4 billion. By the end of 2008, the cost estimates ranged from £ 9.4 billion to £12 billion. Some press articles have suggested that the promoters of London candidature had deliberately underestimated the Olympics bill in
1 Professor Emeritus at the University of Paris 1 Panthéon Sorbonne, Honorary President of the International
Association of Sport Economists, Honorary President of the European Sports Economics Association, Honorary Member of the European Association for Comparative Economic Studies, former President of the French Economic Association.
2
To the best of our knowledge, Albertville Games were the only circumstance in which ex ante economic impact study had dared to predict that they will end up in the red (Andreff, 1991). Such ex ante warning is rather seldom in the literature. Let us imagine what might have happened to a consultant who would have delivered to the mayor of London a pre-2005 study concluding with “give up your candidature to the 2012 Games, it is too much expensive”!
order to get the Games. In particular, the London candidature file had intentionally underestimated the overall cost in neglecting to account for the VAT, the Paralympics budget and a part of security expenditures. London 2012 promoters of course were neither talking about nor expecting the further creation of a new fund in 2008 to cover the rising cost of the Games. There is an impression that having won a harsh struggle in bidding primarily over Paris 2012, London, its authorities, inhabitants and taxpayers are now cursed despite a nice study based on a contingent valuation method which found a positive willingness to pay for hosting the Olympics of non London residents – located in the Bath region (Walton et al., 2008). As to the 2014 Sochi Winter Olympics, the city was awarded the Games in June 2007, exhibiting a $ 8.5 billion budget. Since then the budget has skyrocketed. In August 2010, it had already reached $ 33 billion – a more than three fold increase within three years, with an amount that is bigger than the reported cumulative cost of Winter Olympics in Nagano 1998, Salt Lake City 2002 and Turin 2006 taken together.
The aforementioned facts raise three long lasting questions to those cities (countries) which apply to host sports mega-events. Why the actual ex post costs of hosting an event are predictably much larger than the ex ante estimated and expected costs? Consequently, why do the promising prospects exhibited in an economic impact study or a cost-benefit analysis during the candidature usually vanish before the opening ceremony? And thus, why the initial euphoria of an Olympics (or other sports mega-event) bid is followed up with a post-bid curse, post-Olympics disillusion and a substantial bill for the taxpayers of the host city? Politicians – city mayors, sports ministers, presidents of the Republic, etc. – do respond to these questions with making tabula rasa of the past: previous sports mega-events may have shown unexpected extra-costs but our candidature is based on a sound economic evaluation and will not be disappointing in any respect. The success story is to come. Most economists are much more sceptical and criticize analytical flaws and methodological tricks that are usually found in economic impact studies and cost-benefit analyses of sporting events. But no one asks why such tricks and flaws are repeatedly reproduced after so many years of academic criticisms published about them. Our contention is that ex ante benefit overestimation and more basically cost underestimation are deeply rooted in auctioning the allocation of sports mega-events which so often evolves into a so-called winner‟s curse - or the misfortune of winning a bidding war. The focus here is on the Summer and Winter Olympics, but the background idea is that the same analysis must be relevant for many sports mega-events which are allocated through an auction as soon as the number of bidders is
bigger than one, such as FIFA's soccer World Cup3, the Rugby World Cup or UEFA's soccer Euro. The hypothesis of a winner‟s curse has not yet been examined in such a context though it is sometimes referred to (Leeds and von Allmen, 2002) or further analyzed (Swindell and Rosentraub, 2002) with regards to cities bidding to host professional team franchises in North American team sports leagues.
In view of validating the winner‟s curse assumption, the chapter starts with a brief overview of the candidature puzzle (Section 1). Then three analytical variants of the winner‟s curse are presented (Section 2) in order to adopt the one which best fits with the Olympics centralized monopolist allocation process based on auctioning in a context of asymmetrical information (Section 3). From this pioneering analysis are derived a few indicators that can detect a winner‟s curse dwelling upon its major expected outcomes (Section 4). Finally, a preliminary attempt to verify the winner‟s curse hypothesis with such indices is undertaken for the Summer Olympics from 1972 to 2012 and Winter Olympics from 1980 to 2014 (Section 5). The conclusion recommends a halt in bidding for the Games, an alternative being to fix an Olympics site once and for all.
1. Bidding for sports mega-events: the candidature jigsaw puzzle
The cradle of the winner‟s curse, if any, lies in bidding to obtain the Olympics, which means that the roots of the curse emerge during a precise span of time. First, it must be identified. Let us define the overall sequencing of an Olympiad as follows. In t-3, a city considers the opportunity to participate into bidding for the next Olympics. In t-2, it starts preparing and promoting its candidature in order to have its application ready in due time for the bid (the IOC votes). In t-1, the IOC votes determine the winner which will host the Games. Let us date t the day of the Olympics opening ceremony and t+1 the day of the closing ceremony. Further, assume a post-Olympics economic recession, following growth between t-1 and t+1, occurs up to a date t+2. Let us fix t+3 as the date when all economic and social effects of the Games end up – taxpayers have finished to repay the debt if any, residents have benefited from sporting and non sporting infrastructures built up for the Games as well as from positive intangible effects such as feel good, image and reputation satisfactions. Therefore: t-3 to t-2 is a preparation stage to a city's candidature; a simplifying assumption is
3 Allmers and Maennig (2009) have already shown that significant net economic benefits cannot be identified for
FIFA World Cups in France 1998 and Germany 2006. More in tune with the winner‟s curse hypothesis, total investment of $1.35 billion in stadiums for the World Cup 2010 in South Africa was much higher than the $105 million initially budgeted at the time of the tournament bid in 2004 (du Plessis and Maennig, 2009).
adopted, i.e. this stage does not involve any cost even though some preliminary study may be achieved.
t-2 to t-1 is a candidature stage; ex ante potential or expected costs are assessed and eventually described in the city application file submitted to the country's OC (Olympic Committee) and, then, the IOC in t-1. This stage is usually six to seven years. It is the stage during which the winner‟s curse emerges, if any, in the form of an ex ante underestimated potential cost ct-1. A bidding city usually commands and finances at least one ex ante study
regarding the economic impact of hosting the Olympics. Since the cost of such a study is diminutive4 compared to the expected overall cost of organisation, sporting and non- sporting infrastructural investments contained in ct-1, it is neglected in the analysis below.
t-1 to t is an investment stage both in organisation and (sporting and non-sporting) construction. During this stage the real cost of hosting the Games materialises into an ex post actual cost in t that is Ct which may or may not differ, from ct-1. Both ex ante expected and ex
post actual costs are to be taken into account when it comes to identify a possible winner‟s curse.
t to t+1 is a Games unfolding stage which reaches a peak in direct tangible revenues accruing to the LOOC and also a peak of the Olympics economic boom, including sometimes some unexpected extra costs at the very last minute.
t+1 to t+2 is the span of time of post-Olympics recession when local economic activity is slowing down for some months up to one year or so, despite the possibility of modest post-Olympics revenues and intangible social costs and benefits.
t+2 to t+3 is a longer period of time along which all medium and long-term tangible (paying the debt, using and maintaining sporting and non-sporting facilities) and intangible (local population satisfaction, improved image of the host city, better social cohesion, various social costs and benefits) effects come to an end5.
If some supplementary information happens to be published about ex post costs after t, it must be picked up for the assessment of a possible winner‟s curse.
Nearly all bidding cities hire a consulting company or research centre to carry out an ex ante economic impact study or an ex ante cost-benefit analysis, usually a contingent valuation at this stage. The projected costs and revenues from the Games are a requisite part of the application file remitted to the IOC. A glance at the existing literature demonstrates that ex
4 Around $1 million, but the overall cost of the bid can reach up to $100 million, not to speak of under the table
expenses, also neglected here.
5
Except t to t+1 which lasts two weeks, and t+1 to t+2 sequence which is rarely longer than one full year, all other sequences occurs over several years.
post economic impact and cost-benefit analyses are substantially fewer than ex ante studies. Host cities generally do not commission an ex post evaluation of the actual costs, revenues and benefits that could reveal too many differences between initial costs-benefits and the ex post reality. Thus, the few existing ex post studies are mainly due to academic research. There is a good reason for that. When, for the same sport mega-event, there are both ex ante and ex post studies, the latter exhibits a disappointing economic outcome. One of the rare events for which one can compare ex ante economic impact study commissioned by the organisation committee (ESSEC, 2007) to ex post economic impact study and cost-benefit analysis with a rigorous methodology (Barget and Gouguet, 2010) is the 2007 Rugby World Cup in France. The results are:
Ex ante economic impact: € 8 billion. Ex post economic impact: € 539 million.
Ex post net social benefit (social benefits minus social costs): € 113 million.
The aim here is not to discuss the analytical flaws and methodological tricks of economic impact studies and cost-benefit analyses. Most economists do not trust the former and prefer the latter though with some reservations (Baade and Matheson, 2001; Barget and Gouguet, 2010; Crompton, 1995; Johnson et al., 2001; Hudson, 2001; Késenne, 2005; Matheson, 2009; Porter, 1999; Walker and Mondello, 2007). They raise serious doubts about the excessively optimistic estimates of the ex ante studies. Scepticism is widespread among academic economists who are used to cut down with more rigorous methods the anticipated net benefits exhibited in studies doomed to be utilised by bidding cities for the purpose of announcement and promotion of their candidature. However, no one economist has analysed so far why such overestimation of positive sports mega-events economic impact, including their ex ante cost underestimation, is so systematically reproduced from one bidding city to the other, and from one Olympiad to the next one. This is due to a missing relationship that economists have not yet established between economic impact studies underestimating the costs and overestimating the benefits, on the one hand, and the need for a city to outbid other bidding cities, on the other hand,, i.e. to ex ante exhibit the biggest expected economic impact or net social benefit, and afterwards to be plagued with a winner‟s curse.
Moreover, the sceptical assessments of professional economists remain unheeded, or even unheard, by decision makers and city authorities who repeatedly commission ex ante economic impact studies, in particular between t-2 and t-1. All city mayors and candidature promoters of bidding cities are very much eager to obtain a study exhibiting a positive economic impact derived from hosting the targeted sports events, and are ready to pay a
significant amount of money (to a prestigious consultant) for getting such conclusion. Cognizant of this purpose, consulting companies obligingly deliver impact studies which exaggerate positive economic spillover since providing a conclusion that predicts fantastic economic impact is a precondition to be selected in the future as a consultant by other cities or countries applying as potential hosts for some sports event.
Thus, when focusing on methodological weaknesses of economic impact studies, most economists touch a really sensitive issue. However, they do not perceive that methodological shortcomings are there on purpose, to support and embellish the application file of a bidding city. Cost underestimation and benefit overestimation are embedded in the process of bidding for the Olympics, and this guarantees that ex ante expected costs will be higher than ex post actual costs (and anticipated benefits higher than the real ones). In some sense, wrong (i.e. overestimating) economic impact studies are a launching pad for the winner‟s curse. This is the reason why comparing costs publicised during or at the end of the candidature stage with actual organisation and investment costs at the end of the investment stage or later, is crucial to check the very existence of a winner‟s curse and, by the same token, the fallacy of nearly all ex ante economic impact studies delivered to cities bidding for a sports event.
Are ex ante impact studies and cost-benefit analyses really needed or useful, a relevant question correctly raised by Baade, Késenne, Matheson and others? One may have some doubts since the result is known in advance: an underestimated initial cost of hosting the sports event and, consequently, a cost overrun ending with an extra cost to be paid by taxpayers whatever their willingness to pay which has been expressed ex ante. Our point here is not to assess the accuracy of ex ante studies. Nevertheless, should they have sometimes forecast ex ante negative or nil economic impact then we would not have suspected them to be so much involved in the generation of a winner‟s curse.
Three last dimensions of the candidature puzzle must be mentioned. First, there is difficulty in explaining with standard econometric models which are the determinants of bidding success for Olympic Games. Feddersen et al. (2008)6 have attempted to do so for Summer Games between 1992 and 2012 with a model comprising seventeen variables that should likely be considered before the IOC votes -- the distance of sporting venues from the Olympic village, local weather and unemployment being the most significant variables. The outcome is interesting and, at first sight, surprising. The model correctly predicts the IOC decision for 100% of failed bids. In contrast, it correctly explains only 50% of successful bids. Feddersen
et al. include no variable that represents the cost of the Games as publicised by bidding cities. Excluding cost from the model is probably a good econometric choice since cost must not be a priority variable in IOC votes. However, if cost is unheeded as a IOC decision criterion, the probability that a successful bidder will be cursed and pay the price for that during the investment stage of the Olympiad is extremely high.
Second, it is not always the least expensive Olympics project which is voted for by IOC members. For instance, Chappelet and Kübler-Mabbott (2008) carefully checked that IOC votes had been several times an entire surprise since it was not the best quality candidature file that had been selected; they openly mention the 1996 and 2012 Summer Olympics and the 1998, 2006 and 2014 Winter Olympics7. Does this mean that IOC voters do not care about the cost of the Games while bidding cities are very much concerned about it? If so, a winner‟s curse may be rooted in such an attitude asymmetry.
A third dimension of the candidature puzzle goes in line with the previous argument. It is very often the bidding city with the highest organisation and/or investment cost that is eventually successful. Table 1 reinforces such assumption with the 2012 and 2016 Summer Olympics. Both London and Rio de Janeiro had exhibited the highest investment and overall cost in their bids.
Table 1: Ex ante cost: comparison between cities bidding for the Olympics
2012 Summer Olympics: announced costs
New York London Madrid Paris
Overall: 10,68M$ Overall: 18,25M$ Overall: 3,64M$ Overall: 8,87M$ Investment:7,59M$ Investment.:15,79M$ Investment:1,64M$ Investment:6,21M$ Operation: 3,09M$ Operation: 2,46M$ Operation: 2M$ Operation: 2,66M$ Moscow
Overall: 11,86M$ Investment:10,07M$ Operation: 1,79M$
2016 Summer Olympics: announced costs
Chicago Tokyo Madrid Rio de Janeiro
Overall: 3,3M$ Overall: 4,07M$ Overall: 4,18M$ Overall: 9,53M$
Investment: 2,6M$ Investment:2,11M$ Investment: 2,35M$ Investment.:7,6M$ Operation: 0,7M$ Operation: 1,96M$ Operation: 1,83M$ Operation: 1,93M$ Sources: bidding committees.
7 In fact, Chappelet and Kübler-Mabbott rely on this empirical evidence for introducing an analysis of lobbying,
influenced votes, and corruption in the process of allocating the Games. Such misdoings are connected with the winner‟s curse issue even though they are not the most significant proof of it.
2. Three variants of the winner’s curse
According to those sports economists who explicitly refer to the winner‟s curse, the latter is defined as “the tendency of a winning bid to be in excess of the real value of the asset sold in the auction” (Sandy et al., 2004, p. 309) or, phrased differently, “since the most optimistic among the potential bidders makes the winning bid, there is a good chance that the actual revenues (…) will be less than that bidder anticipated” (Ibid., p. 131). Note that here the winner‟s curse is merely understood as the result of bidders' behavior, it is comprehended only as a demand side triggered mechanism. No specific mention is made of the supply side except saying that it is a monopoly, like the IOC or FIFA for instance. Leeds and von Allmen (2002, p. 160) add: “Economists call this paradox – in which the „winning‟ city is actually worse off than it would have been had it lost the bid – the winner‟s curse.” One implication from these definitions is that, on the demand side for an auctioned asset, there must be more than one bidder for the winner‟s curse to emerge.
Sports economists have less emphasized the supply side aspect: is there any specific strategy and, derived from it, issues of monopolist organisations such as the IOC, FIFA, UEFA, etc., that could influence the auction in such a way as to come out with a winner‟s curse? One objective of this chapter is to respond this question as well. Joining the demand side and supply side dimensions, one reaches analytical problems like bilateral monopoly8 or moral hazard and adverse selection issues in a relationship between one monopoly and several bidders; such issues are related to information asymmetry in principal-agent theory. Since usually more than one city is bidding for the next Olympics, the latter framework is the relevant one all the more that the IOC is, to some extent, a centralised and private bureaucracy at a global level. Although there are strong rivalries across its members (decision makers, voters), this organisation is not operating, properly speaking, on a competitive supply side market for the Olympics. The IOC does not sell its exclusive sports event in a genuine market where a fully-fledged market mechanism determines an equilibrium price.
From the very beginning, the winner‟s curse had been imported into sports economics from the auction theory where it was born in 1971 in Western economics literature. In fact, the winner‟s curse was well known even earlier in centrally planned economies (CPEs) because it was the everyday life of centralised allocation of inputs and state finance.
8 If there were just one single bidding city for each Olympics, the situation would be one of a bilateral monopoly.
Economic theory has demonstrated since the Edgeworth diagram that, in this case, the outcome of negotiations and the precise terms of the transaction will depend on the respective bargaining power (or simply the naked power) of the two bilateral monopolists (the IOC and the single bidding city).
2.1. The winner‟s curse: “you have won the bid and will lose money”
The winner‟s curse hypothesis was first advanced by Capen et al. (1971) to explain the low returns on investments to companies engaged in competitive bidding for oil and gas leases. The impression was that winning bidders had paid a too high price for oil and gas leases (Gilley et al., 1986); they had been cursed. In other words, they had paid an auction price higher than any likely market price and had undertaken too high a cost to be recouped by the revenues of their investment in oil and gas exploitation. Similarly, Gilberto and Varaiya (1989) have provided evidence of a winner‟s curse to explain large takeover premiums in auctions for failed banks, in sharp contrast to the orthodox view endorsed by the mainstream finance literature.
In all such circumstances, it was noted that in any auction-type setting, where the value of the auctioned object is uncertain but will turn out to be the same for all bidders, the party that overestimates the value of the object is likely to outbid its competitors and win the contest. The items won, however, are more often than not those whose value has been overestimated. Auction winners who fail to recognize this possibility are likely to be cursed by having paid more for an item than its true value. Thus, there is adverse selection in this outcome. The bidding process results in winning bids that produce below normal or even negative returns contrary to all that is learned from the theory of rational investment decision. Thaler (1994) stresses the asymmetric information across bidders, which leads to an extreme form of the winner‟s curse in which any positive bid yields an expected financial loss to the bidder. An increase in the number of other bidders implies that to win the auction you must bid more aggressively. Yet the presence of more bidders also increases the chance that if you win, you will have overestimated the value of the object for sale – suggesting that you should bid less aggressively.
A parallel can be drawn here with allocation of the Olympics through an auction bid. The IOC, when calling cities to bid and fixing a deadline for the submission of candidature files, is in a situation that compares with a state or a region calling companies to bid for oil and gas leases. No one a priori knows the real market value of being selected as the next Olympics host city, not even the IOC. What the IOC looks for is to find a city eager to host the Games and organise them in the best way (i.e., the ex ante supposedly best project). Thus, the IOC is interested in eliciting aggressive bidding to get the "best" project because it will benefit from the resulting winner‟s curse. Bidding cities are exactly in the conditions that Thaler points at:
if they want to have a chance to get the Games, they definitely must overbid other bidders until the date9 of allocation (IOC members‟ vote). Assuming that the IOC is used to choose the best project from an economic point of view10, the winning city is absolutely cursed since it has promised to invest and pay too much to get the Olympics, while the IOC is going to obtain a grandiose project for which it will not pay the full price. It appears here, first, that the supply side also matters in the analysis of the winner‟s curse and, second, that adverse selection is likely to allocate the Games to the city applying with the most expensive project. The more a bidding city has underestimated the announced costs for hosting the Olympics, the more the winner‟s curse will materialise in ex post extra costs, and a possible financial deficit, and the more the IOC will have got a magnificent project without paying its full cost.
2.2. Being cursed on financial and second hand markets
Forty years after the article by Capen et al., the literature about the winner‟s curse has grown for a very simple reason: the concept has found many applications in financial markets which now comprise the great bulk of the winner‟s curse literature (Kagel and Levin, 2002). In particular, it is utilised to explain the share value underestimation in initial public offerings and the positive initial returns earned by investors on new issued equities (Rock, 1986; Levis, 1990). Though it is a widespread phenomenon, it has been under the spotlights during IPO‟s privatisation on new tiny stock exchanges in post-communist transition economies (Andreff, 2000 & 2003). Overbidding is also present in different auction mechanisms such as sealed-bid auctions, English auctions, first-price auctions with insider information, blind-bid auctions, and bilateral bargaining games (the latter would apply to Olympics bids only if there is one single candidature). In the background, one finds sophisticated models and a lot of technicalities that would not be easy to transfer to analysing city bids for hosting the Olympics.
The winner‟s curse issue has also been found in second hand markets, primarily on the market for „lemons‟ where the true value of the second hand car is uncertain and unknown to the purchasers (bidders) while hidden by the seller. Akerlof (1970) has demonstrated that with such information asymmetry the market will lead to adverse selection and the winning purchaser will be cursed. There is even an application of the winner‟s curse concept in sports
9 The selection process of the host city has evolved in two steps, first across potential bidders of a same country,
and then across “qualified” bidding cities of different countries. This does not change the likelihood of the winner‟s curse to emerge and probably increases the pressure on cities to bid even more aggressively.
labor markets wherein a veteran sells his services on the talent market. Cassing and Douglas (1980) have argued that with free agency teams will tend to acquire a biased set of players, those for whom the bidder has overpaid. Because of information asymmetries and uncertainty, bids by potential team owners will not always mirror the true worth of a player, but the team that values correctly has a poor chance of signing a player compared to a team that overestimates the player‟s value. The latter is cursed.
Since the previous examples are not that close to an auction bid for hosting a sports mega-event, the rest of the chapter does not follow this path.
2.3. The winner‟s curse in a context of centralised allocation of investment funds
In central planning (CPE), every year investment funds were allocated across state-owned enterprises through an auction opened by the central state administration (central planning agency or industrial ministries). It was obviously not a market allocation but a call sent to enterprises to submit investment projects, the central authorities being supposed to finance the best projects. In Yugoslavia until 1956, the Federal Institute for Planning was auctioning investment funds every year, was collecting projects submitted by "self-managed" enterprises and eventually was supporting those investment projects which were deemed to be the most efficient and closest to central plan objectives (Neuberger, 1956). The national investment fund was allocated across those enterprises having provided the best projects. In the USSR, a national investment fund was distributed by Gosplan across industrial ministries whose job was to allocate their industry investment fund among the enterprises under their tutelage, according to some centralised "efficiency" criteria (Dyker, 1983). Those efficiency criteria used in the Soviet Union until the 1960s were absolutely debatable with regards to their economic rationale (Andreff, 1993). However, after economic reforms, the criteria for investment decision making came closer to those applied in public enterprises in market economies. In the latter, for each investment project k was calculated its discounted net benefit (its social profitability), that is:
N 0 t t kt kt k a 1 C R Bwhere Rkt stands for all revenues derived from the investment over its life‟s length (from t = 0
to N), Ckt stands for all investment costs (Ckt = C0 + Ct + Cft with C0 the initial investment
cost, Ct the cost of all further annual investment „slices‟ in case of a pluri-annual investment,
discount rate fixed by a central planner11. In the face of rival projects submitted by enterprises, industrial ministries normally should have stuck to two selection rules:
1/ choose an investment project if, and only if Bk > 0, for any k;
2/ choose investment project 1, then project 2, then project 3, etc., until the finance of the industry investment fund is exhausted if B1 > B2 > B3 > … > Bn. If the ministry investment
fund could only afford to finance the first three projects, it would have allocated all its investment fund to the most socially profitable projects. Each enterprise, once obtained its own investment fund, was committed to include the selected investment project (including its costs and revenues) in its own annual plan and to compulsorily fulfil it.
However, in practice, investment fund allocation did not proceed exactly in such smooth and theoretical way due to a context of information asymmetry. Each enterprise director had a good knowledge about his/her enterprise's existing equipment, technology, production capacity, real costs, the skills and productivity of manpower and, therefore, the time required to achieve the new investment project with the allocated investment fund. In contrast, the industrial ministry (and of course the central planning agency) had only a blurred idea, or no idea at all, about the magnitude of enterprise inside managerial variables. In such context, in order to augment its chance to get some investment fund, each enterprise was very much eager not to reveal the true value of its inside managerial variables – information non transparency creating a moral hazard situation – and incited to “cheat”12 with regards to the reality of its investment costs and revenues, and the required completion duration of the investment project. It has been demonstrated that cheating on investment projects was rather the rule than exception in CPEs (Kornaï, 1980; Dyker, 1983; Andreff, 1993) in the form of:
Any enterprise was announcing an investment and operation cost ck for the project k
sent to the ministry and not the actual cost Ck, with obviously ck < Ck, in order to
augment its chance to get investment funds from the ministry.
Any enterprise was announcing a very optimistic – often absolutely unrealistic – completion duration for the project k; Soviet economies have remained forever famous due to their unfinished investment building sites resulting from unattainable completion durations.
11 If Rkt were to include social indirect and non pecuniary benefits while Ckt were to include social indirect and
non pecuniary costs, the investment choice would have relied on standard cost-benefit analysis. Soviet enterprises and planners did not mind such indirect and non pecuniary effects.
12 The verb “to cheat” is used to mean what is pointed at, in academic terms, as information bias, distorted
information and/or information manipulation in the communication between enterprises and their tutelage authorities (industrial ministries).
Any enterprise was anticipating overestimated revenue from the investment: rk > Rk,
with rk the ex ante announced revenues and Rk the actually expected revenues.
An obvious consequence of investment cost underestimation and investment revenue overestimation is that the social profitability of an investment project k sent by an enterprise to the ministry was quite higher than its real social profitability: bk > Bk.
Since all enterprises had adopted such a strategic behaviour, central authorities and ministries were absolutely confused, when not entirely incapable to rationally make a decision about how and to whom to allocate the national investment fund. Facing a myriad of fabulous investment projects, ministries had a tendency to inflate the number of financed projects in the first year of five-year plan – overinvestment - which was generating a typical investment cycle in CPEs (Bauer, 1978) with quite fewer investment projects financed by the end of five-year plan. Indeed, all the projects submitted to a ministry were unrealistic, exhibiting an extraordinary social profitability, unbelievably low costs and a very short span of time to be completed. Thus, the aforementioned decision rule 1 was eliminating not even one project. The rule 2 was eliminating projects that seemingly were the most extraordinary. In such a confused situation, adverse selection was the most common outcome and inefficient or low-efficiency investment projects were financed, including after some bargaining, lobbying and bribery of the ministry‟s civil servants in charge of investment funds by enterprises.
Enterprises ordinarily were more often cheating by underestimating costs and completion durations than overestimating investment revenues. Thus, basically consider only the costs to simplify the issue. Let us assume that during the auction, a ministry was receiving investment projects such as:
c1 < c2 < c3 < … < ck < …< cn
If it were choosing the first three, it might well have selected the least efficient or, at least it was not sure to have kept the three most efficient ones. If in reality all projects had exactly a same actual cost C*, it would have meant that c1 = C1 – C* was the investment project for
which the ex ante cost announced by an enterprise was the most underestimated compared with its actual cost. It follows that c2 = C2 – C* was the second most underestimated project in
terms of cost, and cn = Cn – C* was the project with the least underestimated cost. The latter
was nevertheless the one which had no chance to be funded while the first projects 1, 2, and 3 were the most likely to be financed by the ministry although being the most underestimated, i.e. the least feasible in terms of cost and completion duration. Adverse selection is obvious. Now, let us relax the assumption that all projects had a same actual cost C* but, instead, they had different costs. Then all ministry decision making would depend on the relationship
between actual costs and the announced costs c1 < c2 < c3 < … < ck < …< cn, that is, on the
degree of cost underestimation specific to each investment project. Let us imagine that actual costs indeed were such as C1 < C2 < C3 < … < Ck < … < Cn. Then the risk of adverse
selection is difficult to exactly assess but it is minimal. On the other hand, the risk of selecting inefficient investment projects was quite high if the actual costs C1, C2 and C3 were such that
the real social net benefits were B1, B2 and B3 < 0, despite ex ante announced social benefits
b1, b2 and b3 > 0 declared by enterprises during the auction. Now, if actual costs were such as
Cn < … < Ck > … < C3 < C2 < C1, then adverse selection reached its maximum. The latter
hypothesis corresponds to a reality where the less actually efficient is an investment project, the more the enterprise underestimates (hides or cheats about its own inefficiency) its actual costs. Such hypothesis was more than realistic in Soviet economies because those enterprises submitting the lowest quality investment projects were more eager to cheat (underestimate costs) than rival enterprises.
The conclusion is that when a centralised organisation in a monopoly situation utilises an auction to proceed with funds allocation to bidding enterprises, adverse selection is extremely likely to appear. And the winner‟s curse is there in. The ministry is cursed in so far as it has allocated investment funds to less efficient projects and it will become aware of it when enterprises which have benefited from the funds allocation will be unable to complete their investment projects at the announced cost within the announced deadline. The state-owned enterprise, in some way, is cursed as well: through cheating, it has submitted an infeasible investment project and, in practice, it will not be able to complete it within the deadline at ex ante announced cost. In the Soviet system, an enterprise which was not correctly fulfilling its plan was normally sanctioned (lower bonuses, fewer honorific rewards, dismissal or even worse under Stalin). In an attempt to avoid sanctions, enterprises were adding to informational cheating some bad management practices (Andreff, 1993) coined as „strategic behaviour‟ in standard economic theory13.
When lagging behind its annual investment plan time schedule, an enterprise was attempting to bargain an extension of its initial investment fund, allocated at the beginning of the year, but which had revealed to be too short due to cost and completion duration underestimation. First, it was a bargaining with centralised authorities (ministries) to obtain a facilitating revision of its planned objectives: allocation of extra investment fund, extra inputs or
13 This third variant of the winner‟s curse fits with a public choice approach since the winner is cursed after on
purpose underestimating/overestimating public investment decisions while in the first one the winner is cursed simply due to his/her wrong estimation of the magnitude of oil and gas leases and the interest of exploiting them. There is no public choice and no one cursed on purpose in the latter case.
manpower, downward revision of plan targets including that the investment project initially submitted will not be completed in due time and so on. Big Soviet enterprises had elaborated a specific strategy based on tolkachi. A tolkach was an enterprise employee especially engaged for staying in Moscow and canvassing tutelage ministries with demands for extra investment funds, extra inputs, and downward revision of plan targets. In other words, it was the Soviet variant of lobbying. The tolkach had become a quasi-institution, though informal, of the Soviet economy and, in some sense, he was a derived product from enterprise winner‟s curse. Being cursed by its own cost underestimation strategy, the Soviet enterprise always attempted to get extra means for completing its investment project through some pressures on and drawing the attention of centralised tutelage authorities.
Tolkachi were endowed by their enterprise directors with (illicit) secret funds that enabled them to bribe those ministry bureaucrats who were likely to deliver extra investment funds and extra inputs to the enterprise, to treat enterprise‟s demands as well as those emanating from rival enterprises (also cursed during the auction) and to push the enterprise demand files up to decision makers in the Kafka-like universe of a Soviet ministry. It was common practice that Soviet enterprises were corrupting bureaucrats in charge of allocating investment funds and other material means. In a nutshell, in view of avoiding the worst consequence of the winner‟s curse consisting in sanctions for plan non-fulfilment, a Soviet enterprise was usually resorting to bargaining, lobbying and bribery, the three recipes of a „successful‟ enterprise management in a centralised economy with information asymmetry.
3. The Olympics centralised allocation process with asymmetric information
There is a similarity between the centralized auction for allocating investment funds in a CPE and how the auction functions through which the Olympics are allocated to a bidding city. However, similar is not identical even though the selection mechanism of a host city proceeds, in absence of a genuine market for the Games, with an auction by a (global) centralised authority or organisation, i.e. the IOC. From the starting point of the comparison, a difference must be underlined. In a CPE, a centralised body offers funds to achieve an investment, then opens an auction for investment projects, and finally allocates investment funds to various enterprises for projects to be achieved within an annual deadline. With the Olympics, the IOC publicises the task of hosting and organising the next Games within a precise deadline, then it calls for projects. These projects are not applying for IOC funding; rather, they are candidates to raise funds from different sources in order to cover the cost of
those investments required to host the Games. At the end of an auction which usually takes several years, the IOC allocates the right to host the Olympics to the most interesting city project. However, the fact that the object of such auction is not merely a finance allocated by the IOC but the status of being the next hosting city of the Olympics does not reduce or eliminate the risk of a winner‟s curse. The risk may be even higher than in a CPE allocation process because the incentive to cheat is much stronger. A city which wants to host the Games commits itself to heavily invest over a six to seven years span of time and then hopes to benefit from the “Olympics host city” label that provides a unique capacity for collecting and mobilising finance. The city financial commitment and concern are in the range of billion dollars to host the Olympics, whereas, in CPEs, enterprise investment was in the range of million roubles, sometimes less.
Now, considered as an auctioneer, does the IOC behave as a central planner or an industrial ministry allocating investment funds when it opens an auction for the next Games? A weak variant of a central planner model is due to Oskar Lange (1937) adapting the Walrasian auctioneer model. The auctioneer announces some price system, enterprises of the planned economy proceed with their economic calculation (profit maximising under a resource constraint) and then send back to the planner-auctioneer those output and input quantities that maximize their profit. If the quantities supplied and demanded by all enterprises do not equalize, the planner revises its price system, then enterprises recalculate their plan projects and send newly calculated quantities to the central planner. This iterative process lasts until supply-demand equality for all products and resources at equilibrium prices14. The auction for the Olympics differs from Lange model because the IOC initially does not announce any price. Moreover, the IOC explicit or implicit objective is not to reach Walrasian equilibrium prices and quantities.
An inverted planning model to Lange‟s has been suggested namely by Malinvaud (1967), Manove (1971) and, for operational planning in Hungary, by Kornaï and Liptak (1965). Here the idea is that the planner announces quantities of output to be produced and inputs to be allocated and enterprises respond, after their own economic calculation, with prices and costs. The iterations go on until they converge toward equilibrium – the saddle point theorem. This process is closer to the IOC auction. The IOC, in some sense, announces quantities to be produced that is a defined assortment of sporting venues and infrastructure that must be completed and operational within the opening ceremony deadline. In addition, each bidding
city adds an optional number of non-sporting infrastructure investments, some IOC required, that may facilitate or embellish hosting the Games: transportation, high tech telecommunications, urban reconstruction, etc. Does the IOC get back prices and costs from bidding cities? No. It receives candidature files including both quantities of sporting venues and non-sporting infrastructural investments, and costs (prices) of all those investments and the LOOC expected organisation costs. To pursue this comparative analysis, objectives of respectively the IOC and bidding cities must now be questioned.
The very existence of the IOC is justified by four responsibilities or objectives, one of which being to elect (choose) every fourth year a host city for the Summer Olympics and Winter Olympics, and then to supervise its LOOC (Chappelet and Kübler-Mabbott, 2008). Is this objective maximized under some constraint as in the auctioneer-planner model? The constraint is that a bidding city must provide all the required facilities and must commit itself to stick to an operational budget, this is a minimal precondition for a city to be selected. Are there other conditions that would maximize the IOC objective function? Another one certainly is the best possible quality of the Games which consists of a guarantee of well-functioning and secure sports contests (quality of sporting equipment, distance between Olympic venues and the Olympic village, etc.), an excellent hosting quality (Olympic village, transportation, hotels), overall security, nice opening and closing ceremonies, the quality of media and telecommunication and, nowadays, an environmental quality, all prerequisites according to the 20 chapters contained in a candidature file. Thus, if the IOC is maximizing something, it is the overall quality of the project which must benefit from worldwide media coverage, leave a grandiose image of each Olympiad, and an unforgettable memory and indelible marks on the host city landscape. In view of obtaining a grandiose project, the IOC interest is to pave the way for or even fuel overbidding across bidding cities. This is what it clearly started to do after the single candidature of Los Angeles for the 1984 Olympics.
I intentionally have not mentioned the cost of the Games as one of the variables included in the IOC objective function with a background idea of cost minimising. First, it is more than likely that the cost of the Olympics is not a decisive criterion in the votes of the 104 IOC members. Besides, the criterion of minimal cost to some extent clashes with maximising the fantastic quality of the Games that is sought. A proof of such contention is that the IOC often selects the most expensive rather than the cheapest project (Table 1), which means both adverse selection in terms of cost, and that the winner‟s curse is at work. Afterwards, cost inflation and cost overruns are basic indices of the winner‟s curse.
The objective function of bidding cities is crystal clear and consists in getting the Games. Therefore, each bidding city must promise fixed quantities of sporting facilities and a variable quantity of non-sporting infrastructure, focusing on their excellent quality since it will be selected or not on these aspects of its candidature. Before Montreal 1976, investment cost and the LOOC operational budget did not matter that much. Since then, and after Los Angeles 1984 demonstrated that the local organizing committee of the Games can end up in the black, the cost dimension of candidatures has become much more significant, though not the major decision criterion. Bidding cities primary interest is to maximize (and focus on) the qualitative components of their candidature, thereby encouraging grandiosity in their project proposal. After 1984, bidding cities started to be interested in exhibiting also reasonable or even low costs in parallel with the supposedly unbelievable quality of their candidature. The only way to reconcile an extravagant project with costs that must not be outrageous is, explicitly or implicitly, to cheat, i.e. to communicate and fill the candidature file on the basis of costs that are underestimated by different means (omitting the VAT, the Paralympics budget, etc.). All in all, it is the bidding cities interest to overbid upward with respect to the quality and downward with respect to the publicised cost of their project. Such strategy compares with the one of rival enterprises struggling for the allocation of investment funds in a CPE except that cities are seeking to get the Games, because it is a precondition for mobilising huge finance necessary for hosting the Olympics. Thus, rival bidding cities are in sync with the principal objective of the IOC, which is to balance outward extravagance with the appearance of reasonable cost.
The parallel with enterprises in CPE cannot exactly be extended to the completion duration of investments since it was absolutely mandatory, but nearly never met, in Soviet-type planning. Yet, the completion duration is mandatory and cannot be circumvented in hosting the Olympics - it is not feasible to start up the Olympics sports contests if the stadium is not entirely achieved – but the IOC recurrent worries about delayed Olympics building sites can be used as a control variable of the winner‟s curse. Building delays usually generate cost overruns when it comes to rushing in order to stick to the deadline. Revising building costs upwards (thus revealing the initial cost underestimation) or even giving up some Olympics building to curb skyrocketing costs are also windfall effects of the winner‟s curse. Another revealing factor is when the LOOC or the host city obtains extra finance or extra public subsidies, for instance, from the government. A financial deficit or an ex post lower financial surplus than expected by the LOOC provides another proof of the winner‟s curse while a sanction of the latter is a bidding city budget deficit which must be covered with a specific
post-Olympics taxation. Given all the financial consequences of hosting the Games, one can understand that bidding cities, just like former Soviet enterprises, do not skimp on the means to get the sports event and do not hesitate to engage in lobbying or, in the worst case, in corrupting some IOC voters, i.e. the most unscrupulous or greedy members of the IOC. A last point is that information asymmetry is crucial in the genesis of the winner‟s curse. A bidding city perfectly knows down to the tiniest detail its candidature project so that it is at ease to communicate in such a way as to bring out specific aspects of the file, in particular its supposedly fabulous quality. In contrast, this in-depth knowledge of the candidature file allows the bidding city promoters to keep in the shadow those less exciting characteristics of the project namely excess costs, harsh security issues, negative externalities and possible crowding out effect. An economic impact study is definitely instrumental to highlight the best features and blur the least performing ones. The IOC is not able to reach a similar knowledge (information) about each bidding city project and cannot control how much accurate or fallacious is the information delivered in the application file, namely about actual costs, externalities, etc. The Olympics site visits by the IOC representatives are not enough to compensate for information asymmetry between bidding city promoters and the IOC voters. It is all the more so that “the IOC members are renowned for not really taking into account the technical recommendations and focus on their political and personal judgment of the candidatures” (Chappelet and Kübler-Mabbott, 2008, p. 87) when they are going to vote.
4. Indicators of the winner’s curse
One can infer from the above analysis some indicators that would enable to spot and check the existence of a winner‟s curse resulting from the auction for allocating sporting mega-events to a host city.
Indicator 1: Unexpectedly higher net social cost or lower net social benefit
The most convincing index of a winner‟s curse obviously is a significant difference between ex ante and ex post net social outcome of a sporting mega-event that can be observed in comparing the results of an ex ante and an ex post cost-benefit analysis of the same event. The winner‟s curse hypothesis would be confirmed if ex post net social cost is significantly higher than ex ante net social cost or if ex post net social benefit is significantly lower than ex ante net social benefit (like with the aforementioned 2007 Rugby World Cup). A significant difficulty with indicator 1 is that an ex post cost-benefit analysis usually is not available or published after each Olympic Games. Therefore, some proxies are required. The three
following indicators are consistent with the winner‟s curse hypothesis although each of them alone is not sufficient to definitely establish a curse. However, if they are recurring from one Olympics to another (like the recurring cost underestimation of Soviet enterprises), one would lean towards the belief that a winner‟s curse is at work in the Olympics allocation to bidding cities.
Indicator 2: Cost overruns
A first proxy is a recurring difference15 between ex ante cost in the candidature file and ex post cost reached on the opening day or after. Let us coin it a cost overrun index such as: ct-1 < Ct (or ct-1 < Ct+3 when data is available for Ct+3).
Given that over a period of six or seven years there is some inflation in any country and that upward cost revisions happen at a more or less clearly defined date and are usually published in current prices, one can accept as a proof consistent with an existing winner‟s curse a difference of at least 30% between ex post actual and ex ante anticipated cost. The data to be found are the initial cost in the candidature file in t-1, the actual cost at the moment of the opening ceremony Ct and, if one can circumvent data paucity about t+3, the actual cost Ct+3.
Any extra cost or upward cost revision would fuel relevant data for the cost overrun indicator. An additional remark is necessary about this first indicator as well as the next indicators. The announced cost ct-1 is an official figure and well publicised by the bidding committee in the
candidature file and by the IOC. Such ex ante cost is not debatable once published. Looking for the actual cost in t or t+3 is obviously less easy and may be cumbersome and boring. Indeed, it is not the interest of a host city to unveil that actual cost of the Olympics has markedly surpassed ex ante cost. Thus the genuine ex post actual cost is not always much publicised in official documents. Then there is sometimes no other way for researchers than relying on data published in the press or in documents published without the IOC or the host city stamp.
Indicator 3: Ex post revisions in the Olympics project
When there is no data about ex post cost, a second proxy can be used when some significant revisions occur in the Olympics project between t-1 and t. For example, the emergence of a new building in the project which was not included in the candidature file is an explicit index of an initial cost underestimation. Similarly, an upward revision of expenditures linked to one
15
Olympics cost overruns may have various – including some exogenous (bad weather, overall skyrocketing inflation in the host country, etc.) – origins, not to speak of a bad local management of the Olympics project. But if cost overruns are so regularly recurring that they appear to be the rule in every Olympics rather than the exception, one can conclude that cost overruns are an embedded outcome of a winner‟s curse (like they were in the process of allocating investment funds in CPEs).
sporting facility or non-sporting infrastructure project between t-1 and t can also reveal the existence of a winner‟s curse. Or, when a building which was forecast in the candidature file happens to be cancelled between t-1 and t, this also reveals an initial cost underestimation: due to the latter the bill skyrocketed after t-1 and the host city has no other way to curb cost overruns than by giving up some edifice described in the candidature file.
Indicator 4: Delayed completion of an Olympics investment
The completion dates of different Olympics facilities which are mentioned in the candidature file simply cannot be missed. Thus, a delayed completion of an Olympics investment only translates into a time lag between expected and actual completion dates, and in a subsequent final rush in the last weeks before the opening ceremony to complete the unfinished building – by the way it is exactly the investment cycle described for the CPEs (Bauer, 1978). A final rush at the very last minute always inflates the actual investment cost.
When no one of the first three proxy indicators can be fuelled with data or if one wishes to further confirm the existence of a winner‟s curse, some other variables can be used as proxies. However, they are less significant than the first three indicators.
Indicator 5: Extra public subsidy or extra public finance
If the cost of hosting the Olympics was initially underestimated, one way out for the LOOC and the host city is to bargain and obtain an additional public finance or an extra subsidy, for instance from the government or some regional authorities between t-1 and t.
Indicator 6: Host city fiscal deficit and debt
When extra cost of the Olympics project comes out with a heavy financial burden for the host city its budget plunges into a fiscal deficit and a public debt that is to be repaid over time. The same index may register the transformation of ex ante LOOC (or overall) surplus into ex post LOOC (or overall) deficit.
Indicator 7: A disappointing number of „foreign‟ visitors
When the number of „foreign‟ (i.e. coming from outside the host city or region) visitors in t is lower than expected in t-1, then revenues will be lower than expected and, possibly, will increase financial losses.
Two more qualitative indicators may confirm an existing winner‟s curse: a) there are clear signs that a bidding city has attempted to influence the IOC voters through lobbying with some IOC members; b) since outcome uncertainty about who will host the Games lasts until the IOC votes, and given that some IOC members are less scrupulous and disinterested than they should be, a bidding city can be led one step forward into bribery and corruption that can be taken as a winner‟s curse confirmation. However, lobbying and corruption per se are not
decisive indicators of a winner‟s curse. Lobbying and corruption are unfortunately common practices in various economic activities attempting to influence different decision makers, including in some rigged relationships between money and sports like fixed matches and on line sport gambling (Hill, 2010). Spotting lobbyists, even when lobbying is very effective as during the London campaign for the 2012 Olympics (de Rendinger, 2006), is not an easy task and does not alone guarantee the existence of a winner‟s curse, except if it is to complement, for instance, a cost overrun or a delayed completion indicator.
5. Preliminary indices verifying the winner’s curse hypothesis
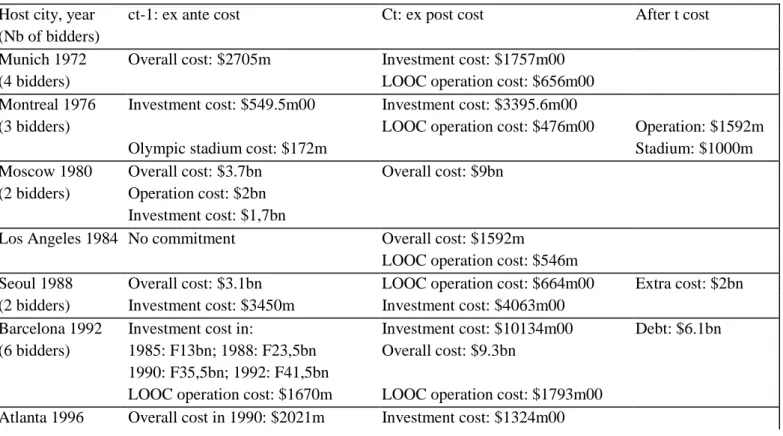
The present essay aims to validate the winner‟s curse hypothesis. Below I sample some readily available data on the costs of hosting the Olympics that are consistent with this hypothesis. The data gathered in these tables must not be taken at their face value since, as mentioned above, some do not bare an official stamp. The only important point here is to check whether Ct > ct-1, ex post is higher than ex ante cost, meaning that a cost overrun had occurred. Data have been collected, when easily available, for Summer Games since 1972 and Winter Games since 1980.
Table 2: Ex ante and ex post cost of Summer Olympics
Host city, year ct-1: ex ante cost Ct: ex post cost After t cost
(Nb of bidders)
Munich 1972 Overall cost: $2705m Investment cost: $1757m00
(4 bidders) LOOC operation cost: $656m00
Montreal 1976 Investment cost: $549.5m00 Investment cost: $3395.6m00
(3 bidders) LOOC operation cost: $476m00 Operation: $1592m
Olympic stadium cost: $172m Stadium: $1000m
Moscow 1980 Overall cost: $3.7bn Overall cost: $9bn
(2 bidders) Operation cost: $2bn Investment cost: $1,7bn
Los Angeles 1984 No commitment Overall cost: $1592m
LOOC operation cost: $546m
Seoul 1988 Overall cost: $3.1bn LOOC operation cost: $664m00 Extra cost: $2bn
(2 bidders) Investment cost: $3450m Investment cost: $4063m00
Barcelona 1992 Investment cost in: Investment cost: $10134m00 Debt: $6.1bn
(6 bidders) 1985: F13bn; 1988: F23,5bn Overall cost: $9.3bn 1990: F35,5bn; 1992: F41,5bn
LOOC operation cost: $1670m LOOC operation cost: $1793m00 Atlanta 1996 Overall cost in 1990: $2021m Investment cost: $1324m00
(6 bidders) LOOC operation cost: $1346m00
Sydney 2000 Overall cost in 1994: $3428m Overall cost: $6.6bn
(5bidders) Investment cost: $2500m Investment cost: $2601m00 LOOC operation cost: $1463m LOOC operation cost: $2434m00 New South Wales Invt: $1220m New South Wales Invt: $1249m Athens 2004 LOOC operation cost: $2162m00 LOOC operation cost: $2404m00
(5 bidders) Overall cost: €4.6bn Overall cost: €6.0bn (June 2004) Overall: €9.6bn Beijing 2008 Investment cost: $1600m00 Investment cost: $2170m00 Invt cost: €13.5bn (5 bidders) Invt cost in 2006: $2800m
LOOC operation cost: $786m00 LOOC operation cost: $1458m00
Infrastructure cost: $35.6bn Infrastr: €29bn Olympic stadium cost: €300m Olympic stadium cost: €380m
Overall cost: €2.2bn ($bn1.9bn) 2004
Overall cost:$43 to 45bn
$2.4bn in 2006
London 2012 Overall cost: £3.4bn in 2005; Overall in 2011: $19bn (£11.6bn) (5 bidders) £3.674bn end 2005; £9.3bn in 2007 £10.0bn in 2009 Investment in 2005: £2.664bn in 2006: €15.0bn LOOC operation 2005: £1010m in 2006: €1900m
m: million; bn: billion; $m00: in 2000 dollars; Australian dollars for Sydney; F: French francs
Sources: Andreff & Nys (2002), Auf der Maur (1976), Barget & Gouguet (2010), Gouguet & Nys (1993), Preuss (2004 & 2006), Zimbalist (2010 & 2011), bidding committees, press articles.
Table 3: Ex ante and expost cost of Winter Olympics
Host city, year ct-1: ex ante cost Ct: ex post cost After t cost
(Nb of bidders)
Lake Placid 1980 Initial operation cost: $47m LOOC operation cost: $96m Op. loss: $8.5m (2 bidders) Investment cost: $129m
Sarajevo 1984 Operation cost: $17.6m Operaton cost: $20.2m
(3 bidders) Investment cost: $15.1m
Calgary 1988 Initial overall cost: can$500m Overall cost: can$1000m
(3 bidders) LOOC operation cost: $636m
Albertville 1992 Initial total cost: F2933m Overall cost: F12bn Op. loss:$60m
(7 bidders) in 1987: F3160m; 1991: F11487m (F285m)
of which operation cost: F3233m; LOOC operation cost: F4200m
sporting equipments: F714m sporting equipments: F5755m Extra sport equipt
infrastructures: F8630m infrastructures: F7800m cost: F286m
Accommodation cost: F289m Accommodation cost: F575m
Lillehammer 1994 Overall cost in 1988: $1511m Overall cost: $1700m Op.loss: $343m (4 bidders)
Nagano 1998 Overall cost in 1992: $450m Overall cost: $875m Debt: $11bn
Salt Lake City Operation cost: $400m in 1989; Operation cost: $1.9bn Op. loss: $168m 2002 (4 bidders) 1996: $1000m; 1998: $1300m
Turin 2006 Investment cost: €3.5bn Investment cost: €13bn Op. loss: $38m
(6 bidders) Operation cost: $660m Operation cost: $1357m
Vancouver 2010 Operation cost: $846m Operation cost: $1269m Op. loss: $37m
(3 bidders) Investment cost: €1.31bn
Sochi 2014 Initial total cost: $8.4bn (3 bidders) 2007: $12bn; 2010: $33bn
m: million; bn: billion; $00: in 2000 dollars; Australian dollars for Sydney; F: French francs; Y: yen Sources: Andreff & Nys (2002), Barget & Gouguet (2010), Burton & O'Reilly (2009), Chappelet (2002), Elberse et a. (2007), Jeanrenaud (1999), Solberg (2008), Tihi (2003), Zimbalist (2010 & 2011), bidding committes, press articles.
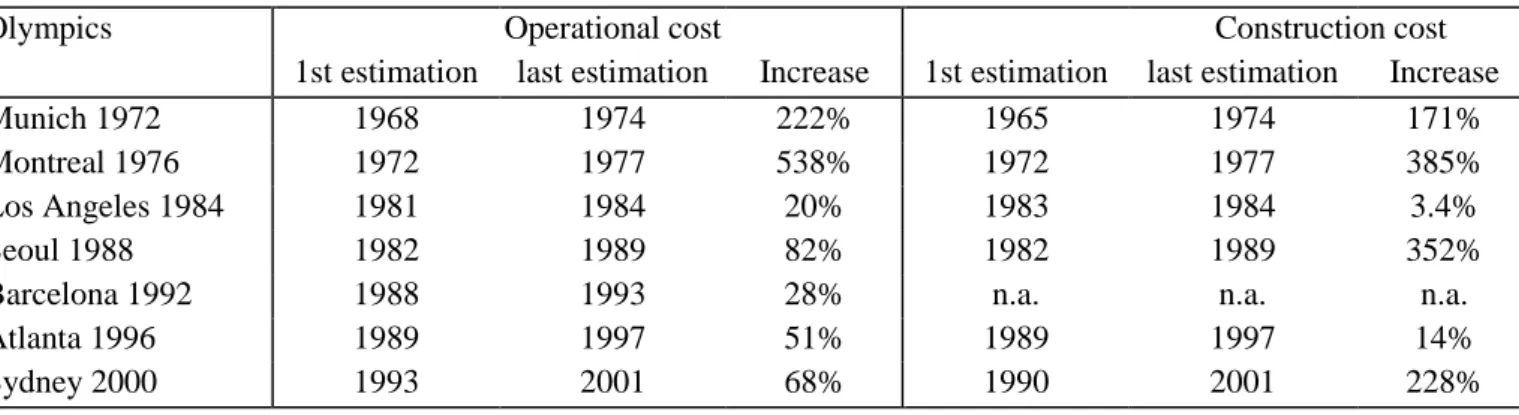
Table 4: Summer Olympics: operational and construction cost inecreases
Olympics Operational cost Construction cost
1st estimation last estimation Increase 1st estimation last estimation Increase
Munich 1972 1968 1974 222% 1965 1974 171%
Montreal 1976 1972 1977 538% 1972 1977 385%
Los Angeles 1984 1981 1984 20% 1983 1984 3.4%
Seoul 1988 1982 1989 82% 1982 1989 352%
Barcelona 1992 1988 1993 28% n.a. n.a. n.a.
Atlanta 1996 1989 1997 51% 1989 1997 14%
Sydney 2000 1993 2001 68% 1990 2001 228%
Source: Solberg and Preuss (2007).
There is practically no sign of a winner‟s curse involved in Los Angeles 1984, which is an expected result since the 1984 Olympics was not auctioned, Los Angeles being the only candidate. Nevertheless, it must be reminded that Los Angeles had very little construction expense and the city had agreed to host the Games only on the condition that it took on no financial obligation (Zimbalist, 2011). In the case of Lake Placid 1980, the second bidding city, Vancouver, withdrew a few days before the IOC votes, which may have alleviated the winner‟s curse. It has been difficult to find enough information comparing ex ante and ex post costs for Munich 1972 so that the conclusion of an existing winner‟s curse still hangs over. On the other hand, data are not absolutely reliable for Moscow 1980 and Sarajevo 1984. Nearly all other Olympiads show recurring cost overruns consistent with the winner‟s curse hypothesis and it is already crystal clear for London 2012 and Sochi 2014 as exhibited in Tables 2 and 3.
With regards to Summer Olympics, without commenting each data per se, Tables 2 and 4 show a strong tendency of Games ending up with higher ex post actual than ex ante expected