HAL Id: hal-03018678
https://hal.archives-ouvertes.fr/hal-03018678
Submitted on 23 Nov 2020
HAL is a multi-disciplinary open access
archive for the deposit and dissemination of
sci-entific research documents, whether they are
pub-lished or not. The documents may come from
teaching and research institutions in France or
abroad, or from public or private research centers.
L’archive ouverte pluridisciplinaire HAL, est
destinée au dépôt et à la diffusion de documents
scientifiques de niveau recherche, publiés ou non,
émanant des établissements d’enseignement et de
recherche français ou étrangers, des laboratoires
publics ou privés.
Deinococcus radiodurans HU unveiled by atomic force
microscopy.
Shu-Wen W. Chen, Anne-Sophie Banneville, Jean-Marie Teulon, Joanna
Timmins, Jean-Luc Pellequer
To cite this version:
Shu-Wen W. Chen, Anne-Sophie Banneville, Jean-Marie Teulon, Joanna Timmins, Jean-Luc
Pelle-quer.
Nanoscale surface structures of DNA bound to Deinococcus radiodurans HU unveiled by
atomic force microscopy.. Nanoscale, Royal Society of Chemistry, 2020, 12 (44), pp.22628-22638.
�10.1039/d0nr05320a�. �hal-03018678�
PAPER
Cite this: Nanoscale, 2020, 12, 22628
Received 16th July 2020, Accepted 28th October 2020 DOI: 10.1039/d0nr05320a rsc.li/nanoscale
Nanoscale surface structures of DNA bound to
Deinococcus radiodurans HU unveiled by atomic
force microscopy
†
Shu-wen W. Chen,*
‡
a,bAnne-Sophie Banneville,
‡
aJean-Marie Teulon,
aJoanna Timmins
*
aand Jean-Luc Pellequer
*
aThe Deinococcus radiodurans protein HU (DrHU) was shown to be critical for nucleoid activities, yet its functional and structural properties remain largely unexplored. We have applied atomic force microscopy (AFM) imaging to study DrHU binding to pUC19-DNA in vitro and analyzed the topographic structures formed at the nanoscale. At the single-molecule level, AFM imaging allows visualization of super-helical turns on naked DNA surfaces and characterization of free DrHU molecules observed as homodimers. When enhancing the molecular surface structures of AFM images by the Laplacian weightfilter, the distri-bution of bound DrHUs was visibly varied as a function of the DrHU/DNA molar ratio. At a low molar ratio, DrHU binding was found to reduce the volume of condensed DNA configuration by about 50%. We also show that DrHU is capable of bridging distinct DNA segments. Moreover, at a low molar ratio, the binding orientation of individual DrHU dimers could be perceived on partially“open” DNA configuration. At a high molar ratio, DrHU stiffened the DNA molecule and enlarged the spread of the open DNA configuration. Furthermore, a lattice-like pattern could be seen on the surface of DrHU–DNA complex, indicating that DrHU multimerization had occurred leading to the formation of a higher order architecture. Together, our results show that the functional plasticity of DrHU in mediating DNA organization is subject to both the conformational dynamics of DNA molecules and protein abundance.
Introduction
A wide range of biophysical approaches can be used to probe the conformation of isolated DNA molecules and DNA–protein assemblies, including single-molecule techniques such as molecular tweezers,1electron microscopy (EM),2 atomic force microscopy (AFM),3and ensemble measurements such as elec-trophoresis4 or Förster resonance energy transfer (FRET) for
example.5
AFM imaging has been widely applied to many DNA-based systems. It has successfully revealed configurations of free DNAs,6,7supercoiled plasmids,8,9and that of DNA–protein and DNA–polymer assemblies.10–14 In particular, AFM has been
successfully used to investigate the interactions of bacterial nucleoid-associated proteins (NAPs), the various roles of which
have been reviewed elsewhere,15with DNA, an essential step for chromosome packaging in bacteria. AFM has supplied a direct visualization of NAPs binding to plasmid16–21and line-arized DNAs,22–25 as well as the formation of higher order structure gradually induced by NAPs from the protein-free state of DNA.26
Among bacterial species, NAPs from E. coli have been most extensively studied. Of the top five abundant nucleoproteins (Fis, HU, H-NS, IHF, and Dps) of E. coli, HU has the highest DNA-binding affinity,27 despite its binding being apparently
nonspecific to DNA sequence. Because of its high abundance and high affinity for DNA, HU was believed to be a major player in nucleoid organization and DNA stabilization.28HU proteins consist of about 90 residues with a high prevalence of basic amino acids.29The first three-dimensional (3D) structure determined for an HU protein is the one from Bacillus stear-othermophilus (HUBst), which exists in dimeric form.30 The
dimeric form is now widely accepted as the biologically active unit for HU.15The common structural features of various HU dimers include twoβ-arms connected via several β-strands to a α-helical body formed of two tightly packed hydrophobic cores. The β-arms are quite flexible; their disorder has been illustrated by NMR-determined structural models.31
†Electronic supplementary information (ESI) available. See DOI: 10.1039/ d0nr05320a
‡Their contributions are equally significant to the work.
aUniv. Grenoble Alpes, CEA, CNRS, Institut de Biologie Structurale (IBS), F-38000
Grenoble, France. E-mail: [email protected], [email protected], [email protected]
bRue Cyprien Jullin, Vinay, 38470, France
Published on 29 October 2020. Downloaded by CNRS - ICSN on 11/20/2020 2:42:24 PM.
View Article Online
E. coli strains lacking HU are more sensitive toγ-irradiation and UV,32,33but broadly speaking, E. coli strains deficient in HU or expressing a mutant of HU exhibit only a subtle vari-ation in cell phenotypes.34,35This suggests that in vivo either the individual contribution of HU is modest or its function can be fulfilled by another nucleoprotein.36 In contrast, the depletion of HU from the radiation-resistant bacterium Deinococcus radiodurans (DrHU) was found to lead to fraction-ation of the nucleoid and the failure to obtain viable bacteria, indicating that D. radiodurans does not have a backup for its HU protein.37These findings demonstrate the essential role of DrHU in the cellular machinery of D. radiodurans.
Regarding HU–DNA binding mechanisms, 3D structures of DNA complexed with HU proteins from Anabaena38 and Staphylococcus aureus39 have revealed that the two β-arms of HU dimers insert into the minor grooves of an aberrant DNA site, where the nucleotide bases are mismatched, to form a specific H-bonding pattern. With a regular base pairing in the binding site of DNA, the crystal structure of Borrelia burgdorferi HU–DNA complex revealed a DNA conformation which was largely bent by almost 180°, leading to a partial opening of the two DNA strands.40 In another X-ray diffraction study, the E. coli HU dimer does not bind DNA in the same mode as described above, but through electrostatic interactions between DNA phosphate moieties and HU peptide amides.41 In this study, theβ-arms of HU were shown to be involved in forming an interaction network in the HU–DNA assembly, which promotes protein multimerization and multiple DNA alignments.
From a structural point of view, very little is known regard-ing the DNA-bindregard-ing properties of DrHU. Compared to E. coli, one major difference is that DrHU possesses a ∼30 amino acid lysine-rich extension appended to its N-terminus.42This long N-terminal tail is a unique feature of HU proteins from Deinococcus bacteria, and has been shown to significantly modulate DNA binding.43 Besides, the primary sequence of DrHU reveals that it possesses a high proportion of Ala resi-dues up to 18%, while lacking aromatic Trp and Tyr amino acids.
In the above crystallographic studies of HU–DNA binding, the DNA molecules used were limited to short DNAs (≤35 base pairs). In order to investigate HU binding effects on DNA mole-cules of longer length (>1000 bps), the use of an imaging strat-egy is a suitable alternative which provides a means to visual-ize a wide scope of DNA–protein assemblies and organizations. EM was used in earlier studies to visualize the configurations adopted by DNAs upon HU binding.44 In one EM study of E. coli HU–DNA binding, a beaded form was observed that was reminiscent of nucleosome-like structures, leading to a corol-lary that DNA coils around HU.44However, the natural super-coiling of naked DNAs has been shown to be able to closely mimic the condensing behavior of DNA complexed with his-tones in vivo.45 Parallel to EM, AFM imaging technique has shown that E. coli HU protein plays a dual architectural role on fragmented DNAs as both a flexible hinge and a stiffener of DNA filaments.46Moreover, AFM also allowed identification of
two fibered forms with diameters of 40 and 80 nm from nucleoid materials extracted from E. coli cells.47
In many studies of ligand–receptor interactions using AFM imaging, a comparative strategy is commonly adopted to verify the presence of bound ligands by an increased height, width or size of the receptor. This analysis approach can be exempli-fied by one study of HU–DNA binding,46in which the thicken-ing of DNA filaments was used as an indicator of HU proteins bound to DNA. In the AFM imaging experiments described below, we have studied the influence of DrHU concentration on the configuration of double-stranded DNA. In addition to classical geometric measures, we have analyzed the topo-graphic structures of free DrHU proteins, naked DNA mole-cules and their complexed forms. We have applied our pre-viously developed processing tool, the Laplacian weight filter, to enhance the surface features of these imaged molecules.48 The enhancement of AFM images has allowed us to observe arrangements of bound DrHUs on the DNA at a molecular level. For the first time, the full-length DrHU protein is imaged at the single-molecule level, different oriented surfaces of free DrHUs can be seen, and variations in distributions of bound DrHUs at different protein concentrations can be detected by visual inspection. The present research provides a structural basis for deciphering the binding effects of DrHU, a long N-terminal tailed HU protein, on the configuration of circular and linear DNA.
Experimental
DrHU productionThe hu (DR_A0065) gene from D. radiodurans was cloned and expressed in BL21 (DE3) cells grown in LB supplemented with 100 µg mL−1 ampicillin. Expression was induced with 1 mM IPTG at 20 °C for 16 hours. Cells were pelleted by centrifu-gation and resuspended in 40 mL lysis buffer [50 mM Tris-HCl, pH 8.0, 500 mM NaCl, 2 mM MgCl2, 1 µg mL−1DNaseI,
1 µg mL−1 lysozyme, and a tablet of complete EDTA-free Protease Inhibitor Cocktail]. Resuspended cells were lysed by sonication on ice for 3 min. The cleared supernatant was loaded on a 5 mL HisTrap FF nickel affinity column (GE Healthcare), pre-equilibrated with buffer A [50 mM Tris-HCl, pH 8.0, 250 mM NaCl]. After the column was thoroughly washed, the recombinant His-DrHU was eluted with a linear gradient of imidazole (75–500 mM) in Buffer A. The purified His-tagged protein eluted at∼250 mM imidazole. The fractions were pooled and diluted with a buffer B [50 mM Tris-HCl, pH 8.0, 50 mM NaCl] to lower the NaCl concentration to 100 mM.
To further purify His-DrHU, the protein was loaded on a 5 mL heparin HiTrap HP column (GE Healthcare), pre-equili-brated with buffer C [50 mM Tris-HCl, pH 8.0, 100 mM NaCl]. After washing with buffer B, the elution was carried out by a gradient from 0.1 to 2 M NaCl in buffer B. The eluate at ∼1 M NaCl was collected. In the absence of aromatic residues, the concentration of His-DrHU was determined by measuring the absorbance at 205 nm and with the help of the online
ithm (http://spin.niddk.nih.gov/clore)49 allowing to compute the sequence-specific molar extinction coefficient at 205 nm. The His-tag was removed by TEV digestion (1 : 20 ratio) at 4 °C overnight; its full removal was assessed by electrophoresis on 15% denaturing polyacrylamide gel. The His-tag itself and traces of uncleaved protein were subsequently removed by Ni-affinity chromatography on a 1 mL Ni-Sepharose 6 FF resin (GE Healthcare) pre-equilibrated in buffer A. The cleaved DrHU was recovered from the flow-through and washes of the Ni-Sepharose column, pooled and concentrated prior to size exclusion chromatography on an ENrich SEC 650 column (Biorad) pre-equilibrated with buffer D [20 mM Tris-HCl, pH 8.0, 100 mM NaCl]. Finally, DrHU was concentrated to a final monomeric concentration of 2.36 mM and stored at−80 °C. Preparation of circular and linearized DNAs
In this study, circular DNA denotes uncleaved natively super-coiled pUC19 plasmid DNA (2686 bp), where “circular” is termed as opposed to“linearized” DNA to be described later. Plasmid pUC19 DNA was amplified in DH5α E. coli cells grown in LB with 100 µg mL−1 ampicillin. The plasmid DNA was extracted from 100 mL overnight cultures using the NucleoBond Xtra Midi kit (Macherey-Nagel) following manu-facturer’s instructions. The final DNA resuspension was per-formed in 50 µL of Milli-Q water, yielding a concentration of 3.5 µg µL−1(equivalent to 2 µM) of pUC19. The stock solution of circular DNA was aliquoted and stored at−20 °C.
Linearized DNA, here, refers to the products obtained after linearization of natively supercoiled plasmid pUC19. For this, E. coli pUC19 was digested with HindIII-HF (New England Biolabs) for 1 hour at 37 °C, and subsequently purified using the Gel and PCR Clean Up kit (Macherey-Nagel) following manufacturer’s instructions. The conformation and purity of the linearized DNA were assessed by electrophoresis on a 1% agarose gel followed by staining with Gel Red (Interchim) and visualization using a ChemiDoc MP imager (BioRad).
AFM protein samples were prepared by diluting the stock solution of DrHU in Milli-Q water to a desired concentration prior to imaging experiments. The molar ratio of a sample solution was represented by the concentration of DrHU monomer relative to that of the DNA. Unless otherwise noted, the final concentration of DNA was set to 0.8 nM and the con-centration of DrHU was consistently adapted to reach the target DrHU/DNA ratio.
AFM instrumental setup
Topographic data were acquired by a multimode 8 microscope equipped with a Nanoscope V controller (Bruker, Santa Barbara, USA). Before use, a freshly cleaved V-1 grade musco-vite mica (Nanoandmore, Wetzlar, Germany) sheet was pre-treated with 10 µL of NiCl2 (2–10 mM) and dried under the
nitrogen gas. A 2 µL aliquot of a sample solution was de-posited on the mica, after which the mica was incubated for 3 min, then dried under a gentle stream of nitrogen gas.
All imaging was conducted with the PeakForce Tapping mode and ScanAsyst mode at a rate of∼1.0 Hz; the resolution
was set to either 512 or 1024 pixels per scan line. The SCANASYST-AIR-HR cantilever was employed with nominal values of k = 0.4 N m−1, Fq= 130 kHz and tip radius = 2 nm
(Bruker probes, Camarillo, CA, USA). Whenever the ScanAsyst mode was applied, a semi-manual control was on during the imaging procedure to manually adjust the set point and gain in order to reduce the tip–sample interactions to the minimum. The ramp size was kept constant at 150 nm. Pre-treatment, post-processing and analysis of topographic data
Pre-treatments of raw AFM images were systematically per-formed using the Gwyddion software.50First, raw AFM images were flattened using a plan fit to the first order. Flattening effect was further enhanced by applying the “line flattening” tool of Gwyddion with a polynomial of order 3, after excluding all the imaged objects whose height value exceeds the given threshold (usually 0.1–0.5 nm). When necessary, stripe noises were reduced using the Destripe program.51 The minimal intensity was set to zero for all AFM images.
In order to better observe imaged molecules, one may magnify the image by either theoretical computations or AFM magnification. AFM magnified image was specified for an image which was acquired by scanning a smaller region of its parent image at the same scan rate. Different from AFM mag-nified image, numerically magmag-nified image is made of intensi-ties calculated with the B-spline interpolation of the Gwyddion software. To enhance AFM molecular topography, the Laplacian weight (L-weight) filter, which was first introduced for revealing detailed surface structures of protein assem-blies,48 was routinely applied. Basically, this filter computes the Laplacian function value as a weighting factor for the intensity values of the pixels in the image. For validation, we compared the size of single DrHU particles in the AFM image with that derived from the 3D structural information; there-fore, it required the construction of an in silico image based on known 3D molecular structures.52 We used the Adepth program to generate molecular surfaces of the 3D structure,53 and then projected the molecular surfaces onto the image plane. The entire protocol of our own-made software is desig-nated as “3D to 2D”. It should be noted that a z-scale color bar, in the unit of nanometer, is shown beside each AFM image with a color gradient to indicate the height distribution of the image. Because the intensity values of processed images using the L-weight filter do not represent height values there is no scale bar present on these filtered images.
In the geometric analysis of image objects, the variables: height, size and volume were estimated using the “grain” option of Gwyddion. First of all, we visually marked the fore-ground pixels (the objects of interest) with an intensity threshold such that the background pixels could be separately treated. The height of a marked pixel was measured as the intensity of the pixel subtracting the average intensity of back-ground pixels. The size of an object (called a grain in Gwyddion) was estimated using the moment fitting function in the“measure individual grain” tool. The fitting result was
represented by (a × b), where“a” and “b” are the lengths of the object corresponding to the doubled size of the major and minor radii determined. The volume of an object is rep-resented by the value of“Laplacian background basis volume”, in which the object base was determined by the intensity values of its neighboring background pixels.
Results
AFM imaging of free DrHU
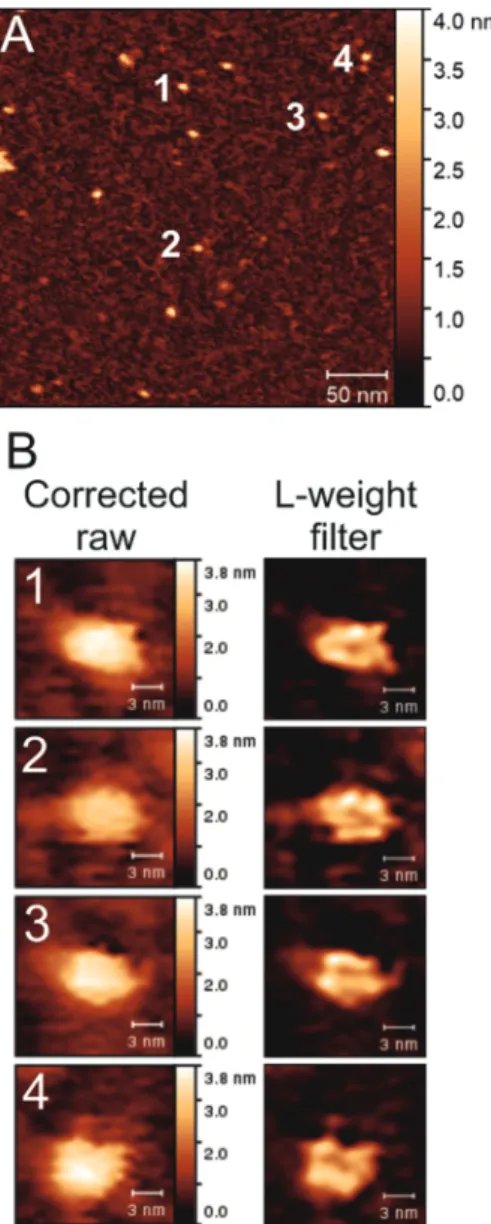
AFM imaging was first performed on isolated DrHU molecules. Throughout our figures, a scale bar (z-scale) is always associ-ated with AFM topographic images but not with the L-weight filter processed ones whose height values have been modified and become physically irrelevant. Fig. 1A displays the full-sized image from which four sub-images containing isolated protein particles were cropped and numerically magnified. The resulting images are presented in Fig. 1B on the left and their respective processed images by the L-weight filter on the right. In effect, the L-weight filter enhances the structural characteristics of molecular topography while making the structureless part fade away. From Fig. 1A, 13 particles could be selected using a threshold greater than 2 nm in height (and an area greater than 41 px) for which the average size is 8.5 ± 1.5 × 5.6 ± 0.8 nm2. For the four selected particles processed with the L-weight filter and shown in Fig. 1B, the size of DrHU particles were measured as 8.2 × 5.0, 8.0 × 5.2, 7.6 × 5.0 and 7.8 × 6.0 nm2 for the molecules labelled 1 to 4, respectively. Thus, the mean size of free DrHU post-L-weight filter is 7.9 ± 0.3 × 5.3 ± 0.5 nm2.
Since dimeric HU is widely accepted as the biologically functional unit, its size is of great concern for image analysis. To validate the size of an HU dimer in our AFM images, we superimposed multiple crystal structures of dimeric HU ortho-logs with the sup3d program.54The atomic coordinates of the reference structure for superposition were taken from PDB code 5EKA, corresponding to the HU protein from Thermus thermophilus,55the closest ortholog of DrHU. With more than 80% of the backbone atoms (N, CA, C) of the protein structures used in the superposition, the root mean square deviations (RMSDs) of each superimposed crystal structure were below 1 Å from the reference (Fig. 2A). We used the set of superim-posed structures as a composite structure to construct an in silico image of an HU dimer (Fig. 2B); the size of this HU dimer was measured as 6.7 × 5.0 nm2in good agreement with our AFM-measured particles.
AFM imaging of circular DNA
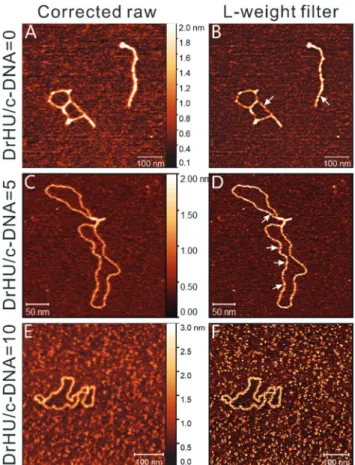
Fig. 3 shows AFM topographies of circular natively supercoiled DNA at different DrHU concentrations, where the left column displays the topographic data, and the right presents the corresponding images processed with the L-weight filter. Fig. 3A and B show the conformations and structural features observed for naked circular DNAs (among a total of six
inde-pendent images). The two images were cropped respectively from ESI Fig. S1A and S1B.†
In the full-sized images, we observed that most DNAs are highly compact, while some are partially open consistent with the presence of a small fraction of open circular form of the plasmid extracted from E. coli. Despite the variation in DNA topology, the average volume of single circular DNA molecules (N = 36) is 4045 ± 849 nm3. The high similarity in structural feature between the AFM topography (Fig. 3A) and the pro-cessed image (Fig. 3B) indicates that the L-weight filter hardly
Fig. 1 AFM images of isolated single DrHU molecules. (A) Full-sized AFM image of single free DrHU molecules at a protein concentration of 8 nM. The size of the image is of 330 × 330 nm2with 512 × 512 pixels.
(B) On the left, numerical magnification (×4) of cropped sub-images from (A). All sub-images contain 25 × 25 pixels; each presented image is therefore composed of 100 × 100 pixels with a physical size of 16.11 × 16.11 nm2. The number in the top-left corner of each image addresses
the location of the cropped object in (A). On the right, the corres-ponding processed images by the L-weightfilter.
manifests any other structural feature than the super-helical turns on the surfaces of naked circular DNAs (arrows in Fig. 3B).
The AFM images of circular DNA in the presence of DrHUs are presented in Fig. 3C–F. The middle and bottom rows illus-trate the circular DNAs at DrHU/DNA molar ratio of 5 and 10, respectively. Fig. 3C and E present AFM magnified images corresponding to the white-lined sub-images of Fig. S2A and B.† Fig. S2A† displays two kinds of DrHU–DNA complexes of contrasting compactness; one is condensed (on the left) while the other is quite loose. The average volume of the condensed configurations is about 2071 ± 1028 nm3 (N = 29), much smaller than that of a naked circular DNA described previously.
Since a high level of compactness of the DNA hinders the visualization of DrHU distribution on the DNA, we found it to be more instructive to observe DNA molecules displaying an open configuration rather than a condensed one. Thus, we focused our image processing on relatively open structures like the one present in Fig. 3C. However, it should be noted that
such a structure is not very common, despite the presence of a second partially open molecule at the top of Fig. S2A.† After applying the L-weight filter and numerical magnification to Fig. 3C, the sub-image containing the open complex is shown in Fig. 3D, while that of a condensed one is presented in Fig. 5C. The processed image in Fig. 3D reveals some substruc-tures rather different from the simple super-helical turns observed on naked DNA (Fig. 3B). These new substructures protrude out of the DNA filament, and provide evidence for the presence of bound DrHU molecules. We found that these
Fig. 2 Superposition of the Cα traces of five crystal structures of HU proteins from various species. (A) The reference structure used for superposition is PDB code 5EKA (in blue), corresponding to Thermus thermophilus HU. The other superimposed structures are colored in red for Anabaena (1P71), gray for Borrelia burgdorferi (2NP2), orange for Staphylococcus aureus (4QJU), and yellow for Escherichia coli (4YF0). (B) In silico image of HU dimer. The 3D structure used to make the image contains thefive HU crystal structures described in (A). The image was constructed at the same pixel resolution as that of the AFM image shown in Fig. 1A and subsequently magnified the same way as those in Fig. 1B with most spread projection of molecular surfaces of the compo-site structure. The y axis of the image plane can be used to indicate the protein-body axis of HU dimer. The z-scale bar, in the unit of nano-meter, is shown beside with a color gradient to indicate the height distri-bution of the image.
Fig. 3 Visualization of circular DNA (c-DNA) configurations in the absence and presence of DrHUs at a DNA concentration of 0.8 nM. The left column presents the AFM images of the molecular system while the corresponding processed images are shown on the right. (A and B) Circular DNA in the absence of DrHUs. Images (A) and (B) were obtained by numerically magnifying (×4) the cropped sub-images indicated by a white box in Fig. S1A and S1B,† respectively. Both images contain 640 × 640 pixels with a physical size of 625 × 625 nm2. White arrows in image
(B) indicate super-helical turns of naked circular DNAs. (C) Circular DNA in the presence of DrHUs at a DrHU/DNA molar ratio of 5. The AFM image consists of 512 × 512 pixels with a physical size of 325 × 325 nm2
cropped from Fig. S2A† with magnification (×2). (D) The image was acquired by processing image (C) with the L-weightfilter, the resulting image consists of 512 × 512 pixels with a physical size of 325 × 325 nm2.
White arrows indicate DrHU molecules in various shapes along the DNA filament. (E and F) Circular DNA in the presence of DrHUs at DrHU/DNA molar ratio of 10. The AFM image (E) is composed of 512 × 512 pixels with a physical size of 281 × 281 nm2cropped from Fig. S2B† with
mag-nification (×2); (F) is the processed image of (E) by the L-weight filter.
bound DrHUs are scattered along the DNA double helix and their shapes differ (white arrows in Fig. 3D). When doubling the concentration of DrHU, the DNA filament becomes uni-formly thicker and wider. In Fig. 3E, the average width of the DNA filament is∼13 nm versus ∼6 nm for the open complex in Fig. 3C. The processed image in Fig. 3F shows a lattice-like pattern on the surface of the DrHU–DNA complex, indicating a more ordered structure formed by the bound DrHUs on the DNA.
AFM imaging of linearized DNA
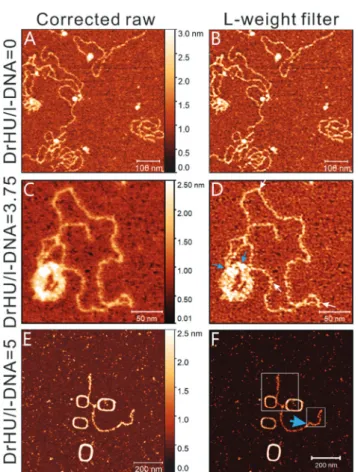
To investigate the effects of DrHU binding to DNA released from topological constraints, we performed AFM imaging on linearized pUC19 plasmid DNA (Fig. 4A and B). The images in Fig. 4A and B correspond to the sub-images in Fig. S1C and S1D.† In Fig. S1C,† naked linearized DNAs adopt various con-formations such as random coils, folded structures and aggre-gates of compact and extended DNA filaments. The size of iso-lated extended DNA filaments was estimated as the average height of open DNA filaments in the image, a value of 0.74 ± 0.14 nm, a typical size of duplex DNA obtained by AFM imaging in air on a bare mica. In the processed image of Fig. 4B, no particular protruding substructures were found on the DNA surfaces. The only structural feature observed is the super-helical turns, similar to that seen on naked circular DNAs (Fig. 3B).
Fig. 4C and D present the AFM and processed images of lin-earized DNA in the presence of DrHUs at a DrHU/DNA molar ratio of 3.75. The image of Fig. 4C is an AFM magnified image of the white-lined sub-image in Fig. S2C;† it contains a DrHU– DNA complex of both condensed and open structures. The condensed structure presents a toroidal shape. After post-pro-cessing of the image presented in Fig. 4C, the complex of mixed toroidal and open DNA configurations is shown in Fig. 4D. The L-weight filter processing of a single toroidal shape of condensed DNA, as observed in the second white square of Fig. S2C† is shown in Fig. 5D. Substructures with prominently protruding shapes can be seen in both toroid structures. The protruding substructures are, as mentioned earlier, indicative of bound DrHUs in the complex. In both figures, some individual DrHU molecules indicated by white arrows are distinguishable, while others are clustered (blue arrows). Along the open DNA filaments of the complex in Fig. 4D, the bound DrHUs exhibit a variety of molecular shapes (exemplified by white arrows in the image). The shape of a bound DrHU dimer most likely reflects the binding orien-tation of the protein relative to the DNA filament.
Fig. 4E–F show the AFM and processed images for four complexes of linearized DNA and DrHU at a DrHU/DNA molar ratio of 5. Three of them adopt an intriguing large oblong con-figuration, with a much larger central hole than the two encountered in Fig. 4C and 5D. The fourth complex is com-posed of an oblong structure from which two open filaments extend in opposite direction. The apparent widths of the open filaments are varied with the local abundance of bound DrHUs. With high levels of bound DrHU, the DNA segment (around the smaller white square in Fig. 4F) has a width ranging from∼10 to 14 nm, while that measured for stacked filaments of oblong structures is ∼10 nm. Fig. 5A and B present magnification results of two sub-images of Fig. 4F. From the structural details revealed in Fig. 5A, the two open filaments seem to twine with the oblong body, suggesting a shared folding mechanism and the presence of multiple turns of DNA filaments within the oblong body. Height measure-ments of these oblong structures indicate that the estimated
Fig. 4 Visualization of linearized DNA (l-DNA) configurations in the absence and presence of DrHU proteins. The left column presents AFM images of probed molecules while the corresponding processed images are shown on the right. (A and B) Naked linearized DNA at 8.0 nM. The images were obtained by numerical magnification (×4) with respect to the white-lined sub-images of Fig. S1C and D,† containing 640 × 640 pixels with a physical size of 625 × 625 nm2. (C) Linearized DNA in the
presence of DrHUs at a DrHU/DNA molar ratio of 3.75, where the con-centration is 7.5 nM for DrHU and 2 nM for DNA cropped from Fig. S2C† with magnification (×2). The AFM image (C) contains 512 × 512 pixels with a physical size of 332 × 332 nm2. (D) Processed image of (C) using
the L-weightfilter. White arrows indicate isolated DrHU dimers, whereas blue arrows specify the regions of higher DrHU abundance. (E and F) AFM and processed images of linearized DNA in presence of DrHU at a DrHU/DNA molar ratio of 5, where the concentrations of DrHU and DNA are 4.0 nM and 0.8 nM, respectively. Images (E and F) are composed of 1024 × 1024 pixels with a physical size of 1 × 1 µm2. In image (F), a small
and a large white box indicate the position of the sub-images presented in Fig. 5A and B, respectively; the former consists of 128 × 128 pixels while the latter of 256 × 256 pixels. The thick blue arrow labels the DrHU packing resembling a piece of ribbon.
number of bound DrHU molecules was lower in the oblong structure than in the thickened segment of the open DNA fila-ment. It is important to point out that these intriguing oblong structures were not frequently observed (only in three AFM images out of a total of 16 images). Among the three images, one was obtained on a naked linearized DNA which indicates that they are likely composed largely of stacked DNA filaments (Fig. S3†). However, condensed and toroid shapes (as in Fig. 5D) are more commonly found as displayed in Fig. S2C.†
In Fig. 4F, bound DrHUs appear to distribute over the open filaments unevenly, speaking in terms of abundance and spatial arrangement. According to size measurements, we found that several DrHU dimers are clustered on the DNA segment of higher DrHU abundance. Some DrHUs, in the form of one or two dimer-dimer pairs, are packed in the direction transverse to the DNA axis (thick blue arrows in Fig. 4F and 5A, B), while a single-dimer binding can be found in the area of low DrHU abundance (the white arrow in Fig. 5A). Moreover, DrHUs were found in Fig. 5A to bind to the DNA filament obliquely with different tilt angles, as indicated by the thin blue arrow, a DrHU dimer, and the thick blue arrow, paired DrHU dimers.
Discussion
Size and shape of free DrHU
Despite some variations in protein sequences of HU proteins from different organisms, their 3D structures are well con-served,56as evidenced by the excellent structural superposition (Fig. 2A). This implies that any HU crystal structure is eligible to be used as a structure template,54 or to construct the in silico image as a reference for comparison. The dimensions of free DrHU were estimated to be on average∼7.9 × 5.3 nm2 by AFM using the L-weight filter, while that of the HU compo-site structure are 6.7 × 5.0 nm2. Thus, the AFM imaging result is in good agreement with that derived from X-ray crystallogra-phy with a discrepancy of only about 1 nm, confirming that the isolated DrHU particles imaged are protein dimers. The slightly longer length of DrHU dimers could be attributed to their extended N-terminal tails, which are absent in the crystal structures used to prepare the in silico model (Fig. 2B). The successful determination of the oligomeric state of isolated DrHU particles validates AFM imaging as a technique to ade-quately derive the quaternary structure of a protein molecule.
In addition to size measurements of DrHU, AFM imaging also allows the visualization of various shapes of isolated DrHU dimers. One should be aware that in solution the protein conformation is largely susceptible to thermal motion and distortion57 which affect the shape of the protein, and accordingly its size displayed in the image. In Fig. 1B, three out of the four DrHU dimers most likely align their protein-body axis on the mica surface, while the last one (object 4) orients its protein-body axis in an oblique direction relative to the mica surface. Each shape with different structural details represents a different conformation or orientation of DrHU
Fig. 5 Close-up views of structural details of DrHU–DNA complexes with raw processed and L-weightfilter images shown on the left and right, respectively. (A) Intertwined connection between stacked oblong shapes and linearfilaments. The image consists of 512 × 512 pixels with a physical size of 250 × 250 nm2, a sub-image from the large white box
in Fig. 4E and F by numerical magnification (×2). Yellow arrows indicate free DrHU dimers with likelyβ-arms like a fish tail, while the white arrow points to a bound DrHU dimer also with putativeβ-arms. The thin blue arrow points at a single dimer withβ-arms hidden by certain protein orientation, while the other two blue arrows indicate paired DrHU dimers. (B) DrHU multimerization on linearfilaments of linearized DNA complex. The image consists of 512 × 512 pixels with a physical size of 125 × 125 nm2, and was processed by the following procedures:
sub-image cropped from the small white box in Fig. 4F, with numerical mag-nification (×4). The thick blue arrows illustrate bound DrHU dimers in a paired form. (C) Condensed configuration of circular DNA upon DrHU binding. The image contains 512 × 512 pixels and a physical size of 162.5 × 162.5 nm2, obtained by performing the L-weight filter on image
Fig. S2A,† cropping the target object in the processed image with an application of numerical magnification (×4). The white arrows indicate the presence of bound DrHUs on the supercoiled DNA. (D) Condensed configuration of linearized DNA upon DrHU binding. Image (D) was acquired as follows: processing image Fig. S2C† by the L-weight filter and performing numerical magnification (×4) on the cropped sub-image. The image consists of 512 × 512 pixels and a physical size of 166 × 166 nm2. The white arrows point out the presence of bound DrHUs,
while the blue arrow highlights the higher abundance of DrHU in the region of crossed DNAfilaments.
dimers, where the surface features reflect the arrangement of secondary structure elements of the protein.
One can find different shapes of DrHU dimers in Fig. 5A, where two isolated DrHU dimers (indicated by yellow arrows) adopt a fish-like shape, in which the tail most likely corres-ponds to the β-arms of the DrHU dimer. According to the superimposed structures, the length of the β-arms extending out of the helical body is slightly greater than 3 nm.
Shape and orientation of bound DrHU
At low DrHU concentrations, it is challenging to detect the pres-ence of bound DrHUs based on the thickness or width measure-ment of DNA filameasure-ments (Fig. 3C and 4C). Nevertheless, this limit-ation can be waived by examining the topographic substructures of protein–DNA assemblies enhanced by the L-weight filter. Provided with the known structure of HU dimers, it becomes possible to deduce the binding orientation of a DrHU dimer from AFM images. In the processed images of Fig. 3D and 4D, the bound DrHUs appear in different shapes along the open DNA filament, highlighting individual arrangements of bound DrHU dimers. That makes each DrHU molecule discernible and its shape apprehensible (see white arrows in Fig. 3D and 4D). In par-ticular, the binding orientations of some DrHU dimers can be determined by the positioning of their β-arms, which are deduced from the elongated conformation of DrHU (Fig. 2). Moreover, we were able to distinguish some regions in the complex (blue arrows in Fig. 4D) from others by their denser binding of DrHU. Our images suggest a structural preference of DrHU for binding on stacked DNA filaments. This propensity is consistent with a previous finding that the full-length DrHU has a higher affinity for the arms of four-way DNA junctions than for a simple DNA duplex.58 Besides, our AFM images reveal that DrHU possesses the bridging ability to tether distinct DNA fila-ments or promote long-ranged DNA contacts.
On the open DNA filaments shown in Fig. 4F and 5A, B, a couple of paired DrHU dimers is observed to bind alternately on one side and the other of the DNA duplex, which could be attributed to the helical distribution of DNA binding sites. As observed in Fig. 5A, the two extended DNA filaments may gradually integrate into the more condensed oblong com-ponent. The DNA segments close to the merging region exhibit a low DrHU binding density, even down to a single protein dimer (the white arrow in Fig. 5A). This configuration implies that an exclusion of some DrHU molecules is likely required to integrate DNA filaments into the condensed DNA of the oblong body. This image thus suggests that reorganization of DNA configuration is probably accompanied by a change in the distribution of bound DrHUs. The dynamic nature of DrHU binding to DNA may result from the relatively low affinity of HU binding to double-stranded DNA in general58–60
including a weak-strength characteristic of electrostatic interactions41,61between the protein and DNA.
Multimerization of DrHU
As the concentration of DrHU was increased to a DrHU/DNA molar ratio of 10, we observed a global thickening of the DNA
filament (Fig. 3E). Similar thickening of DNA filaments by a large amount of bound E. coli HU heterodimers has also been reported.46From the processed image in Fig. 3F, we found that many indiscernible copies of DrHU protein cover the DNA fila-ment. Beyond the thickening effect, the high-density binding of DrHU yields a lattice-like pattern on the molecular surface of the DrHU–DNA complex. This pattern reflects the formation of a structured interaction network that governs multimeriza-tion of DrHU over the DNA surface, thus resulting in a higher order architecture. This hallmark feature can be used to dis-tinguish DNA surfaces bound by a very high density of DrHUs, that form ordered structures on the DNA. The formation of higher order architectures has been proposed to be a prerequi-site for a cooperative behavior of HU binding to DNA.62–64Our results show structural evidence of cooperativity for DrHU– DNA binding. On the contrary, DrHU binding to 50- and 89-mer DNA duplexes did not exhibit such cooperativity.43The difference may come from the different lengths and topology of the DNA molecules used in the two studies, 50–89 vs. 2686 bps. In our case, the long DNA provides a structured template for building up an effective higher order structure for DrHUs.
As shown in Fig. 4E and F, the thickening of DNA filaments was also observed in DrHU linearized–DNA complexes. The shape of the DNA segment thickened by bound DrHUs resembles a piece of ribbon. A similar structural pattern has been revealed by EM imaging of DNA fragments bound to Bacillus SASP protein.65 The ribbon-shaped DNA segment results from a tight arrangement of bound DrHUs along the DNA filament thereby facilitating protein multimerization. By examining the substructures revealed in Fig. 4F and 5A, B, we found that DrHU multimerization occurred preferentially on relatively straight DNA segments. DrHU dimers align them-selves in the transverse direction of the DNA filament leading to an increase in the width of the DNA filament, and in the direction of the DNA main axis. In the latter case, DrHU multi-merization continues to grow along the DNA filament. The protein multimerization of E. coli HU has been proposed to promote straightening but not bending of the DNA axis.41In DrHU–DNA complexes, the DNA molecule, however, is not totally straightened out to the end, instead it tends to integrate within the condensed DNA structure. Nevertheless, local DrHU multimerization makes finite pseudo-straight DNA segments straightened or stiffened temporarily. Taken together, the for-mation of an effective higher order structure, which promotes cooperative binding of DrHU, requires a long enough DNA and sufficient amount of DrHUs.
Condensation and de-condensation effects of DrHU
A caveat of imaging single molecules is the lack of repeatability of their individual shapes. Beyond the problem known as “operational aspects”, fully described for AFM imaging of nanoparticles,66 a critical step is the adsorption of sample molecules onto a flat and globally charged mica substrate. All the data of this work has been obtained from four indepen-dent experiments. The more than one hundred AFM images collected over this period did not display twice the same
figuration of DNA or DrHU–DNA complexes. A good example of this is provided by our AFM images of natively supercoiled pUC19, which in most cases adopts a compact configuration, but is occasionally seen in a partially open configuration. Under different AFM imaging conditions such as in liquid and/or using a chemical modification of the mica surface, pUC19 supercoiled plasmids have been observed to adopt different configurations,67 although compact configurations
were also observed when imaging pUC19 in air.68In this work, special attention has been given to particular configurations of DNA and DrHU–DNA complexes with two objectives: describe the condensation of DNA upon DrHU binding and select the configurations for which image processing will most efficiently decipher the conformation of bound molecules.
For circular supercoiled DNAs in the presence of a low con-centration of DrHU (DrHU/DNA≤5), the measured volumes of condensed DNA complexes are about half of that for naked cir-cular supercoiled DNAs (2071 ± 1028 nm3vs. 4045 ± 849). The volume reduction indicates that DrHU binding leads to increased DNA compactness. This provides a possibility for resolving a previous puzzle in the analysis of gel retardation assays that the increasing mobility of the supercoiled DNA in the low range of HU/DNA ratio cannot be interpreted by further super-helical turns introduced by HU–DNA binding.61 Such a condensation resulting from DrHU binding was also observed with linearized DNAs (Fig. S2C vs. S1C†).
In the processed image of Fig. 5C, DrHUs are visibly distrib-uted on supercoiled surfaces of the circular DNA. In the con-figuration of linearized DNA shown in Fig. 5D, bound DrHUs are visible almost throughout the entire DNA chain. It is likely that the circular DNA molecule has self-twisted and pre-formed a compact configuration, which was further stabilized and constrained by incoming DrHUs. However, as inferred by the configuration of DrHU–DNA complex in Fig. 4D, where the open complexed filaments tend to associate with a condensed, toroid component, the condensed configuration of DrHU bound to linear DNA as seen in Fig. 5D could be initially in an open form and subsequently condensed into the compact structure. The above elucidates two possible mechanisms for DNA condensation. As described previously, the binding of DNA and HU protein is highly dynamic, leading to a rapid exchange between free and HU–bound states of DNA61,69and between open and supercoiled configurations.63,70 The two condensation mechanisms may happen to DNA in a combina-tory manner by changing alternately the DNA topology and the distribution of bound DrHUs.
In the open DNA configuration at high DrHU concen-tration, the DrHU–circular DNA complex, as seen in Fig. 3F, is neither twisted like naked circular DNAs nor condensed as the compact DrHU–bound DNAs at a lower DrHU/DNA molar ratio (Fig. S2A†). Further comparison made with the DrHU–bound DNA in Fig. 3D reveals that the DNA complex in Fig. 3F is not only more open but also globally thickened. The thickening of the DNA filament upon HU binding has been suggested to symbolize the stiffening of the DNA,46,71 which as a result becomes too rigid to fold. The enlargement of DNA spreading
upon more DrHU binding reflects a de-condensation effect. Essentially, one can regard the apparently opposite effects of DrHU binding as a stabilization result for the DrHU–DNA complex. Taken together, the interplay between the dynamic behavior of DNA molecules and the level of DrHU plays a crucial role in the functional plasticity of the protein.
Conclusions
This study has shown that the AFM imaging combined with the L-weight filter allows us to study the topography of biologi-cal molecules represented in a wide spectrum of sizes and forms. For example, we managed to distinguish different con-formations of a small protein, the free DrHU protein dimer (∼25 kDa). In DrHU–DNA complexes, the orientation of DrHU dimers bound to the DNA can be determined from their dis-tinctive shapes in the image. The L-weight filter was shown to significantly alleviate AFM tip-convolution effects so that the structural features of the imaged molecule can be greatly enhanced. The revelation of detailed structures gives us the confidence to comprehend and interpret the molecular behav-ior of DrHU protein upon DNA-binding from AFM images. From the present results, DrHU was shown to possess the ability to bridge and tether flexible DNA molecules. The topo-graphic structures of DrHU–DNA complexes clearly demon-strate that DrHUs can multimerize over the surface of the DNA filament to form a higher order structure when the protein concentration is high. The building of a higher order architec-ture promotes cooperative binding of DrHU to DNA. By com-bining geometric analyses with L-weight filtering, AFM imaging reveals that DrHU binding may exert both conden-sation and de-condenconden-sation effects; this dual functionality of DrHU depends on naked DNA configuration and the protein concentration. The condensation effect of DrHU binding is observed by stabilizing the compact conformation of naked DNA or by increasing the compactness of condensed DNA con-figuration. The de-condensation effect stiffens DNA filaments, and expands the width of open DNA configuration. They also provide valuable information regarding the DNA-binding pro-perties of HU proteins, especially the one from D. radiodurans, DrHU, and its close orthologues from the genus Deinococcus.
Con
flicts of interest
There are no conflicts to declare.Acknowledgements
IBS acknowledges integration into the Interdisciplinary Research Institute of Grenoble (IRIG, CEA). This work acknowl-edges the AFM platform at the IBS. This work was supported in part by the Grenoble Alliance for Integrated Structural Cell Biology [ANR-10-LABX-49-01] and by the Commissariat à
l’Energie Atomique et aux Energies Alternatives [CFR fellow-ship to A. S. B.] and [Radiobiology grant].
Notes and references
1 L. Springall, A. V. Inchingolo and N. M. Kad, Methods Mol. Biol., 2016, 1431, 141–150.
2 D. I. Cherny and T. M. Jovin, J. Mol. Biol., 2001, 313, 295– 307.
3 V. Cassina, D. Seruggia, G. L. Beretta, D. Salerno, D. Brogioli, S. Manzini, F. Zunino and F. Mantegazza, Eur. Biophys. J., 2011, 40, 59–68.
4 L. Li, R. An, J. Tang, Z. Sui, G. Wang, M. Komiyama and X. Liang, Biophys. J., 2020, 118, 1702–1708.
5 S. Blouin, T. D. Craggs, D. A. Lafontaine and J. C. Penedo, Methods Mol. Biol., 2015, 1334, 115–141.
6 H. G. Hansma, R. L. Sinsheimer, M. Q. Li and P. K. Hansma, Nucleic Acids Res., 1992, 20, 3585–3590. 7 H. G. Hansma, D. E. Laney, M. Bezanilla, R. L. Sinsheimer
and P. K. Hansma, Biophys. J., 1995, 68, 1672–1677. 8 N. K. Lee, T. Schmatko, P. Muller, M. Maaloum and
A. Johner, Phys. Rev. E: Stat., Nonlinear, Soft Matter Phys., 2012, 85, 051804.
9 G. Witz, K. Rechendorff, J. Adamcik and G. Dietler, Phys. Rev. Lett., 2008, 101, 148103.
10 Y. L. Lyubchenko, L. S. Shlyakhtenko, T. Aki and S. Adhya, Nucleic Acids Res., 1997, 25, 873–876.
11 B. J. Rackstraw, A. L. Martin, S. Stolnik, C. J. Roberts, M. C. Garnett, M. C. Davies and S. J. B. Tendler, Langmuir, 2001, 17, 3185–3193.
12 D. D. Dunlap, A. Maggi, M. R. Soria and L. Monaco, Nucleic Acids Res., 1997, 25, 3095–3101.
13 S. Cosgriff, K. Chintakayala, Y. T. A. Chim, X. Y. Chen, S. Allen, A. L. Lovering and D. C. Grainger, Mol. Microbiol., 2010, 77, 1289–1300.
14 Y. L. Lyubchenko and L. S. Shlyakhtenko, Methods, 2009, 47, 206–213.
15 S. C. Dillon and C. J. Dorman, Nat. Rev. Microbiol., 2010, 8, 185–195.
16 P. Ghatak, K. Karmakar, S. Kasetty and D. Chatterji, PLoS One, 2011, 6, e16019.
17 V. V. Melekhov, U. S. Shvyreva, A. A. Timchenko, M. N. Tutukina, E. V. Preobrazhenskaya, D. V. Burkova, V. G. Artiukhov, O. N. Ozoline and S. S. Antipov, PLoS One, 2015, 10, e0126504.
18 A. Japaridze, S. Renevey, P. Sobetzko, L. Stoliar, W. Nasser, G. Dietler and G. Muskhelishvili, J. Biol. Chem., 2017, 292, 7607–7618.
19 N. T. Odermatt, M. Lelli, T. Herrmann, L. A. Abriata, A. Japaridze, H. Voilquin, R. Singh, J. Piton, L. Emsley, G. Dietler and S. T. Cole, J. Struct. Biol., 2020, 209, 107434. 20 A. Mishra, M. Vij, D. Kumar, V. Taneja, A. K. Mondal,
A. Bothra, V. Rao, M. Ganguli and B. Taneja, PLoS One, 2013, 8, e69985.
21 R. T. Dame, M. S. Luijsterburg, E. Krin, P. N. Bertin, R. Wagner and G. J. L. Wuite, J. Bacteriol., 2005, 187, 1845– 1848.
22 S. Maurer, J. Fritz and G. Muskhelishvili, J. Mol. Biol., 2009, 387, 1261–1276.
23 C. J. Lim, S. Y. Lee, L. J. Kenney and J. Yan, Sci. Rep., 2012, 2, 509.
24 J. Lin, H. Chen, P. Droge and J. Yan, PLoS One, 2012, 7, e49885.
25 Y. F. Gao, Y. H. Foo, R. S. Winardhi, Q. N. Tang, J. Yan and L. J. Kenney, Proc. Natl. Acad. Sci. U. S. A., 2017, 114, 12560– 12565.
26 R. L. Ohniwa, H. Muchaku, S. Saito, C. Wada and K. Morikawa, PLoS One, 2013, 8, e72954.
27 T. A. Azam and A. Ishihama, J. Biol. Chem., 1999, 274, 33105–33113.
28 T. A. Azam, A. Iwata, A. Nishimura, S. Ueda and A. Ishihama, J. Bacteriol., 1999, 181, 6361–6370.
29 P. Stojkova, P. Spidlova and J. Stulik, Front. Cell. Infect. Microbiol., 2019, 9, 159.
30 I. Tanaka, K. Appelt, J. Dijk, S. W. White and K. S. Wilson, Nature, 1984, 310, 376–381.
31 H. Vis, M. Mariani, C. E. Vorgias, K. S. Wilson, R. Kaptein and R. Boelens, J. Mol. Biol., 1995, 254, 692–703.
32 F. Boubrik and J. Rouviere-Yaniv, Proc. Natl. Acad. Sci. U. S. A., 1995, 92, 3958–3962.
33 S. Li and R. Waters, J. Bacteriol., 1998, 180, 3750–3756. 34 D. R. Storts and A. Markovitz, J. Bacteriol., 1988, 170, 1541–
1547.
35 S. Kar, R. Edgar and S. Adhya, Proc. Natl. Acad. Sci. U. S. A., 2005, 102, 16397–16402.
36 R. T. Dame, Mol. Microbiol., 2005, 56, 858–870.
37 H. H. Nguyen, C. B. de la Tour, M. Toueille, F. Vannier, S. Sommer and P. Servant, Mol. Microbiol., 2009, 73, 240– 252.
38 K. K. Swinger, K. M. Lemberg, Y. Zhang and P. A. Rice, EMBO J., 2003, 22, 3749–3760.
39 D. H. Kim, H. Im, J. G. Jee, S. B. Jang, H. J. Yoon, A. R. Kwon, S. M. Kang and B. J. Lee, Acta Crystallogr., Sect. D: Biol. Crystallogr., 2014, 70, 3273–3289.
40 K. W. Mouw and P. A. Rice, Mol. Microbiol., 2007, 63, 1319– 1330.
41 M. Hammel, D. Amlanjyoti, F. E. Reyes, J. H. Chen, R. Parpana, H. Y. Tang, C. A. Larabell, J. A. Tainer and S. Adhya, Sci. Adv., 2016, 2, e1600650.
42 C. B. de la Tour, L. Blanchard, R. Dulermo, M. Ludanyi, A. Devigne, J. Armengaud, S. Sommer and A. de Groot, Microbiology, 2015, 161, 2410–2422.
43 S. Ghosh and A. Grove, Biochemistry, 2006, 45, 1723–1733. 44 J. Rouviere-Yaniv, M. Yaniv and J. E. Germond, Cell, 1979,
17, 265–274.
45 T. H. Eickbush and E. N. Moudrianakis, Cell, 1978, 13, 295–306.
46 J. van Noort, S. Verbrugge, N. Goosen, C. Dekker and R. T. Dame, Proc. Natl. Acad. Sci. U. S. A., 2004, 101, 6969– 6974.
47 J. Kim, S. H. Yoshimura, K. Hizume, R. L. Ohniwa, A. Ishihama and K. Takeyasu, Nucleic Acids Res., 2004, 32, 1982–1992.
48 S. W. Chen, J. M. Teulon, C. Godon and J. L. Pellequer, J. Mol. Recognit., 2016, 29, 51–55.
49 N. J. Anthis and G. M. Clore, Protein Sci., 2013, 22, 851–858. 50 D. Nečas and P. Klapetek, Cent. Eur. J. Phys., 2012, 10, 181–
188.
51 S.-w. W. Chen and J. L. Pellequer, BMC Struct. Biol., 2011, 11, 7.
52 S.-w. W. Chen, M. Odorico, M. Meillan, L. Vellutini, J.-M. Teulon, P. Parot, B. Bennetau and J.-L. Pellequer, Nanoscale, 2013, 22, 10877–10886.
53 S.-w. W. Chen and J.-L. Pellequer, Nucleic Acids Res., 2013, 41, W412–W416.
54 S.-w. W. Chen and J.-L. Pellequer, Curr. Med. Chem., 2004, 11, 595–605.
55 A. C. Papageorgiou, P. S. Adam, P. Stavros, G. Nounesis, R. Meijers, K. Petratos and C. E. Vorgias, Extremophiles, 2016, 20, 695–709.
56 D. Kamashev, Y. Agapova, S. Rastorguev, A. A. Talyzina, K. M. Boyko, D. A. Korzhenevskiy, A. Vlaskina, R. Vasilov, V. I. Timofeev and T. V. Rakitina, PLoS One, 2017, 12, e0188037.
57 J. Ramstein, N. Hervouet, F. Coste, C. Zelwer, J. Oberto and B. Castaing, J. Mol. Biol., 2003, 331, 101–121.
58 S. Ghosh and A. Grove, J. Mol. Biol., 2004, 337, 561–571.
59 V. Berthold and K. Geider, Eur. J. Biochem., 1976, 71, 443– 449.
60 A. Balandina, D. Kamashev and J. Rouviere-Yaniv, J. Biol. Chem., 2002, 277, 27622–27628.
61 H. Shindo, A. Furubayashi, M. Shimizu, M. Miyake and F. Imamoto, Nucleic Acids Res., 1992, 20, 1553–1558. 62 J. D. McGhee and P. H. von Hippel, J. Mol. Biol., 1974, 86,
469–489.
63 Y. Flashner and J. D. Gralla, Cell, 1988, 54, 713–721. 64 A. M. Segall, S. D. Goodman and H. A. Nash, EMBO J.,
1994, 13, 4536–4548.
65 J. Griffith, A. Makhov, L. Santiago-Lara and P. Setlow, Proc. Natl. Acad. Sci. U. S. A., 1994, 91, 8224–8228.
66 J.-M. Teulon, C. Godon, L. Chantalat, C. Moriscot, J. Cambedouzou, M. Odorico, J. Ravaux, R. Podor, A. Gerdil, A. Habert, N. Herlin-Boime, S.-w. W. Chen and J.-L. Pellequer, Nanomaterials, 2019, 9, 18.
67 J. Adamcik, J. H. Jeon, K. J. Karczewski, R. Metzler and G. Dietler, Soft Matter, 2012, 8, 8651–8658.
68 J. Adamcik, V. Viglasky, F. Valle, M. Antalik, D. Podhradsky and G. Dietler, Electrophoresis, 2002, 23, 3300–3309. 69 K. Floc’h, F. Lacroix, P. Servant, Y. S. Wong, J. P. Kleman,
D. Bourgeois and J. Timmins, Nat. Commun., 2019, 10, 3815. 70 S. S. Broyles and D. E. Pettijohn, J. Mol. Biol., 1986, 187,
47–60.
71 J. Rouviere-Yaniv and F. Gros, Proc. Natl. Acad. Sci. U. S. A., 1975, 72, 3428–3432.