HAL Id: hal-02399049
https://hal.archives-ouvertes.fr/hal-02399049
Submitted on 8 Dec 2019
HAL is a multi-disciplinary open access archive for the deposit and dissemination of sci-entific research documents, whether they are pub-lished or not. The documents may come from teaching and research institutions in France or abroad, or from public or private research centers.
L’archive ouverte pluridisciplinaire HAL, est destinée au dépôt et à la diffusion de documents scientifiques de niveau recherche, publiés ou non, émanant des établissements d’enseignement et de recherche français ou étrangers, des laboratoires publics ou privés.
Pathogen-specific controls are better than human gene
amplification
Guillaume Roux, Christophe Ravel, Emmanuelle Varlet-Marie, Rachel
Jendrowiak, Patrick Bastien, Yvon Sterkers
To cite this version:
Guillaume Roux, Christophe Ravel, Emmanuelle Varlet-Marie, Rachel Jendrowiak, Patrick Bastien, et al.. Inhibition of polymerase chain reaction: Pathogen-specific controls are better than human gene amplification. PLoS ONE, Public Library of Science, 2019, 14 (9), pp.e0219276. �10.1371/jour-nal.pone.0219276�. �hal-02399049�
Inhibition of polymerase chain reaction:
Pathogen-specific controls are better than
human gene amplification
Guillaume Roux1¤, Christophe Ravel2, Emmanuelle Varlet-Marie2, Rachel Jendrowiak2, Patrick Bastien2, Yvon SterkersID2*
1 Univ. Montpellier, and Laboratoire de Microbiologie, Centre Hospitalier Universitaire (CHU) of Nıˆmes, Nıˆmes, France, 2 Univ. Montpellier, Centre Hospitalier Universitaire (CHU) of Montpellier, Dept. of Parasitology-Mycology, Research Unit MiVEGEC, CNRS, IRD, Montpellier, France
¤ Current address: Centre Hospitalier de Gap, Laboratoire de Biologie, Gap, France
*yvon.sterkers@umontpellier.fr
Abstract
PCR inhibition is frequent in medical microbiology routine practice and may lead to false-negative results; however there is no consensus on how to detect it. Pathogen-specific and human gene amplifications are widely used to detect PCR inhibition. We aimed at compar-ing the value of PCR inhibitor detection uscompar-ing these two methods. We analysed Cp shifts (ΔCp) obtained from qPCRs targeting either the albumin gene or the pathogen-specific sequence used in two laboratory-developed microbiological qPCR assays. 3152 samples including various matrixes were included. Pathogen-specific amplification and albumin qPCR identified 62/3152 samples (2.0%), and 409/3152 (13.0%) samples, respectively, as inhibited. Only 16 samples were detected using both methods. In addition, the use of the Youden’s index failed to determine adequate Cp thresholds for albumin qPCR, even when we distinguished among the different sample matrixes. qPCR targeting the albumin gene therefore appears not adequate to identify the presence of PCR inhibitors in microbiological PCR assays. Our data may be extrapolated to other heterologous targets and should dis-courage their use to assess the presence of PCR inhibition in microbiological PCR assays.
Introduction
Molecular biology and particularly real-time PCR (qPCR) has revolutionized the biological diagnosis of infectious diseases. Nonetheless, PCR may fail because it is based on an enzymatic reaction susceptible to various mechanisms of inhibition [1]. Inhibition of PCR reaction is fre-quent in clinical microbiology and exposes to the risk of false negative results, hence PCR inhi-bition screening is recommended [2,3]. PCR inhibition appears as a hardly predictable event and data about its actual frequency in routine practice of clinical biology laboratories are scarce [4,5]. Differential susceptibility of each type of qPCR to different inhibitors and heterogeneity of sample matrixes make its detection non trivial. Many methods to detect PCR inhibition have been reported and some guidelines have been published. The use of PCR controls with a defined quantity of DNA molecules to check for the presence of a Cp switch due to the
a1111111111 a1111111111 a1111111111 a1111111111 a1111111111 OPEN ACCESS
Citation: Roux G, Ravel C, Varlet-Marie E, Jendrowiak R, Bastien P, Sterkers Y (2019) Inhibition of polymerase chain reaction: Pathogen-specific controls are better than human gene amplification. PLoS ONE 14(9): e0219276.https:// doi.org/10.1371/journal.pone.0219276
Editor: Antonella Marangoni, Universita degli Studi di Bologna Scuola di Medicina e Chirurgia, ITALY Received: June 12, 2019
Accepted: August 23, 2019 Published: September 27, 2019
Peer Review History: PLOS recognizes the benefits of transparency in the peer review process; therefore, we enable the publication of all of the content of peer review and author responses alongside final, published articles. The editorial history of this article is available here:
https://doi.org/10.1371/journal.pone.0219276
Copyright:© 2019 Roux et al. This is an open access article distributed under the terms of the
Creative Commons Attribution License, which permits unrestricted use, distribution, and reproduction in any medium, provided the original author and source are credited.
Data Availability Statement: All relevant data are within the paper and its Supporting Information files.
presence of inhibitors in the sample extract is relevant; however it is risky since technicians may have to manipulate and distribute target DNA, thus increasing the risk of inter-well con-tamination. ’Internal’ amplification controls, based on alien DNA added at a low concentra-tion in the specimen before DNA extracconcentra-tion, and of which the presence must be checked in a duplex PCR together with the target, is also highly relevant. Most of commercial inhibition controls are based on this principle. The rationale of using a human gene as an extraction or inhibition control is less acceptable because the human DNA target is present in high quantity in the sample as compared to the target DNA [6]. Importantly, there is presently no consensus for PCR inhibition detection in routine practices. For example, in the single field of molecular diagnosis of toxoplasmosis in France, seven different methods are used to detect PCR inhibi-tion in 30 laboratories [7]. Most of them use either a pathogen pathogen-specific PCR or a human gene amplification method. The former is an internal control made of either genomic
T. gondii DNA or a plasmid containing the targeted pathogen DNA sequence. It has one major
drawback which is the increased risk of false positive results due to increased amounts of amplicons and airborne contamination of reaction wells. Amplification controls may be pre-pared from genomic DNA (as in ourToxoplasma-PCR assay) or from the target DNA
sequence cloned in a plasmid (as in ourPneumocystis-PCR assay). One development of the
plasmid strategy is to clone a chimeric sequence to be amplified by the same primers than the PCR target but detected by specific probe(s) [8–11]. In the second type of method, albumin, beta-globin or human RNase P genes are targeted. This method is found attractive since (i) they can be implemented in all qPCR assays involving human samples; and (ii) they constitute a complete process control for DNA extraction and amplification. Yet, human gene qPCR cycle of positivity (Cp) depends also on the initial human DNA content or cellularity in the clinical sample, which is highly variable. Indeed, DNA content or cellularity depends on the size/volume of the sample, the matrix,i.e. the nature of the sample, such as blood or
cerebro-spinal fluid, and on the pathophysiological state of the patients. The control of DNA extraction is another critical step of molecular diagnosis, but was not explored in our study. In addition, it is reported in the literature that PCR methods differing by their primers and/or amplified sequence have variable susceptibility to inhibitors [12–14]. These studies tend to invalidate the assumption that absence of inhibition in a qPCR targeting any human gene has a good predic-tive value for assessing inhibition in a qPCR targeting a pathogen. Consequently, it is critical to assess the performances of human gene-based PCR inhibition screening methods in clinical samples in clinical microbiology routine practice.
In this study, (i) we analyse the frequency of PCR inhibition in a large range of clinical sam-ples and (ii) we show that human gene-based qPCR methods are not efficient to affirm the presence/absence of PCR inhibitors.
Methods
We retrospectively analysedToxoplasma and Pneumocystis qPCR tests for all the clinical
sam-ples analysed in 2016 in the Department of Parasitology-Mycology at the academic hospital of Montpellier (Montpellier, France).
DNA extraction
The DNA extraction method was dependent on the PCR assay and the sample matrix. For
Pneumocystis-PCR, all types of respiratory samples were analysed, including bronchoalveolar
lavage fluid (BALF), sputum, bronchoaspiration, nasal aspiration and pleural fluid; DNA was extracted using QIAamp DNA minikit (Qiagen) according to the manufacturer specifications. ForToxoplasma-PCR, the DNA extraction method depended on the matrix. For low cellular Funding: "RSI Assurance Maladie Professions
Libe´rales - Provinces. C.A.M.P.L.P." has paid the LightCycler 480 (Roche®) real-time PCR equipment in 2009. The funders had no role in study design, data collection and analysis, decision to publish, or preparation of the manuscript. Competing interests: We acknowledge the financial support of the "RSI Assurance Maladie Professions Libe´rales - Provinces. C.A.M.P.L.P." for buying the LightCycler 480 (Roche®) real-time PCR equipment. Since this funder had no role in study design, data collection and analysis, decision to publish, or preparation of the manuscript; this does not alter our adherence to PLOS ONE policies on sharing data and materials.
samples such as cerebrospinal fluids (CSF), aqueous humor, amniotic fluids and crystal clear BALF, DNA was extracted using the Tween-Nonidet-NaOH method[15]. WhenPneumocystis
andToxoplasma qPCRs were performed on the same sample, QIAamp DNA minikit (Qiagen)
was used. Other samples were processed using protein precipitation solution (A795A; Pro-mega, France)[16]. As recommended, DNA extracts were then stored at– 20˚C prior to PCR for best preservation[17].
Toxoplasma and Pneumocystis qPCR assays
TheToxoplasma qPCR targeted the ‘rep529’ sequence (AF146527) and was performed as
described by Reischl et al. [18]. ThePneumocystis qPCR targeted the major surface
glycopro-tein gene (AF372980) and was performed as described by Fillaux et al.[19]. We used LC4801 Probe Master 2X (Roche1) for both qPCR and Uracil-N-Glycosylase (Roche1) for Toxo-plasma qPCR. Each PCR well contained 15 μL of mix and 5 μL of DNA extract for ToxoToxo-plasma
qPCR and 18μL of mix and 2 μL of DNA extract for Pneumocystis qPCR. Amplification and detection occurred in LightCycler1 480 (Roche) and raw fluorescence data were analysed using the LightCycler1 480 software release 1.5.0 (Roche). Cycles of positivity were deter-mined by the second derivative method.
PCR controls and definition of inhibition
Each PCR plate contained one well for negative control (sterile water) and one for positive con-trol (calibrated positive sample). Cp values of positive plate concon-trols were plotted into Levey-Jennings charts and interpreted according to the Westgard rules[20]. DNA extraction control was performed in routine practice by qPCR targeting the human albumin gene[21]. Amplifica-tion controls were made of reacAmplifica-tion wells containing pathogen DNA on top of the patient DNA extract. For theToxoplasma qPCR assay, this pathogen-specific amplification positive control
was prepared from a 105T. gondii tachyzoites/mL freeze-dried standard as described in
Varlet-Marie et al. [22]; 2μL of T. gondii DNA extract were added to obtain a final concentration of 1.5
T. gondii genome/tube for which the expected Cp value is 35.2 ±1.5. The control was performed
in duplicate. A sample was considered inhibited if both amplification control wells showed a Cp>38. If only one well showed a Cp>38, we considered this as irrelevant and due to stochastic events. ForPneumocystis-qPCR, the amplification control was made of the pathogen target
DNA sequence, which had been cloned into pGEM-T easy1. Plasmid DNA maxipreparation (Qiagen Maxiprep1) was then diluted in order to reach a Cp of 30.1±1.2, and 1 μL of this dilu-tion was added to the reacdilu-tion tube. APneumocystis-qPCR reaction was considered inhibited if
the Cp difference between amplification control and the positive plate control was �3. In this study, qPCR was considered as inhibited if the difference between the Cp of albumin-qPCR (Cpalb) obtained for a sample and the mean Cpalbfor the matrix considered was �3.
Data management
PCR results and bio-clinical data were exported from LightCycler1 480 release 1.5.0 software (Roche1) and DxLab1 software (MedaSys1) respectively, to spreadsheets (S1andS2Figs).
Determination of the PCR efficiencies
PCR efficiencies of the techniques were determined using a standard curve generated by per-forming a logarithmic serial dilution of DNA extracts. The standard curves demonstrating a linear relationship between the logarithm of the copy number and the Cp value, allows to determine the PCR efficiency using: Efficiency = -1+10exp(-1/slope) [23].
Statistics
Data were analyzed using R 3.4.0 and RStudio 1.0.143 softwares [24,25]. We calculated the Youden’s index considering the pathogen-specific amplification control as the reference method to detect PCR inhibition. The Youden’s index combines sensitivity and specificity into a single measure (Sensitivity + Specificity– 1) and its value ranges between -1 and 1. A value of 1 indicates that there are neither false positive nor false negative results. The best Cpalbcut-off
values of albumin-qPCR to detect inhibition were defined using the Youden’s index. Sensitivi-ties and specificiSensitivi-ties of these Cpalbcut-offs were next compared by binomial tests to the 95%
theoretical value in order to assess their inferiority. Correlation of Cpalbto leucocyte counts
was assessed using Spearman’s rank correlation. Holm correction was performed for all the tests. Samples without Cpalbvalue due to a flat amplification curve were excluded from the
graph and the correlation. A p value <0.05 was considered as significant.
Ethical approval and informed consent
This work was carried out in accordance with the relevant guidelines and regulations; it does not include potentially identifying patient/participant information. The study corresponds to a non-interventional retrospective study and according to the French Health Public Law (CSP Art L1121-1.1), such studies are exempt from informed consent requirement and do not require approval by an ethics committee.
Results and discussion
General description
The Dept. of Parasitology-Mycology is a regional and national reference centre which coordi-nates the "Molecular biology pole" of the National Reference Center for Toxoplasmosis (http:// cnrtoxoplasmose.chu-reims.fr). The laboratory is accredited according to ISO 15189:2012 for theToxoplasma and Pneumocystis PCR assays. The Toxoplasma-qPCR assay is being used in
routine since July 2009, >17000 clinical samples have been routinely tested, and PCR effi-ciency is regularly controlled and found at �97.5% [18]. For thePneumocystis-qPCR assay, the
corresponding features are March 2013, >2500, and 90±9%. PCR efficiency of the albumin qPCR was 98.5% (Fig 1). These laboratory-developed qPCR assays may therefore be consid-ered as robust and finely optimized.
During the year 2016, 3152 samples were referred to the laboratory as part of the routine activity (Fig 2): 2225 samples were analysed byToxoplasma-qPCR, 964 by
Pneumocystis-qPCR, and 37 samples were analysed by both methods (S1 Table). Two samples analysed by
Toxoplasma-qPCR were excluded from this study, one due to cancellation of the analysis and
another due to identity problem (S1andS2Figs). MostToxoplasma-qPCR analysed samples
were blood samples (1874 out of 2225), followed by 95 CSF and 114 postnatal samples
(Table 1). NoPneumocystis-qPCR samples had to be excluded from the analysis; the 964 Pneu-mocystis-qPCR samples comprised 787 BALF and 141 sputa samples (Table 1). The percentage of positive samples for theToxoplasma-qPCR was 1.7%, ranging from 0.3% for the blood to
12% for the amniotic fluid samples. ForPneumocystis-qPCR, the percentage of positive sample
was 7.1% (Table 1).
Inhibition rates in clinical samples as assessed from the pathogen-specific
amplification control
Of the 3152 analysed samples, 62 (2.0%) showed evidence of PCR inhibition as assessed from the pathogen-specific amplification control: 45 samples forToxoplasma-qPCR and 17 for
Pneumocystis-qPCR (Fig 2). However, this percentage varied from 1.8–15% depending on the matrix (Table 1). In 61/62 inhibited samples, tenfold dilution of the DNA extract released inhi-bition, confirming that the unexpected Cp values were due to PCR inhibitors. The remaining sample was a cord blood tested for the presence ofToxoplasma for which PCR remained Fig 1. PCR efficiencies. A. LightCycler real-time PCR amplification curves in a serial dilution assay. B-D. PCR efficiencies were determined in triplicate in two/three independent experiments. PCRs were performed in triplicate on five/six samples representing a 10-fold serial dilution. All standard curves demonstrated a linear relationship between the logarithm of the copy number and the Cp value, allowing determining the PCR Efficiency using: Efficiency = -1+10exp(-1/slope).
https://doi.org/10.1371/journal.pone.0219276.g001
Fig 2. Venn diagram of number of analyzed samples. Inhibited samples: Samples were considered inhibited if the Cp of the pathogen-specific control was >38 for both wells forToxoplasma-PCR (N = 45), and if ΔCp �3 for
Pneumocystis-PCR (N = 17). Cp(albumin)>threshold: For albumin-PCR, the inhibition threshold was the mean Cpalb
+ 3 for a given matrix (seeMethodsandTable 1).
inhibited despite the dilution, showing flat amplification curves for both the target- and the albumin-specific inhibition controls before and after tenfold dilution. No additional dilution was applied to this sample due to the risk of reduced sensitivity. Interestingly, blood samples, which are reported elsewhere [26] to be prone to PCR inhibition did not exhibit the highest inhibition rate in our study. Samples like sputum or placenta were also prone to PCR inhibition, probably because it is difficult to optimize a DNA extraction protocol for heterogeneous matrixes with highly different structures and properties from one sample to another. Using a similar pathogen-specific control method to detect PCR inhibitors in BALF samples, Do¨skaya
et al. found a 23.8% inhibition rate for Pneumocystis PCR [5] but a large study of Buckwalter
et al. reported inhibition rates under 1% on 386,706 samples [4]. These discrepant results illus-trate that PCR inhibition measurement is a problem of variable importance in routine practices, probably depending on the ability of extraction methods to remove inhibitors, on the suscepti-bility of PCR methods to inhibitors and on the performance of PCR inhibition detection.
Performances of PCR inhibition detection using albumin-qPCR
409/3152 samples (12.9%) exhibited a Cpalbabove the threshold,i.e. above the mean Cp for the
matrix concerned + 3 (Table 1). Thus, (i) the albumin-qPCR identified many more samples as
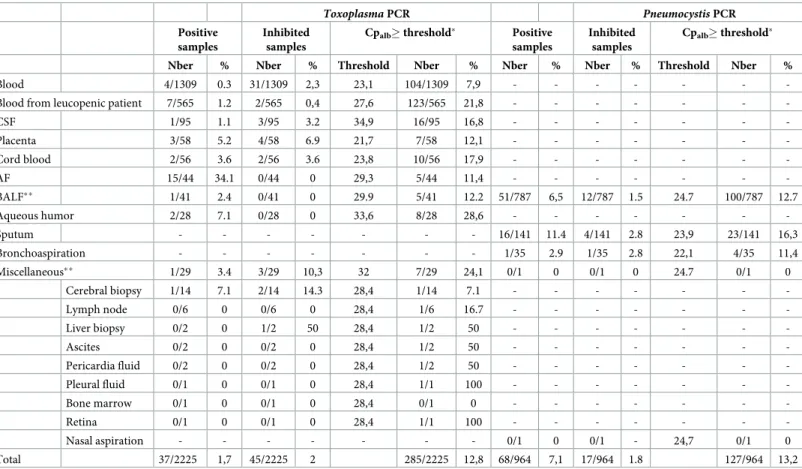
Table 1. Frequency of PCR inhibition as a function of sample matrix forToxoplasma PCR and Pneumocystis PCR.
Toxoplasma PCR Pneumocystis PCR
Positive samples
Inhibited samples
Cpalb� threshold� Positive
samples
Inhibited samples
Cpalb� threshold�
Nber % Nber % Threshold Nber % Nber % Nber % Threshold Nber %
Blood 4/1309 0.3 31/1309 2,3 23,1 104/1309 7,9 - - -
-Blood from leucopenic patient 7/565 1.2 2/565 0,4 27,6 123/565 21,8 - - -
-CSF 1/95 1.1 3/95 3.2 34,9 16/95 16,8 - - - -Placenta 3/58 5.2 4/58 6.9 21,7 7/58 12,1 - - - -Cord blood 2/56 3.6 2/56 3.6 23,8 10/56 17,9 - - - -AF 15/44 34.1 0/44 0 29,3 5/44 11,4 - - - -BALF�� 1/41 2.4 0/41 0 29.9 5/41 12.2 51/787 6,5 12/787 1.5 24.7 100/787 12.7 Aqueous humor 2/28 7.1 0/28 0 33,6 8/28 28,6 - - - -Sputum - - - 16/141 11.4 4/141 2.8 23,9 23/141 16,3 Bronchoaspiration - - - 1/35 2.9 1/35 2.8 22,1 4/35 11,4 Miscellaneous�� 1/29 3.4 3/29 10,3 32 7/29 24,1 0/1 0 0/1 0 24.7 0/1 0 Cerebral biopsy 1/14 7.1 2/14 14.3 28,4 1/14 7.1 - - - -Lymph node 0/6 0 0/6 0 28,4 1/6 16.7 - - - -Liver biopsy 0/2 0 1/2 50 28,4 1/2 50 - - - -Ascites 0/2 0 0/2 0 28,4 1/2 50 - - - -Pericardia fluid 0/2 0 0/2 0 28,4 1/2 50 - - - -Pleural fluid 0/1 0 0/1 0 28,4 1/1 100 - - - -Bone marrow 0/1 0 0/1 0 28,4 0/1 0 - - - -Retina 0/1 0 0/1 0 28,4 1/1 100 - - - -Nasal aspiration - - - 0/1 0 0/1 - 24,7 0/1 0 Total 37/2225 1,7 45/2225 2 285/2225 12,8 68/964 7,1 17/964 1.8 127/964 13,2
CSF: cerebrospinal fluid; AF: amniotic fluid (including external quality assessment samples); BALF: bronchoalveolar lavage fluid. Samples were considered inhibited if Cp of amplification controls was >38 for both amplification control wells forToxoplasma PCR, and if ΔCp was �3 for Pneumocystis PCR
�threshold = mean Cp + 3
��forToxoplasma and Pneumocystis PCR respectively, 37 BALF samples were analysed by both methods (for details, seeMethods). https://doi.org/10.1371/journal.pone.0219276.t001
containing inhibitors than the pathogen-specific controls, and this was so in both qPCR assays,
i.e. 285 vs. 45 for the Toxoplasma assay, and 127 vs. 17 for the Pneumocystis assay. In addition,
(ii) it is noteworthy that only 13 and 3 samples were detected as inhibited using both inhibitor-detection methods, for theToxoplasma and Pneumocystis assays, respectively (Fig 2). We therefore conclude that (i) the human gene-based qPCR detected inhibitors much more often than the pathogen-specific qPCR and (ii) it most often did not detect them correctly. Consid-ering this poor correlation between pathogen-specific controls and albumin qPCR to detect PCR inhibitors, we wished to determine Cpalbthresholds more adapted to our assays. To do
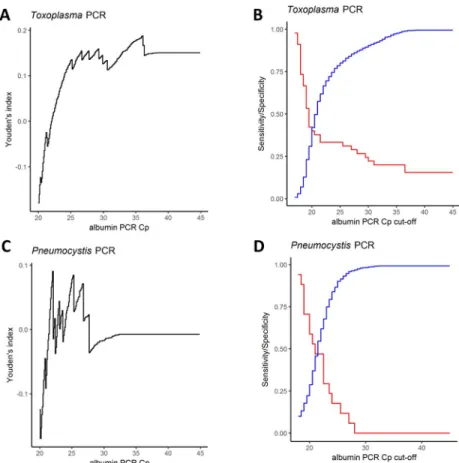
so, we calculated the sensitivity, specificity of the albumin qPCR to detect PCR-inhibiting sam-ples using the pathogen-specific control as reference and the Youden’s index (Sensitivity + Specificity– 1) and we varied the Cpalbthreshold (seeMethodsandFig 3A). We could not
determine a Cpalbthreshold allowing to obtain 95% sensitivity and 95% specificity (Fig 3B),
whether this strategy was used for all matrixes together or for each type of matrix (S3andS4
Figs). We therefore concluded that no Cpalbcut-off values can be determined to efficiently
detect pathogen-specific inhibitions for both pathogen-specific PCR assays. To check the
Fig 3. Youden’s index, sensitivity and specificity of albumin-PCR cut-off values. A and C. Black curves: Youden’s index = sensitivity + specificity– 1; B and D. Red curves: sensitivity; blue curves: specificity. ForToxoplasma qPCR (A),
the maximal Youden’s index was very low. The maximum value was 0.19 and was reached for a Cpalbcut-off value of
36. At this albumin qPCR cut-off value sensitivity is 20% (p< 0.0001; Binomial test for 95% theoretical sensitivity) and specificity 98.8% (p = 1, Binomial test for 95% theoretical specificity). (B) Graphical analysis of sensitivity and specificity curves in function of cut-off values. Both curves intersect at a Cpalbvalue of 22. At this Cpalbcut-off value
sensitivity is 33.3% and specificity 66.6% (p<0.0001 and p<0.0001; Binomial tests for 95% theoretical sensitivity and specificity). ForPneumocystis qPCR (C), the maximal Youden’s index was too low to allow determining any Cpalb
cut-off value. (D) Graphical profiles of sensitivity and curves in function of cut-cut-off values. Both curves intersect at a Cpalb
value of 22. At this Cpalbcut-off value sensitivity is 47.1% and specificity 62% (p<0.0001 and p<0.0001; Binomial tests
for 95% theoretical sensitivity and specificity).
influence of the cellularity of clinical samples on Cpalbvalues, we compared white blood cell
counts to albumin qPCR results for blood samples. We analysed 1690/1874 blood samples; the remaining 184 samples were excluded from the analysis due to the absence of whole blood cell count on the same day asToxoplasma-PCR. Cpalbvalues were correlated to leucocyte counts
(p<0.0001; Spearman’s rank correlation), but for a given white blood cell count a large range of Cpalbwas observed (Fig 4). The lack of sensitivity and specificity of albumin PCR to detect
target specific inhibitions may be explained by a differential susceptibility of each qPCR assay to inhibitors and by the variable quantity of human DNA in clinical samples. These results pre-vent using human gene-based PCR,e.g. albumin, betaglobin or human RNase P genes, as PCR
inhibition detection method. We based our demonstration on two models,i.e. Toxoplasma
andPneumocystis but these results should be expanded to the detection of other pathogens in
human samples.
Another widely used method to search for inhibitors is the use of commercial “universal” controls. These commercial controls are made of exogenous DNA and are added either in the
Fig 4. Correlation between leucocyte counts and Cpalbvalues in 1690 blood samples. Semi-log scale graph where leucocyte count (x-axis) was plotted against Cpalb(orange and green dots corresponding to amplification control
inhibited and not inhibited samples respectively). Linear model was used to determine trend line (Blue) with 95% confidence interval (Grey).
sample before extraction or with the DNA extract in the PCR mix. Differential susceptibility to inhibitors and efficiency discrepancies between PCR assays should also prove problematic in this approach. Indeed, the size and GC rate of the amplicons of the foreign DNA used will have an impact on the detection of the inhibition [13]. So, implementation of one of these con-trols should be avoided until their performances have been assessed in routine practice.
In conclusion, pathogen-specific amplification controls appear to be a method of choice for screening the presence of inhibitors in a PCR assay for infectious diseases as compared to the use of a human gene-based qPCR.
Supporting information
S1 Table. Spreadsheet of raw data.
(XLSX)
S1 Fig. Flow chart of data cleaning and tidying ofToxoplasma PCR results.
(DOCX)
S2 Fig. Flow chart of data cleaning and tidying ofPneumocystis PCR results.
(DOCX)
S3 Fig. Youden’s index, sensitivity and specificity of albumin PCR cut-off values for the most frequent matrixes analysed inToxoplasma PCR.
(DOCX)
S4 Fig. Youden’s index, sensitivity and specificity of albumin PCR cut-off values for the most frequent matrixes analysed inPneumocystis PCR.
(DOCX)
Acknowledgments
We are grateful to S. Douzou, B. Sanichanh and G. Serres for their technical help.
Author Contributions
Conceptualization: Yvon Sterkers. Data curation: Guillaume Roux.
Formal analysis: Guillaume Roux, Christophe Ravel, Yvon Sterkers. Funding acquisition: Patrick Bastien, Yvon Sterkers.
Investigation: Guillaume Roux, Rachel Jendrowiak. Methodology: Yvon Sterkers.
Project administration: Yvon Sterkers.
Resources: Emmanuelle Varlet-Marie, Rachel Jendrowiak, Yvon Sterkers. Supervision: Yvon Sterkers.
Validation: Yvon Sterkers. Visualization: Yvon Sterkers.
Writing – original draft: Guillaume Roux, Yvon Sterkers.
References
1. Hedman J, Radstrom P. Overcoming inhibition in real-time diagnostic PCR. Methods Mol Biol. 2013; 943:17–48. Epub 2012/10/30.https://doi.org/10.1007/978-1-60327-353-4_2PMID:23104280. 2. Wallace PS, MacKay WG. Quality in the molecular microbiology laboratory. Methods Mol Biol. 2013;
943:49–79. Epub 2012/10/30.https://doi.org/10.1007/978-1-60327-353-4_3PMID:23104281. 3. Schrader C, Schielke A, Ellerbroek L, Johne R. PCR inhibitors—occurrence, properties and removal. J
Appl Microbiol. 2012; 113(5):1014–26. Epub 2012/07/04.https://doi.org/10.1111/j.1365-2672.2012. 05384.xPMID:22747964.
4. Buckwalter SP, Sloan LM, Cunningham SA, Espy MJ, Uhl JR, Jones MF, et al. Inhibition controls for qualitative real-time PCR assays: are they necessary for all specimen matrices? J Clin Microbiol. 2014; 52(6):2139–43. Epub 2014/04/18.https://doi.org/10.1128/JCM.03389-13PMID:24740078; PubMed Central PMCID: PMC4042775.
5. Doskaya M, Caner A, Degirmenci A, Wengenack NL, Yolasigmaz A, Turgay N, et al. Degree and fre-quency of inhibition in a routine real-time PCR detecting Pneumocystis jirovecii for the diagnosis of Pneumocystis pneumonia in Turkey. J Med Microbiol. 2011; 60(Pt 7):937–44. Epub 2011/04/05.https:// doi.org/10.1099/jmm.0.030775-0PMID:21459903.
6. Bustin SA, Beaulieu JF, Huggett J, Jaggi R, Kibenge FS, Olsvik PA, et al. MIQE precis: Practical imple-mentation of minimum standard guidelines for fluorescence-based quantitative real-time PCR experi-ments. BMC Mol Biol. 11. England2010. p. 74.
7. Sterkers Y, Varlet-Marie E, Marty P, Bastien P. Diversity and evolution of methods and practices for the molecular diagnosis of congenital toxoplasmosis in France: a 4-year survey. Clin Microbiol Infect. 2010; 16(10):1594–602.https://doi.org/10.1111/j.1469-0691.2009.03101.xPMID:19886905.
8. Rosenstraus M, Wang Z, Chang SY, DeBonville D, Spadoro JP. An internal control for routine diagnos-tic PCR: design, properties, and effect on clinical performance. J Clin Microbiol. 1998; 36(1):191–7. Epub 1998/02/12. PMID:9431945; PubMed Central PMCID: PMC124832.
9. Maaroufi Y, de Bruyne JM, Duchateau V, Scheen R, Crokaert F. Development of a multiple internal con-trol for clinical diagnostic real-time amplification assays. FEMS Immunol Med Microbiol. 2006; 48 (2):183–91. Epub 2006/10/27.https://doi.org/10.1111/j.1574-695X.2006.00125.xPMID:17064275. 10. Brenier-Pinchart MP, Morand-Bui V, Fricker-Hidalgo H, Equy V, Marlu R, Pelloux H. Adapting a
conven-tional PCR assay for Toxoplasma gondii detection to real-time quantitative PCR including a competitive internal control. Parasite. 2007; 14(2):149–54. Epub 2007/07/25.https://doi.org/10.1051/parasite/ 2007142149PMID:17645187.
11. Daval S, Poirier P, Armenaud J, Cambon M, Livrelli V. [Development of a real-time PCR assay for quan-titative diagnosis of Toxoplasma gondii after allogeneic bone marrow transplantation]. Pathol Biol (Paris). 2010; 58(1):104–9. Epub 2009/11/07.https://doi.org/10.1016/j.patbio.2009.07.013PMID:
19892493
12. Huggett JF, Novak T, Garson JA, Green C, Morris-Jones SD, Miller RF, et al. Differential susceptibility of PCR reactions to inhibitors: an important and unrecognised phenomenon. BMC Res Notes. 2008; 1:70. Epub 2008/08/30.https://doi.org/10.1186/1756-0500-1-70PMID:18755023; PubMed Central PMCID: PMC2564953.
13. Pionzio AM, McCord BR. The effect of internal control sequence and length on the response to PCR inhibition in real-time PCR quantitation. Forensic Sci Int Genet. 2014; 9:55–60. Epub 2014/02/18.
https://doi.org/10.1016/j.fsigen.2013.10.010PMID:24528580.
14. Chabbert E, Lachaud L, Crobu L, Bastien P. Comparison of two widely used PCR primer systems for detection of toxoplasma in amniotic fluid, blood, and tissues. J Clin Microbiol. 2004; 42(4):1719–22. 173.https://doi.org/10.1128/JCM.42.4.1719-1722.2004PMID:15071031
15. Hohlfeld P, Daffos F, Costa JM, Thulliez P, Forestier F, Vidaud M. Prenatal diagnosis of congenital toxo-plasmosis with a polymerase-chain-reaction test on amniotic fluid. N Engl J Med. 1994; 331(11):695–9. Epub 1994/09/15.https://doi.org/10.1056/NEJM199409153311102PMID:8058075.
16. Sterkers Y, Pratlong F, Albaba S, Loubersac J, Picot MC, Pretet V, et al. Novel interpretation of molecu-lar diagnosis of congenital toxoplasmosis according to gestational age at the time of maternal infection. J Clin Microbiol. 2012; 50(12):3944–51. Epub 2012/10/05.https://doi.org/10.1128/JCM.00918-12
PMID:23035201; PubMed Central PMCID: PMC3502944.
17. Delhaes L, Filisetti D, Brenier-Pinchart MP, Pelloux H, Yera H, Dalle F, et al. Freezing and storage at -20 degrees C provides adequate preservation of Toxoplasma gondii DNA for retrospective molecular analysis. Diagn Microbiol Infect Dis. 2014; 80(3):197–9. Epub 2014/09/23.https://doi.org/10.1016/j. diagmicrobio.2014.08.007PMID:25241642.
18. Reischl U, Bretagne S, Kruger D, Ernault P, Costa JM. Comparison of two DNA targets for the diagnosis of Toxoplasmosis by real-time PCR using fluorescence resonance energy transfer hybridization probes.
BMC Infect Dis. 2003; 3:7. Epub 2003/05/06.https://doi.org/10.1186/1471-2334-3-7PMID:12729464; PubMed Central PMCID: PMC156600.
19. Fillaux J, Berry A. Real-time PCR assay for the diagnosis of Pneumocystis jirovecii pneumonia. Meth-ods Mol Biol. 2013; 943:159–70. Epub 2012/10/30.https://doi.org/10.1007/978-1-60327-353-4_11
PMID:23104289.
20. Westgard JO, Barry PL, Hunt MR, Groth T. A multi-rule Shewhart chart for quality control in clinical chemistry. Clin Chem. 1981; 27(3):493–501. Epub 1981/03/01. PMID:7471403.
21. Mary C, Faraut F, Lascombe L, Dumon H. Quantification of Leishmania infantum DNA by a real-time PCR assay with high sensitivity. J Clin Microbiol. 2004; 42(11):5249–55. Epub 2004/11/06.https://doi. org/10.1128/JCM.42.11.5249-5255.2004PMID:15528722; PubMed Central PMCID: PMC525214. 22. Varlet-Marie E, Sterkers Y, Brenier-Pinchart MP, Cassaing S, Dalle F, Delhaes L, et al. Characterization
and multicentric validation of a common standard for Toxoplasma gondii detection using nucleic acid amplification assays. J Clin Microbiol. 2014; 52(11):3952–9. Epub 2014/09/05.https://doi.org/10.1128/ JCM.01906-14PMID:25187637; PubMed Central PMCID: PMC4313224.
23. Kralik P, Ricchi M. A Basic Guide to Real Time PCR in Microbial Diagnostics: Definitions, Parameters, and Everything. Front Microbiol. 2017; 8:108. Epub 2017/02/18.https://doi.org/10.3389/fmicb.2017. 00108PMID:28210243; PubMed Central PMCID: PMC5288344.
24. RCore-Team. R: a language and environment for statistical computing: R Foundation for Statistical Computing, Vienna, Austria.; 2017. Available from:https://www.R-project.org.
25. RStudio-Team. R Studio: Integrated Development for R.: RStudio, Inc., Boston, MA; 2015. Available from:http://www.rstudio.com.
26. Al-Soud WA, Radstrom P. Purification and characterization of PCR-inhibitory components in blood cells. J Clin Microbiol. 2001; 39(2):485–93. Epub 2001/02/07. https://doi.org/10.1128/JCM.39.2.485-493.2001PMID:11158094; PubMed Central PMCID: PMC87763.