HAL Id: halshs-00828418
https://halshs.archives-ouvertes.fr/halshs-00828418
Submitted on 31 May 2013
HAL is a multi-disciplinary open access
archive for the deposit and dissemination of sci-entific research documents, whether they are pub-lished or not. The documents may come from teaching and research institutions in France or
L’archive ouverte pluridisciplinaire HAL, est destinée au dépôt et à la diffusion de documents scientifiques de niveau recherche, publiés ou non, émanant des établissements d’enseignement et de recherche français ou étrangers, des laboratoires
When do textbooks matter for achievement? Evidence
from African primary schools
Maria Kuecken, Marie-Anne Valfort
To cite this version:
Maria Kuecken, Marie-Anne Valfort. When do textbooks matter for achievement?
Evi-dence from African primary schools. Economics Letters, Elsevier, 2013, 119 (3), pp.311-315.
When do textbooks matter for achievement? Evidence
from African primary schools
Maria Kuecken
∗Marie-Anne Valfort
†March 5, 2013
Abstract
Using a within-student analysis, we find no average impact of textbook access (ownership or sharing) on primary school achievement. Instead, it is only for students with high socioeconomic status that one form of textbook access – sharing – has a positive impact.
Keywords: Textbooks, Educational quality, Sub-Saharan Africa, SACMEQ JEL: A12, I21, N37
∗Paris School of Economics - Paris 1 Panth´eon Sorbonne University. 106-112, Boulevard de l’Hˆopital.
75013 Paris. France. E-mail: [email protected].
†Corresponding author. Paris School of Economics - Paris 1 Panth´eon Sorbonne University. 106-112,
Boulevard de l’Hˆopital. 75013 Paris. France. E-mail: [email protected]. Phone: 33(0)1 44 07 81 94.
1
Introduction
Improving access to textbooks via ownership or sharing seems an obvious way to increase student achievement in African countries where resources are particularly limited. Ret-rospective studies of both Francophone and Anglophone African countries find significant positive correlations between access to textbooks and student test scores in both reading and mathematics.1 However, such analyses are at risk from bias due to omitted variables that may influence both textbook access and educational outcomes. Alternatively, random-ized experiments have allowed researchers to avoid such endogeneity biases and isolate the impact of schooling inputs on learning outcomes. Glewwe, Kremer and Moulin (2009) an-alyze the only randomized experiment conducted in Africa that focuses on the impact of textbook access, specifically sharing, on pupils’ achievement. They find that, due in part to overly-ambitious curricula not suited for the average student, textbook sharing in Kenya improves test scores only for those students who were already high achievers prior to the intervention.2
Our paper aims to improve upon this result in two ways. First, we do not restrict our attention to the impact of textbook sharing alone. Instead, we expand our analysis to include textbook ownership as these two forms of textbook access are expected to create differential effects. For instance, Fr¨olich and Michaelowa (2011) demonstrate, based on African data, that textbook sharing is associated with positive externalities (notably through knowledge sharing) which simple textbook ownership does not allow. Second, instead of relying on only one African country, we cover eleven Sub-Saharan African countries from the second round of the Southern and Eastern African Consortium for Monitoring Educational Quality (SACMEQ) survey from 2005.3 Our identification strategy treats endogeneity through a
within-student analysis (across subject rather than across time). Doing so ensures that there are no unobserved student characteristics which are correlated with both textbook access and
1For evidence that is both recent and comprehensive, see Fehrler, Michaelowa and Wechtler (2009). 2This finding contrasts with the results by Jamison, Searle, Galda and Heyneman (1981). Relying on a
randomized experiment in Nicaragua, these authors show that allocating a textbook to each student improves mathematics test scores by one-third of a standard deviation on average. This diverging conclusion may be due to the fact that the curriculum is less ambitious in Nicaragua than in Kenya. Moreover, the average student in Nicaragua is better off than her Kenyan counterpart. Because she faces lower barriers to learning, textbook access may have a greater positive impact on her achievement. The same reasoning applies to Hungi (2008) who shows that textbook ownership positively impacts test scores in math and reading in Vietnam as well as to Tan, Lan and Lassibille (1999) who demonstrate that providing teachers with learning materials leads to a significant decline in dropout rates in the Philippines.
3These include Botswana, Lesotho, Kenya, Malawi, Mozambique, Namibia, Seychelles, Swaziland,
Tan-zania, Uganda, and Zambia. We are forced to exclude Mauritius and South Africa as they report no test scores for teachers, a crucial control variable.
achievement, at least when these unobservables remain constant across subjects.4 Moreover, with a rich set of controls at the teacher level, we mitigate the possibility of unobserved teacher characteristics being correlated with both textbook access and test scores.
2
Data
The SACMEQ II survey administers questionnaires and standardized reading and mathe-matics examinations to both students and teachers to compare cross-country achievement in the final year of primary school. We measure achievement with the scores obtained by students on standardized tests in reading and mathematics. For textbook access we use an indicator variable which is equal to 1 if a student has access to a textbook in mathematics or reading (whether via ownership or sharing) and 0 if a student has no access to a textbook. We then disaggregate this variable into two dummies: one that is equal to 1 if a student owns a textbook (and 0 if a student has no access to a textbook) and another that is is equal to 1 if a student shares a textbook (and 0 if a student has no access to a textbook). We do so in order to examine the potentially different effects of textbook ownership versus sharing. Glewwe, Kremer and Moulin (2009) find that textbook access in Kenya improves test scores only for those students who were already high achievers before receiving textbook access. Yet, socioeconomic status is known to be an excellent predictor of academic ability. In Sub-Saharan Africa for instance, Lee, Zuze and Ross (2005) find that a pupil with a high SES strongly outperforms her low SES counterparts. We therefore test, later in the analysis, whether textbook access may make a significant difference only for students from the most privileged backgrounds. We do so by interacting our indicators for textbook access with student socioeconomic status, a proxy derived from an average of 14 home posses-sions (a newspaper, magazine, radio, television, VCR, cassette, telephone, refrigerator, car, motorcycle, bicycle, water, electricity, and table) present in each student’s household.
When we run the within-student analysis, we need control only for the variables that vary across subjects. Regarding teachers, we account for sex (using an indicator for females), age, and highest level of academic qualification obtained (with dummy variables for primary, ju-nior secondary, seju-nior secondary, and A-level/tertiary). To control for characteristics related to teaching competency and practices, we use the raw teacher test scores in math and reading
4To be sure, a student fixed effect approach does not allow us to control for students’ subject-specific
propensities for achievement. Yet, this potential endogeneity problem is expected to be weak given that our data reveal a very strong correlation (equal to 76%) between students’ achievements across subjects. This correlation suggests that students’ unobserved propensities for achievement are constant across subjects rather than subject-specific.
(with maximum scores of 41 and 47 respectively) as well as the frequency with which they correct homework (never, sometimes, always), importance they assign to encouraging their students (not important, of some importance, very important), and frequency with which they assess their students (no test, once per year, once per term, 2-3 times per term, 2-3 times per month, once or more per week). Additionally, we include a set of dummy variables for the presence of specific classroom resources (such as writing board, chalk, wall chart, cup-board or locker, one or more bookshelves, classroom library or book corner, teacher table, and teacher chair). Summary statistics for all variables can be found in Table A1.
3
Empirical strategy and results
Because, for each student, SACMEQ reports pairs of test scores in both math and reading, we are able to exploit these matched pairs by running a within-student analysis similar to Dee (2007), Aslam and Kingdon (2011) and Cho (2012). This analysis allows us to control for student fixed effects that are constant across subjects. Moreover, thanks to a comprehensive set of controls at the teacher level, this approach reduces the possibility that unobserved teacher characteristics are correlated with both a student’s textbook access and their test scores. We begin with Equation (1):
Yij = ai+ b.BOOKij + c.MATH + X ′
j.d + ϵij (1)
where Yij represents the test score for student i in subject j. We run three estimations
in which the coefficient b associated with BOOK stands for the impact of textbook access, ownership, or sharing on the score of student i. We control for student (ai) and subject
(MATH) fixed effects, as well as for a vector of teacher traits (X′j). Finally, we include the mean-zero error term (ϵij) and cluster standard errors at the school level to account for
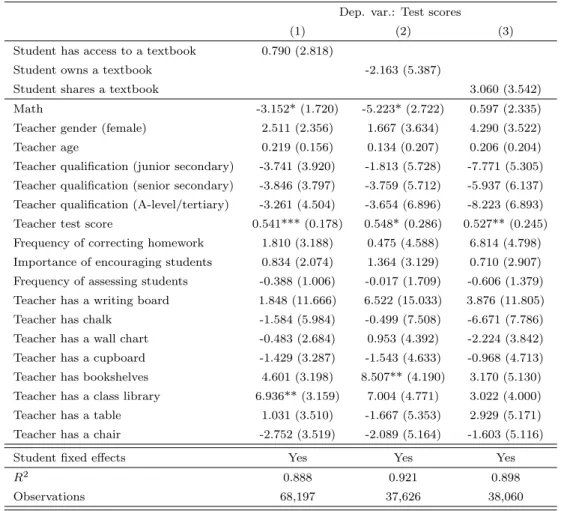
the undoubtedly similar variation amongst students from the same school. Table 1 presents the OLS estimates of Equation (1). We observe that neither textbook access, textbook ownership nor textbook sharing has a significant impact on students’ achievement. These results hold if we distinguish between the impact of textbook access in math versus reading. (Results available upon request).
However, it is possible that textbook access makes a significant difference only for students from the most privileged backgrounds due to severe constraints faced by poor students (such as hindered cognitive development, sporadic enrollment, low parent and teacher expectations,
and – particularly relevant for textbooks – elitist curriculum biases).5 We test for this possibility by adding to Equation (1) an interaction term between the indicators capturing textbook access and student SES, as proxied by average level of home possessions:
Yij = ai+ b.BOOKij + c.BOOK∗ijSESi+ d.MATH + X ′
j.e + ϵij (2)
Here, the coefficient of the interaction term BOOK∗ijSESi captures the differential impact of
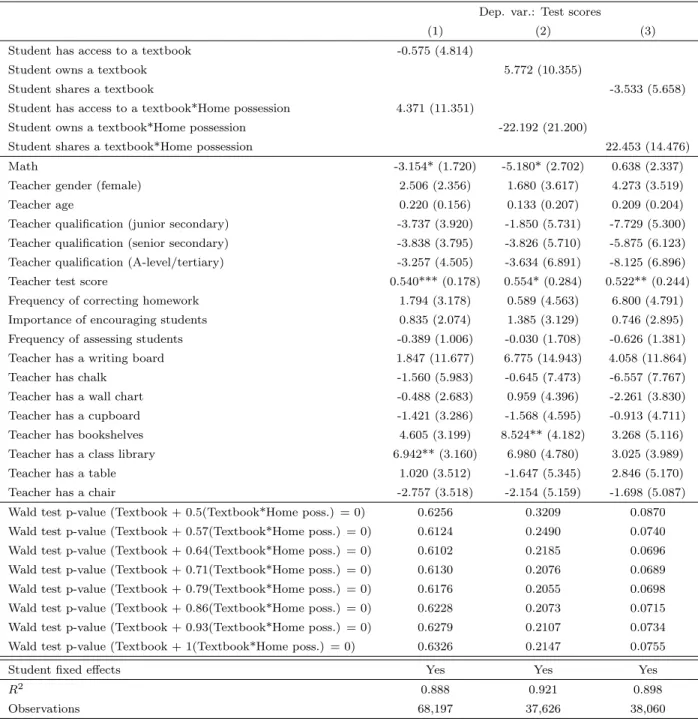
each textbook measure (access, ownership, or sharing) on a student’s test score according to their level of home possessions. We test which percentile of SES is significant by running a Wald test.6 If we consider the 71st percentile of home possessions for example, this Wald
test consists of computing whether the sum of the coefficient of BOOK and the level of home possessions corresponding to the 71st percentile (0.5) multiplied by the coefficient of
BOOK*SES is significantly different from 0.
OLS estimates of Equation (2) are reported in Table 2. They demonstrate that is it only for students belonging to the 71st percentile of SES and above that one form of textbook
access, textbook sharing, has a positive impact on achievement. The alternative textbook measures (access and ownership) have no effect at any level of student SES. This set of results holds if we distinguish between the impact of textbook access in math versus reading. (Results available upon request). In terms of magnitude, textbook sharing increases student test scores by a maximum of 0.20 standard deviations (the marginal effect obtained for students in the uppermost percentile of the SES distribution). When compared to other types of educational interventions, this impact is equivalent to that found from merit-based school vouchers (Kremer and Holla (2009)).
4
Conclusion
Relying on a within-student analysis, this paper aims to improve upon the representativeness of the results from Glewwe, Kremer and Moulin (2009) by (i) analyzing the impact of textbook ownership in addition to sharing and (ii) covering eleven Sub-Saharan African countries instead of one (Kenya). Our findings are consistent with theirs. We find no average impact of textbooks on student test scores although we identify a positive impact for a certain margin of students – those at the top of the socioeconomic distribution. Moreover,
5See Kuecken and Valfort (2012) for a discussion of these constraints.
6The levels-to-percentiles conversions are the following: 0 (1st), 0.07 (2nd), 0.14 (13th), 0.21 (25th), 0.29
(38th), 0.36 (52nd), 0.43 (63th), 0.5 (71st), 0.57 (77th), 0.64 (82nd), 0.71 (87th), 0.79 (92nd), 0.86 (95th), 0.93
(98th), 1 (100th).
this impact arises solely from textbook sharing. This result is consistent with the fact that sharing is associated with positive externalities via knowledge transfers, an effect that simple textbook ownership does not produce (see Fr¨olich and Michaelowa (2011)).
5
Acknowledgements
We thank Pierre Cahuc, Eric Strobl, and an anonymous reviewer for their very helpful comments.
References
[1] Aslam, Monazza and Geeta Kingdon. 2011. “What can teachers do to raise pupil achievement?” Economics of Education Review, 30(3): 559-574.
[2] Cho, Insook. 2012. “The effect of teacher-student gender matching: Evidence from OECD countries.” Economics of Education Review, 31(3): 54-67.
[3] Dee, Thomas S. 2007. “Teachers and the gender gaps in student achievement.” Journal of Human Resources, 42(3): 525-554.
[4] Fehrler, Sebastian, Katharina Michaelowa and Annika Wechtler. 2009. “The effective-ness of inputs in primary education: Insights from recent student surveys for Sub-Saharan Africa.” Journal of Development Studies, 45(9): 1545-1578.
[5] Fr¨olich, Markus and Katharina Michaelowa. 2011. “Peer effects and textbooks in African primary education.” Labour Economics, 18(4): 474-486.
[6] Glewwe, Paul, Michael Kremer and Sylvie Moulin. 2009. “Many Children Left Behind? Textbooks and Test Scores in Kenya.” American Economic Journal: Applied Economics, 1(1): 112-35.
[7] Hungi, Njora. 2008. “Examining differences in mathematics and reading achievement among grade 5 pupils in Vietnam.” Studies in Educational Evaluation, 34(3): 155-164.
[8] Jamison, Dean T., Barbara Searle, Klaus Galda and Stephen P. Heyneman. 1981. “Im-proving elementary mathematics education in Nicaragua: an experimental study of the impact of textbooks and radio on achievement.” Journal of Educational Psychology, 73(4): 556-567.
[9] Kremer, Michael and Alaka Holla. 2009. “Improving education in the developing world: what have we learned from randomized evaluations?” Annual Review of Economics, 1: 513-542.
[10] Kuecken, Maria and Marie-Anne Valfort. 2012. “Does teacher misbehavior prevent stu-dents from learning? Evidence from Sub-Saharan Africa.” Unpublished manuscript.
[11] Lee, Valerie E., Tia Linda Zuze and Kenneth N. Ross. 2005. “School effectiveness in 14 Sub-Saharan African countries: Links with 6th graders’ reading achievement.” Studies in Educational Evaluation, 31(2-3): 207-246.
[12] Tan, Jee-Peng, Julia Lane and Gerard Lassibille. 1999. “Student outcomes in Philippine elementary schools: An evaluation of four experiments.” World Bank Economic Review, 13(3): 493-508.
6
Tables
Table 1: Textbook access, ownership, or sharing and test scores: OLS results
Dep. var.: Test scores
(1) (2) (3) Student has access to a textbook 0.790 (2.818)
Student owns a textbook -2.163 (5.387)
Student shares a textbook 3.060 (3.542) Math -3.152* (1.720) -5.223* (2.722) 0.597 (2.335) Teacher gender (female) 2.511 (2.356) 1.667 (3.634) 4.290 (3.522) Teacher age 0.219 (0.156) 0.134 (0.207) 0.206 (0.204) Teacher qualification (junior secondary) -3.741 (3.920) -1.813 (5.728) -7.771 (5.305) Teacher qualification (senior secondary) -3.846 (3.797) -3.759 (5.712) -5.937 (6.137) Teacher qualification (A-level/tertiary) -3.261 (4.504) -3.654 (6.896) -8.223 (6.893) Teacher test score 0.541*** (0.178) 0.548* (0.286) 0.527** (0.245) Frequency of correcting homework 1.810 (3.188) 0.475 (4.588) 6.814 (4.798) Importance of encouraging students 0.834 (2.074) 1.364 (3.129) 0.710 (2.907) Frequency of assessing students -0.388 (1.006) -0.017 (1.709) -0.606 (1.379) Teacher has a writing board 1.848 (11.666) 6.522 (15.033) 3.876 (11.805) Teacher has chalk -1.584 (5.984) -0.499 (7.508) -6.671 (7.786) Teacher has a wall chart -0.483 (2.684) 0.953 (4.392) -2.224 (3.842) Teacher has a cupboard -1.429 (3.287) -1.543 (4.633) -0.968 (4.713) Teacher has bookshelves 4.601 (3.198) 8.507** (4.190) 3.170 (5.130) Teacher has a class library 6.936** (3.159) 7.004 (4.771) 3.022 (4.000) Teacher has a table 1.031 (3.510) -1.667 (5.353) 2.929 (5.171) Teacher has a chair -2.752 (3.519) -2.089 (5.164) -1.603 (5.116) Student fixed effects Yes Yes Yes
R2 0.888 0.921 0.898
Observations 68,197 37,626 38,060
Notes: This table reports OLS estimates for test scores. See main text for an explanation of controls. Standard
Table 2: Textbook access, ownership, or sharing according to SES level and test scores:
OLS results
Dep. var.: Test scores
(1) (2) (3)
Student has access to a textbook -0.575 (4.814)
Student owns a textbook 5.772 (10.355)
Student shares a textbook -3.533 (5.658) Student has access to a textbook*Home possession 4.371 (11.351)
Student owns a textbook*Home possession -22.192 (21.200)
Student shares a textbook*Home possession 22.453 (14.476) Math -3.154* (1.720) -5.180* (2.702) 0.638 (2.337) Teacher gender (female) 2.506 (2.356) 1.680 (3.617) 4.273 (3.519) Teacher age 0.220 (0.156) 0.133 (0.207) 0.209 (0.204) Teacher qualification (junior secondary) -3.737 (3.920) -1.850 (5.731) -7.729 (5.300) Teacher qualification (senior secondary) -3.838 (3.795) -3.826 (5.710) -5.875 (6.123) Teacher qualification (A-level/tertiary) -3.257 (4.505) -3.634 (6.891) -8.125 (6.896) Teacher test score 0.540*** (0.178) 0.554* (0.284) 0.522** (0.244) Frequency of correcting homework 1.794 (3.178) 0.589 (4.563) 6.800 (4.791) Importance of encouraging students 0.835 (2.074) 1.385 (3.129) 0.746 (2.895) Frequency of assessing students -0.389 (1.006) -0.030 (1.708) -0.626 (1.381) Teacher has a writing board 1.847 (11.677) 6.775 (14.943) 4.058 (11.864) Teacher has chalk -1.560 (5.983) -0.645 (7.473) -6.557 (7.767) Teacher has a wall chart -0.488 (2.683) 0.959 (4.396) -2.261 (3.830) Teacher has a cupboard -1.421 (3.286) -1.568 (4.595) -0.913 (4.711) Teacher has bookshelves 4.605 (3.199) 8.524** (4.182) 3.268 (5.116) Teacher has a class library 6.942** (3.160) 6.980 (4.780) 3.025 (3.989) Teacher has a table 1.020 (3.512) -1.647 (5.345) 2.846 (5.170) Teacher has a chair -2.757 (3.518) -2.154 (5.159) -1.698 (5.087) Wald test p-value (Textbook + 0.5(Textbook*Home poss.) = 0) 0.6256 0.3209 0.0870 Wald test p-value (Textbook + 0.57(Textbook*Home poss.) = 0) 0.6124 0.2490 0.0740 Wald test p-value (Textbook + 0.64(Textbook*Home poss.) = 0) 0.6102 0.2185 0.0696 Wald test p-value (Textbook + 0.71(Textbook*Home poss.) = 0) 0.6130 0.2076 0.0689 Wald test p-value (Textbook + 0.79(Textbook*Home poss.) = 0) 0.6176 0.2055 0.0698 Wald test p-value (Textbook + 0.86(Textbook*Home poss.) = 0) 0.6228 0.2073 0.0715 Wald test p-value (Textbook + 0.93(Textbook*Home poss.) = 0) 0.6279 0.2107 0.0734 Wald test p-value (Textbook + 1(Textbook*Home poss.) = 0) 0.6326 0.2147 0.0755
Student fixed effects Yes Yes Yes
R2 0.888 0.921 0.898
Observations 68,197 37,626 38,060
Notes: This table reports OLS estimates for test scores. See main text for an explanation of controls. Standard errors are clustered at the school
level. *, ** and *** indicate significance at the 10, 5 and 1% levels.