HAL Id: hal-01071373
https://hal.inria.fr/hal-01071373v2
Submitted on 26 Aug 2015
HAL is a multi-disciplinary open access
archive for the deposit and dissemination of
sci-entific research documents, whether they are
pub-lished or not. The documents may come from
teaching and research institutions in France or
abroad, or from public or private research centers.
L’archive ouverte pluridisciplinaire HAL, est
destinée au dépôt et à la diffusion de documents
scientifiques de niveau recherche, publiés ou non,
émanant des établissements d’enseignement et de
recherche français ou étrangers, des laboratoires
publics ou privés.
From network-level measurements to expected Quality
of Experience: the Skype use case
Thierry Spetebroot, Salim Afra, Nicolas Aguilera, Damien Saucez, Chadi
Barakat
To cite this version:
Thierry Spetebroot, Salim Afra, Nicolas Aguilera, Damien Saucez, Chadi Barakat.
From
network-level measurements to expected Quality of Experience: the Skype use case.
IEEE
In-ternational Workshop on Measurement and Networking (M&N), Oct 2015, Coimbra, Portugal.
�10.1109/IWMN.2015.7322989�. �hal-01071373v2�
From network-level measurements to expected
Quality of Experience: the Skype use case
Thierry Spetebroot
∗, Salim Afra
†, Nicol´as Aguilera
‡, Damien Saucez
∗, Chadi Barakat
∗∗Inria Sophia Antipolis – M´edit´erran´ee, email: {first.last}@inria.fr †University of Calgary, email: salim.afra@ucalgary.ca ‡NIC Chile Research Labs, email: nicolas@niclabs.cl
Abstract—Modern Internet applications rely on rich multime-dia contents making the quality of experience (QoE) of end users sensitive to network conditions. Several models were developed in the literature to express QoE as a function of measurements carried out on the traffic of the applications themselves. In this paper, we propose a new methodology based on machine learning able to link expected QoE to network and device level measurements outside the applications’ traffic. This direct linking to network and device level measurements is important for the prediction of QoE. We prove the feasibility of the approach in the context of Skype. In particular, we derive and validate a model to predict the Skype QoE as a function of easily measurable network performance metrics. One can see our methodology as a new way of performing measurements in the Internet, where instead of expressing the expected performance in terms of network and device level measurements that only specialists can understand, we express performance in clear terms related to expected quality of experience for different applications.
I. INTRODUCTION
The ubiquity of Internet changed the expectation end users have in terms of the quality of the Internet service. This has increased the pressure on network operators and service providers, more and more interested in capturing the Quality of Experience (QoE) of end users, rather than simply cap-turing the physical properties of their Internet access (e.g., bandwidth, delay, or loss rate). For example, a service provider cannot afford to wait for customers’ complaints as about 90% of users change their network provider when they undergo low service quality [1]. Therefore, it is essential that network operators and service providers have means to continually measure the QoE and improve it as necessary. The difficulty being that, as compared to Quality of Service (QoS) that can be measured without ambiguity, QoE is a subjective measure, driven by personal opinions, of end users’ satisfaction with the service they are getting from the network [2], [3].
End users are often equipped with measurement tools that monitor the physical performance of their Internet access (e.g., bandwidth, delay) [4], [5]. Despite the presence of specific QoE indicators in popular applications such as Skype [6] or Viber [7], there is no general solution for a fine-grained evaluation of the quality of Internet access in terms of QoE. A general solution to assess QoE would help end users and providers as on one hand it would provide end users an understandable feedback on the QoE they can expect, and on the another hand, it would give providers an invaluable
means to automatically assess the level of satisfaction of their customers and adapt their operations accordingly.
We propose a new methodology, based on controlled experi-ments, measurements and machine learning, for the estimation and prediction of the application-level QoE of end users at the Internet access. The approach we follow consists in transforming measurements of performance at the network and device level into understandable terms at the user level function of the quality the end user would expect for the applications of interest to her. For example, with our solution, an end user interested in a voice over IP application and/or a video streaming application will see an indication of the expected quality when running these two applications, rather than simple measurements of bandwidth and delay as is the current state of the art. The particularity of our approach is that predictions are obtained independently of the applications themselves and do not require the applications to be running. This property is essential in the network planning phase as it guides network architects to build a more efficient network, but also for end users that can know in advance the quality they would obtain for their applications, before starting them. The originality of our approach is twofold. First, we establish direct links between the subjective Quality of Experience (QoE) and the objective network and device level measurements carried out at the device of the end user (QoS). The measurements are mostly active measurements, i.e., bandwidth, delay, loss rate, but they can also be of passive type, i.e., signal strength, network technology. We use machine learning techniques to capture such links in the form of models for the QoE of different applications. Notwithstanding the previous work on using machine learning techniques for QoE modeling (see Sec. IV), this direct linking between network and device level measurements and QoE is novel. As a matter of fact, the link is usually established with measurements done within the application and on the data traffic of the application (e.g., losses and delay experienced by the packets of the application). The second property of our approach is its capacity to reuse the same network-level measurements for the estimation of the quality of different applications. Thanks to QoE models func-tion of network-level measurements, we are able to perform measurements once and feed them to different QoE models, thus allowing the solution to be scalable and extendible to as many applications as one can model. This decoupling of measurements and applications has another benefit, it eases
troubleshooting in case of service degradation. Indeed, by providing a local view of the expected QoE, one can compare the experienced quality, say for example during an audio conversation, to the local view on each side, thus identifying who is responsible for service degradation.
In this paper, we summarize our methodology and apply it to the particular Skype use case. In Sec. II, we detail the principle of direct linking of QoE to network-level measurements and highlight the different techniques and experiments needed to this end. In Sec. III-A, we show how with controlled lab experiments, we can change network conditions and establish an annotated dataset for Skype voice call quality as a function of network performance metrics (QoS). In Sec. III-C, we use this dataset to calibrate our machine learning models linking network QoS and Skype QoE. In Sec. III-D we evaluate the performance of the QoE prediction and highlight that even if QoE is subjective by nature, it is possible to establish a link between low-level objective network performance indicators and high-level QoE indicators. Finally, we conclude the paper and discuss possible extensions of the work in Sec. V.
II. FROM NETWORK-LEVEL MEASUREMENTS TOQOE
PREDICTION: OUR GENERAL METHODOLOGY
Our methodology permits to predict the subjective QoE of virtually any network application by solely relying on the measurement of objective network performance indicators on the end user devices (e.g., smartphone, laptop). To that aim, we follow a two-phase supervised machine learning approach [8]. The first phase consists in calibrating, within a controlled environment and for each application, a machine learning model, whose inputs are the network performance metrics and whose output is the predicted QoE. The second phase consists in using the model by feeding it with live measurements issued from the end user device to predict the QoE she would experience on her Internet access.
For the first phase, we collect data from a controlled envi-ronment where network conditions are artificially changed and their impact on the QoE of the application to model is noted. These data constitute the annotated dataset necessary to train the machine learning model. As each network performance metric constitutes a dimension of the space to explore and as space size increases exponentially with the number of dimensions, it is indispensable to sample the performance metrics space so that all its parts are well represented. We rely on the Fourier Amplitude Sensitivity Analysis (FAST) method [9] known for its efficiency in identifying the most relevant points in the space to explore, even at the corners of the space. The idea of the FAST method is to rely on a baseline virtual time then to assign to each parameter (i.e., QoS metrics) a distinct integer frequency (characteristic frequency). By moving in the virtual time, the different dimensions are jointly scanned. The number of experiments is set such that the spectrum of system output (QoE in our case) can be well captured.
The obtained dataset permits to train a QoE model linking network performance metrics to the quality of experience
for the considered application. This constitutes a classical supervised machine learning problem that can be addressed with a variety of techniques (e.g., Decision Trees, Bayesian Networks, Support Vector Machines). The QoE can be pre-dicted by applying the corresponding model over network measurements without the need to run the application itself.
Once the model established and deployed on the end-users devices, it is necessary to determine how to measure network performance in the wild. More specifically, we have to decide on the Internet paths to measure. These paths should be relevant to and representative of the modeled applications. In IP terminology, this can be translated into the IP address (or the host) to probe for the calculation of the performance metrics at the access. Measuring a nearby address provides an optimistic view of the network performance. It thus allows a local view on the Quality of Experience and underlines the impact of the access link. On the other side, measuring a distant IP address can seriously underestimate the network performance that the user would really have. We advocate the principle of multiple measurement points (i.e., measure to different IP addresses), apply the QoE prediction on each of the corresponding paths, and present to the user the span of her QoE. This principle has proven its utility in capturing the span of performance at the access and the troubleshooting in case of anomalies [10], [11].
III. THESKYPE USE CASE
We illustrate our methodology with Skype voice calls. Skype QoE is a subjective matter per se that requires the intervention of users. Fortunately, in the latest versions of Skype, a quality meter is provided during voice calls that models the average feedback of the Skype users for the same network conditions.1It is therefore possible to use such meter
in substitution of the panel of users, and construct a dataset that establishes the link between network performance metrics and the QoE of Skype as modeled by the meter.
A. Dataset construction
To initiate a call, the Skype client first exchanges informa-tion with the Skype network via the Internet. Once the call is established, packets are sent directly between the caller and the callee without passing through a relay node even in case of NAT. This direct communication between the caller and the callee gives us the opportunity to isolate the call traffic and control the network conditions it encounters.
As depicted by Fig. 1, our experimental testbed is composed of 2 hosts, playing the roles of caller and callee, connected together via a wireless network through a GNU/Linux access point. The role of the access point is twofold. On the one hand it provides an Internet access to the hosts in order to establish Skype calls and on the other hand it emulates different network conditions by the means of Dummynet [12].
1The quality meter embedded in Skype is based on the analysis of the
packets of the ongoing Skype communication and is then strongly coupled with the Skype application.
10.0.1.0/24 192.168.16.0/24 Internet
Fig. 1. Experimental testbed to construct our annotated dataset.
Supported by recent findings on the quality of VoIP ([13], [14], [15]), end-to-end delay, packet loss rate, and end-to-end available bandwidth are the main network metrics that impact QoE of voice calls, all in both upstream and downstream directions. We therefore limit our network measurements to these 6 metrics. The variability of these metrics, especially when it comes to the variability of the delay, also called jitter, has significant impact on the audio quality as well. In this work, and a first proof of concept for the mapping of QoE to network-level measurements, we only consider static network conditions where these metrics do not vary, while leaving the dynamic scenarios to future research. We therefore limit our network measurements to these 6 metrics. Also, to reduce the number of experiments within this 6-dimensional space, we limit the end-to-end delay to up to 1000 ms, the bandwidth to up to 1000 Kbps, and the packet loss rate to up 50%. As explained before, we apply the FAST method to determine the number of experiments to perform and the network conditions to apply for each Skype voice call. We thus establish 393 different Skype voice calls, each with different network conditions. The value indicated by the Skype quality meter is retrieved once stabilized (after about 15 seconds). More precisely, the Skype quality meter distinguishes three different quality classes: (i) Good when the call has no noticeable trouble; (ii) Medium when call quality is acceptable but presents minor troubles; (iii) Poor when call quality is really bad with numerous troubles. For the sake of completeness, we add a forth class, the No call class, that indicates that Skype is not able to establish a voice call because of severe network conditions.
We perform 145 additional calls with network conditions randomly chosen around low loss rates so as to increase the precision of the dataset in the part of the space where high variability of QoE is observed. Furthermore, to constitute an independent validation set, we make 100 additional calls for network conditions spread randomly over the metrics space. B. Dataset transformation
We want the developed model for Skype to be used in practice for QoE prediction. Some of the six QoS metrics mentioned earlier are hard to measure in the Internet. As a matter of fact, one way delays are almost impossible to collect due to the need of clock synchronization between the two peers while link capacity is difficult to measure precisely due to noise in the delay measurement and perturbations caused by the packet loss ratio in the underlying link layer. To solve such issues, we post-process our dataset transforming these metrics.
One way delays are merged together to obtain the Round-Trip Time (RTT) which can be easily measured in practice. We also introduce the passing throughput as a metric for our final dataset that models the bandwidth in each direction of the call; this metric can be easily measured and can be obtained in our experiments by multiplying the link capacity with the rate at which packets successfully reach the destination.
Our extensive tests reported in [16] show that this trans-formation does not affect the accuracy of the models. Unless stated otherwise, we consider the transformed dataset with the 5 following QoS metrics in the remaining of this paper:
• Network round trip time;
• Network packet loss rate, both downstream and upstream;
• Network end-to-end passing throughput, both down-stream and updown-stream.
C. Model calibration and analysis
Our method relies on supervised machine learning but does not impose any particular algorithm. For the Skype use case, we consider the eight following families of machine learning classifiers, all provided by the Weka framework [17]. Decision Trees present human readable models based on a binary tree that is built by binary splitting the space selecting each time the most valuable feature to structure the branches. Rule Induction builds the minimum number of disjunctive rules consistent with the training set. As decision trees, the model can easily be read by humans.
Probabilistic Methods build lightweight models based on conditional probabilities assuming independent input features. Logistic Regressions use statistical regression techniques based on the probability that a class occurs given a set of independent input variables.
Support Vector Machine is a modern technique based on cutting hyperplanes that separate classes.
Neural Networks are based on a layered network of nodes where each node has a function that maps input to an output using weights calculated iteratively over the training data. Lazy Learners are based on comparing the value to predict with well known values. These algorithm require all the training data to be kept in memory and do not produce any model. Instead, the whole process is done at classification time observing the neighbors of the instance to classify.
Ensemble Methods are meta techniques that can be applied on other algorithms. The final classifier is obtained by combining multiple models in a way to avoid overfitting and reduce the variance of the classifier output.
For room constraints, we only discuss herein the model obtained with a decision tree. The detailed study of the other models is available in [16]. The interest of a decision tree is that it is easily readable and that the set of rules it provides can explain relationships between the input (i.e., QoS) and the output (i.e., QoE) in concrete terms. More precisely, we use a C4.5 binary tree [8] built from the training set described in Sec. III-B using the J48 implementation of Weka.
The obtained decision tree is composed of 91 nodes and 46 leaves. The computational complexity of the classification
op-eration (i.e., the number of comparisons necessary to classify an instance) is equal to the depth of the branch matching the input; our model has a minimum depth of 3 and a maximum depth of 11 while the average depth is 7.4. These numbers prove that the link between network performance metrics and QoE can be captured with a relatively lightweight model.
According to the generated decision tree, the most decisive factor (i.e., the very first branching decision) is the loss rate in the upstream direction, where a loss rate higher than 27% definitely prevents a call from being of Good quality. Combining this criteria with an upload throughput lower than 23 Kbps, calls are always Poor or even impossible. This example, confirms that decision trees permit to readily understand the QoS conditions that have the major influence on the QoE, which is particularly useful for network architects and operators. In like manner, the generated tree shows that the effect of round-trip delay on the QoE is marginal for delays observed in practice (i.e., less than 200ms).
To evaluate the performance of our model, we use the two standard performance indicators: the accuracy and the (precision, recall) couple. On the one hand, the accuracy is defined as the number of correctly classified instances over the total number of instances. Such index allows to have a simplified global view on the classification performance of the model. On the other hand, the (precision, recall) couple permits to evaluate the behavior of the classifier for each class. This performance index is composed of two complementary metrics: (i) the precision and (ii) the recall. The precision is a quality metric that allows to estimate the error rate of a classifier over a specific class (i.e., defined as true positives of a class over the total number of instances classified as this class). On the other side, the recall is a quantity metric that allows to estimate the completeness of a classification considering a specific class (i.e., defined as true positives of a class over the number of instances really belonging to the considered class). Given the low number of classes in our case, it’s possible to use such kind of metric to understand how our model performs over each QoE class independently.
We consider two different approaches to evaluate the perfor-mance of our model. First, we evaluate its prediction accuracy using an independent validation set, and then, we assess the stability of the classifier performing a cross validation. D. Prediction accuracy
The prediction accuracy stresses the model and determines how efficient it is in predicting QoE from network conditions that have not been observed during the learning phase. For this, we use the 100 observations contained in the validation set. It is important to notice that in this test we don’t have any value of the Good class because of the uniform random sampling adopted to build the validation set and the fact that this class has a lower extension (i.e., is marginal) than the other ones in the considered sample space.
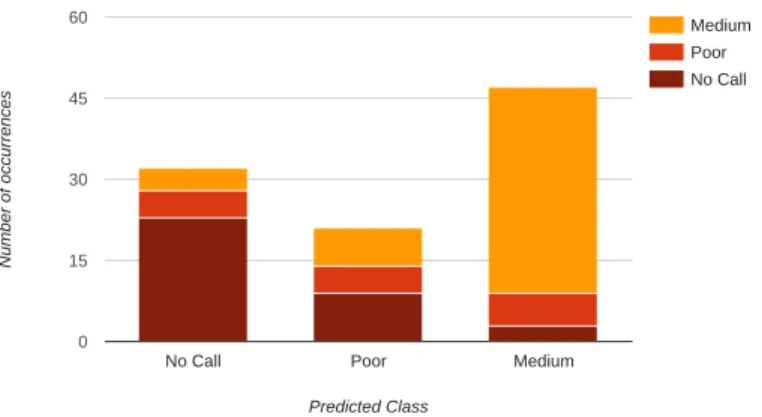
We start with the decision tree model. The overall prediction accuracy of the decision tree over the 100 samples of the validation set is 66%. To better understand this result and the
Medium Poor No Call
No Call Poor Medium
0 15 30 45 60 Predicted Class Nu m be r o f occu rr en ces
Fig. 2. Prediction accuracy breakdown.
class causing most difficulties to the classifier, Fig. 2 presents a breakdown of the results of classification for each class. We notice a propensity of the classifier to underestimate the total surface that the Poor class covers in the total metrics space. This transforms into a difficulty to predict Skype QoE when network conditions are Poor, and in a tendency to either underestimate or overestimate the quality in such conditions. For the other classes, the prediction accuracy is higher. Nevertheless, most of the errors (80%) are bounded to the adjacent class (i.e., 93% of values can be classified without a relative error greater than 2 classes).
To complement Fig. 2, we plot in Fig. 3 the precision (x-axis) and recall (y-axis) obtained for each class over the independent validation set. For the sake of completeness, we present the results obtained for all tested algorithms, each point representing a different algorithm trained and tested with the same training and validation set. We can see that we have comparable result with what stated before: the performance over the No Call and Medium classes is higher than the one for the Poor class where no algorithm is able to reach high performance. We also notice that all algorithms present comparable prediction accuracy of Skype voice quality. E. Cross-validation
In order to estimate the stability of our classifier over unseen data (like in a real world scenario), we use cross-validation. This technique is used to avoid the possible bias of a specific validation set and allows to check if a classifier suffers from overfitting (is too biased by the training set). Cross-validation iteratively splits the dataset in two parts, one for training and one for validating the model created in each iteration. We apply the widely used 10-fold stratified cross validation that consists in performing 10 different test runs where each instance in the dataset is used in the validation set exactly one time. Indeed, each test splits the full dataset in 10 parts, 9 for training and 1 for validation where parts are constructed in such a way to keep a class distribution similar to the original distribution of the provided dataset.
We obtain the results shown in the scatter plot of Fig. 4. Each class is represented in a different graph where, on the x-axis there is the precision and, on the y-axis there is the recall value. Each tested algorithm is represented as a point.
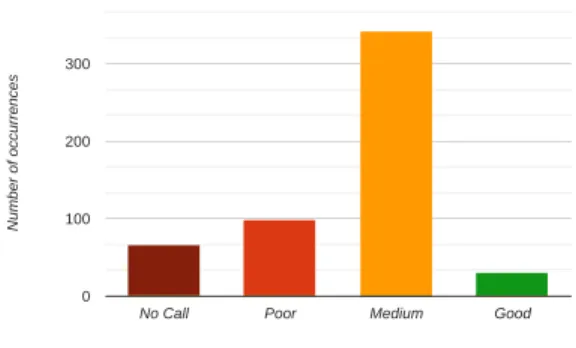
No Call Poor Medium Good 0 100 200 300 Nu m be r o f occu rr en ces
Fig. 5. Training set composition.
Comparing this plot with the one in Fig. 3, we can see that we have comparable performance of algorithms. This confirms the result of the test in Sec. III-D: the Poor class is penalized whereas the other classes, particulary the Medium class, leverages a higher prediction accuracy. Next, we try to understand the reasons of this difference between classes. F. Performance Diagnosis
First, we check if the dataset transformation presented in Sec. III-B introduces information loss. To do so we compare the previous results obtained using the transformed dataset with the ones obtained with the original dataset applying the same methodology (prediction accuracy and cross validation). The evaluation does not show any significant difference al-lowing us to discard this assumption and confirming what expected in Sec. III-B (for more details see [16]).
We then check if our results were affected by the distribution of classes in the training set (see Fig. 5). Comparing this distri-bution with the results presented in Sec. III-D, we can clearly see that the best performance is indeed achieved where we have more data (i.e., the Medium class). Given such premise, we further investigate this issue to make sure that we are not facing a class imbalance problem. For this investigation, we follow two opposite approaches: oversampling, i.e., inflating the number of instances in the underrepresented classes, and undersampling, i.e., removing values from the overrepresented classes. For the oversampling, we randomly replicate instances in the underrepresented classes to obtain a more equilibrated distribution using different levels of aggressiveness; we also check by inflating the data by interpolation (applying the SMOTE algorithm [18]) and assuming that the classes are shaped as convex sets. For the undersampling, we randomly discard values in order to flatten the training set distribution. Again, different levels of aggressiveness are considered. All these tests do not show any significant change in the results (for more details see [16]) which suggests a difficulty to improve further the performance of our model for Skype by modifying the training set distribution.
At the light of these tests, we believe that the difficulty to predict very accurately some classes is due to the inherent subjectivity of the QoE where the boundary between classes is not clear as it mostly depends on human perception. This conclusion is corroborated with the presence of noise in the dataset where we observe the overlapping of observations for different network conditions.
IV. RELATEDWORKS
A comprehensive survey of approaches to link QoS and QoE applied to the multimedia domain can be found in [19]. In [20] and [21] data are collected from a vantage point (in collaboration with the ISP) and the selection of the observed input metrics is conditioned by the target application. Our methodology differs from this as we relate general network metrics measured independently of the application to the QoE. The correlation between the stability of the connection and the QoE is considered in [22], [23]; we do not consider the variability of network conditions in our work but as long as variability is measurable, it can be introduced in our methodology and used to calibrate the model.
While we do not propose any new QoE metric, other works ([24], [22]) perform their QoE classification based on own psychological studies or standard QoE estimation methods related to the VoIP domain [25]. In this work, we demonstrate that it is possible to investigate the QoS – QoE relation of a service and predict it without a specific definition thanks to machine learning; our methodology is then applicable to other applications considering the same set of inputs and will be part of our broader project called ACQUA [10].
V. CONCLUSION
In this paper, we propose a new method to allow ser-vice providers and application users to predict subjective application-level QoE from the measurement of objective network performance metrics such as delay or bandwidth. To that aim, we rely on machine learning to calibrate models that express the QoE as a function of network-level measurements preformed independently of the targeted application.
We demonstrate the feasibility and accuracy of this method in the context of Skype voice calls. An average prediction accuracy of 66% is reported, with the Medium class showing the best performance (i.e., up to 75%). To calibrate the model for Skype, we use a controlled network environment where we manage to vary networks conditions at our envy. In the future, we plan to extend experiments by involving social analysis to help to understand better the impact of the subjectivity of QoE on the model accuracy. In parallel, we are currently applying our methodology to the case of video streaming.
REFERENCES
[1] Nokia, “Quality of Experience (QoE) of Mobile Services: Can It Be Measured and Improved?” Nokia, Tech. Rep., 2004.
[2] R. Schatz, T. Hoßfeld, L. Janowski, and S. Egger, “From packets to people: Quality of experience as a new measurement challenge,” in Data Traffic Monitoring and Analysis, ser. Lecture Notes in Computer Science, E. Biersack, C. Callegari, and M. Matijasevic, Eds. Springer Berlin Heidelberg, 2013, vol. 7754, pp. 219–263.
[3] K. Mitra, A. Zaslavsky, and C. Ahlund, “Context-aware qoe modelling, measurement and prediction in mobile computing systems,” IEEE Trans-actions on Mobile Computing, vol. 99, no. PrePrints, p. 1, 2014. [4] A. Botta, A. Pescap´e, and G. Ventre, “Quality of service statistics over
heterogeneous networks: Analysis and applications,” European Journal of Operational Research, vol. 191, no. 3, pp. 1075–1088, 2008. [5] S. Sundaresan, W. de Donato, N. Feamster, R. Teixeira, S. Crawford,
A. Pescap´e, “Measuring Home Broadband Performance,” Commun. ACM, vol. 55, no. 11, pp. 100–109, 2012
precision 0 0.2 0.4 0.6 0.8 1 recall 0 0.2 0.4 0.6 0.8 1 No call precision 0 0.2 0.4 0.6 0.8 1 recall 0 0.2 0.4 0.6 0.8 1 Poor precision 0 0.2 0.4 0.6 0.8 1 recall 0 0.2 0.4 0.6 0.8 1 Medium
Fig. 3. Validation Set: precision/recall for each class.
precision 0 0.2 0.4 0.6 0.8 1 recall 0 0.2 0.4 0.6 0.8 1 No call precision 0 0.2 0.4 0.6 0.8 1 recall 0 0.2 0.4 0.6 0.8 1 Poor precision 0 0.2 0.4 0.6 0.8 1 recall 0 0.2 0.4 0.6 0.8 1 Medium precision 0 0.2 0.4 0.6 0.8 1 recall 0 0.2 0.4 0.6 0.8 1 Good precision 0 0.5 1 recall 0 0.2 0.4 0.6 0.8 1 No call C4.5 (pruned no iterations) C4.5 (unpruned) C4.5 (pruned) AdaBoost C4.5 (10x) AdaBoost C4.5 (25x) Furia Random Forest (25) Random Forest (50) Random Forest (50-5) LogitBoost Random Forest (10x10) JRip AdaBoost JRip (10) AdaBoost JRip (25) Bagging C4.5 (25) Naive Bayes SVM kNN Tuned C4.5 (unpruned) Logistic
Fig. 4. 10-fold stratified cross-validation: precision/recall for each class.
[7] “Free calls, text and picture sharing with anyone, anywhere!” 2014, http://www.viber.com.
[8] S. B. Kotsiantis, “Supervised machine learning: A review of classification techniques,” in Proceedings of the 2007 Conference on Emerging Artificial Intelligence Applications in Computer Engineering: Real Word AI Systems with Applications in eHealth, HCI, Information Retrieval and Pervasive Technologies. Amsterdam, The Netherlands: IOS Press, 2007, pp. 3–24.
[9] R. I. Cukier, C. M. Fortuin, K. E. Shuler, A. G. Petschek, and J. H. Schaibly, “Study of the sensitivity of coupled reaction systems to uncertainties in rate coefficients. I Theory,” The Journal of Chemical Physics, vol. 59, no. 8, pp. 3873–3878, 1973
[10] “Acqua: Application for predicting quality of user experience at internet access,” 2015, http://team.inria.fr/diana/acqua/.
[11] R. Cascella and C. Barakat, “Estimating the access link quality by active measurements,” in ITC, 2010 22nd International, Sept 2010, pp. 1–8. [12] L. Rizzo, “Dummynet: A simple approach to the evaluation of network
protocols,” SIGCOMM Comput. Commun. Rev., vol. 27, no. 1, pp. 31–41, Jan. 1997.
[13] M. S. Islam and S. N. Mehdi, “How different qos mechanisms affect voip qos metrics,” p. 47, 2010.
[14] X. Gu, K. Nahrstedt, R. Chang, and Z.-Y. Shae, “An overlay based qos-aware voice-over-ip conferencing system,” in Multimedia and Expo, 2004. ICME ’04. 2004 IEEE International Conference on, vol. 3, June 2004, pp. 2111–2114 Vol.3.
[15] L. Yamamoto and J. Beerends, “Impact of network performance param-eters on the end-to-end perceived speech quality,” in In In Proceedings of EXPERT ATM Traffic Symposium, 1997.
[16] T. Spetebroot, “From network-level measurements to expected quality of experience - technical report,” INRIA, Tech. Rep., march 2015 http://tinyurl.com/qf979rk.
[17] M. Hall, E. Frank, G. Holmes, B. Pfahringer, P. Reutemann, and I. H.
Witten, “The weka data mining software: An update,” SIGKDD Explor. Newsl., vol. 11, no. 1, pp. 10–18, Nov. 2009.
[18] N. V. Chawla, K. W. Bowyer, L. O. Hall, and W. P. Kegelmeyer, “Smote: Synthetic minority over-sampling technique,” J. Artif. Int. Res., vol. 16, no. 1, pp. 321–357, Jun. 2002.
[19] M. Alreshoodi and J. Woods, “Survey on qoe\qos correlation models for multimedia services,” CoRR, vol. abs/1306.0221, 2013.
[20] A. Balachandran, V. Sekar, A. Akella, S. Seshan, I. Stoica, and H. Zhang, “Developing a predictive model of quality of experience for internet video,” in Proceedings of the ACM SIGCOMM 2013 Conference on SIGCOMM, ser. SIGCOMM ’13. ACM, 2013.
[21] M. Z. Shafiq, J. Erman, L. Ji, A. X. Liu, J. Pang, and J. Wang, “Understanding the impact of network dynamics on mobile video user engagement,” in The 2014 ACM International Conference on Measurement and Modeling of Computer Systems, ser. SIGMETRICS ’14. New York, NY, USA: ACM, 2014, pp. 367–379.
[22] T. Hoßfeld and A. Binzenh¨ofer, “Analysis of skype voip traffic in umts: End-to-end qos and qoe measurements,” Computer Networks, vol. 52, no. 3, pp. 650–666, 2008.
[23] C.-n. Chen, C.-y. Chu, S.-l. Yeh, H.-h. Chu, and P. Huang, “Modeling the qoe of rate changes in skype/silk voip calls,” in Proceedings of the 20th ACM International Conference on Multimedia, ser. MM ’12. New York, NY, USA: ACM, 2012, pp. 119–128.
[24] K.-T. Chen, C.-Y. Huang, P. Huang, and C.-L. Lei, “Quantifying skype user satisfaction,” in Proceedings of the 2006 Conference on Applications, Technologies, Architectures, and Protocols for Computer Communications, ser. SIGCOMM ’06. New York, NY, USA: ACM, 2006, pp. 399–410.
[25] “ITU-T recommendation P.862. Perceptual evaluation of speech quality (PESQ): an objective method for end-to-end speech quality assessment of narrow-band telephone networks and speech codecs,”, Feb. 2001.