HAL Id: hal-00434460
https://hal.archives-ouvertes.fr/hal-00434460
Submitted on 11 Feb 2010
HAL is a multi-disciplinary open access
archive for the deposit and dissemination of
sci-entific research documents, whether they are
pub-lished or not. The documents may come from
teaching and research institutions in France or
abroad, or from public or private research centers.
L’archive ouverte pluridisciplinaire HAL, est
destinée au dépôt et à la diffusion de documents
scientifiques de niveau recherche, publiés ou non,
émanant des établissements d’enseignement et de
recherche français ou étrangers, des laboratoires
publics ou privés.
Vibration of submillimeter-size supported droplets
Franck Celestini, Richard Kofman
To cite this version:
Franck Celestini, Richard Kofman. Vibration of submillimeter-size supported droplets. Physical
Review E : Statistical, Nonlinear, and Soft Matter Physics, American Physical Society, 2006, 73 (4),
pp.041602.1-041602.6. �10.1103/PhysRevE.73.041602�. �hal-00434460�
Franck Celestini∗ and Richard Kofman
Laboratoire de Physique de la Mati`ere Condens´ee ,UMR 6622, CNRS, Universit´e de Nice Sophia-Antipolis, Parc Valrose 06108 Nice Cedex 2, France
(Dated: February 11, 2010)
We study the fundamental vibration mode of supported sub-millimetric droplets. Using an anal-ogy with a simple oscillator we derive a semi-analytical expression for the eigen frequency and the scaling law of the energy dissipation within the droplet. The experimental results obtained for mer-cury drops deposited on glass are compared with the model. The agreement is satisfactory for the eigen frequencies on the whole range of size we considered ( from 0.04 to 0.9 mm). The scaling law for the dissipation is recovered for radii larger than 0.1 mm but fails for smaller droplets. We finally discuss possible applications related to the use of vibrations to effectively reduce the hysteresis of wetting angle and therefore increase the mobility of supported droplets.
PACS numbers: 47.55.Dz,68.35.Ja,68.08.Bc
I. INTRODUCTION :
The vibrations of free liquid drops have been first in-vestigated more than one century ago by Kelvin [1] and Rayleigh [2]. Later, Lamb [3] found a general expression for the different vibration modes of a free liquid drop surrounded by an outer fluid :
ω2 n= n(n − 1)(n + 1)(n + 2) (n + 1)ρ + nρf γ R3 (1)
In this expression, ρ and ρf are the densities of the liquid and outer fluid respectively, n refers to the mode number and R is the liquid drop radius. The surface tension γ is the driving force for the oscillations and is at the origin of the −3/2 exponent in the scaling of frequency with the drop size. These pionneering studies have been used and extended in different fields, for example in the case of nonlinear oscillations of pendant drops [4]. However, the case of a liquid drop in partial contact with a sub-strate has not been so fully investigated. In the eighties, the microgravity experiments have motivated both ex-perimental and theoretical studies leading to new results in the case of axisymmetric vibrations [5–7]. Neverthe-less, the singularity of the drop shape at the triple line has prevented analytical results. The fundamental mode associated to a longitudinal vibration of the substrate has not been described and the dependence of the eigen-frequencies in the wetting angle has never been fully ex-amined.
If it is well known [8] that vibrations can help in prob-ing energy barriers responsible for the wettprob-ing angle hys-teresis, the effect of vibrations on the mobility of sup-ported drops has just been recently demonstrated [9, 10]. These new studies are motivated by the numerous ap-plications in microfluidics [11] and microelectronics [12]. They could also be of importance in understanding fun-damental questions associated to the contact line motion.
∗Electronic address: [email protected]
The driving force for the drop mobility can be achieved in different ways. For example with substrates with surface tension gradient [13–15] or using the electrowetting effect [16]. Nevertheless, in both cases the drop mobility is re-duced because of the wetting angle hysteresis [17]. The main idea is therefore to use vibrations of the substrate or an other oscillating external force acting on the drop, in order to effectively reduce the hysteresis. Promising results have been obtained very recently [18] and possible applications are currently under study.
The aim of this paper is to fully characterize the funda-mental vibration mode of a supported drop. It is associ-ated to vibrations of the substrate parallel to the surface. This mode is the one that should have the most impor-tant influence on the drop mobility because the vibra-tions induce an increase and a decrease of the advancing and receding wetting angle respectively (Fig. 1). For a sufficiently large vibration we expect to reach the wetting angle hysteresis threshold and, under the influence of an external force, eventually move the droplet. We will not consider the second mode corresponding to perpendic-ular vibrations of the substrate but a similar approach to the one presented in this paper can also be used for its characterization. An analogy with a simple oscilla-tor will be presented in the model section from which we will propose a semi-analytical expression for the eigen frequency and a scaling law of the dissipation term with the drop size. We will present the chosen system and the measurement techniques in the experimental section. The experimental results obtained for a mercury drop deposited on glass will be compared to the model in a third part. We will finally discuss our results and some prospects in the conclusion.
II. MODEL :
We first concentrate on the eigen-frequency ω0 of a supported droplet vibrated in the direction parallel to the substrate. For a sufficiently weak external force the triple line remains fixed and the surface is deformed. The
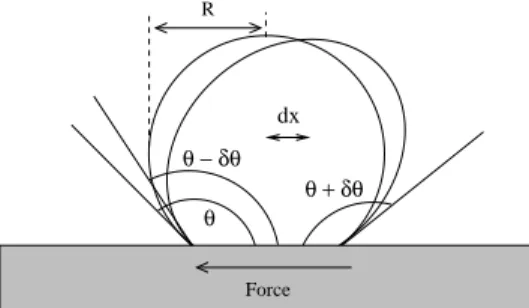
2 dx R Force θ θ − δθ θ + δθ
FIG. 1: Schematic representation of the droplet shape under the influence of an external force. The deformation induces a displacement dx of the center of mass and a variation δθ of the advancing and receding wetting angles.
deformation is characterized by the displacement dx of the center of mass and by the variation δθ of the advanc-ing and recedadvanc-ing wettadvanc-ing angles θa and θd (Fig. 1.). We call θ the equilibrium wetting angle and assume a sym-metric variation of the wetting angles : θa = θ + δθ and θr= θ − δθ. We note ∆S = S − S0 the surface variation associated to the deformation where S0 is the surface of the droplet at equilibrium and S its surface under the influence of an external force. We can write ∆S as :
∆S = S0f (θ)δθ 2
(2) where we include the linear relations between ∆S and S0 and between ∆S and δθ2. The function f (θ) takes into account the fact that the precise relation between these quantities depends on the equilibrium wetting an-gle value. The limiting case where θ tends to π helps understand the role of f (θ). In this case the droplet has a small contact area with the substrate, for θ = π the contact reduces to a point and the droplet can freely ro-tate around it without any deformation. The limit value of f (θ) when θ tends to π is therefore 0. One can easily see that this is no longer the case when θ < π. We can also write for the displacement of the center of mass :
dx = g(θ)Rδθ (3)
In this expression R is the radius of the truncated sphere (Fig. 1.) and g(θ) a second function depending on the system geometry.
Combining the two previous expressions we obtain :
∆S = S0h(θ) R2 dx 2 (4) where h(θ) = f (θ)/g(θ)2 . A restoring force F = −γ∆S/dx is associated to the deformation. It reads :
F = −γS0h(θ)
R2 dx (5)
100 120 140 160 180
Wetting angle ( degree ) 0 0,2 0,4 0,6 0,8 1
h(
θ
)
FIG. 2: Numerical values obtained for h(θ).
θ
θ
δ
eff
FIG. 3: Schematic representation of the effective wetting an-gle associated to the Stoke length.
where γ is the surface tension between the liquid and the vapor. The restoring force is linear in the displace-ment of the center of mass so that we can define an ef-fective spring constant keand the eigen-frequency of the droplet w0 = pke/ρV . Using the expressions for the surface S0 and the volume V of a truncated sphere we finally write : ω0= s 6γh(θ) ρ(1 − cosθ)(2 + cosθ)R −3/2 (6)
where ρ is the liquid density. In this expression the dependence in the geometry is included on h(θ). We compute h(θ) under the hypothesis that the deformation is the one obtained at equilibrium, i.e. that the defor-mation is the one that minimises the free energy of the droplet under the influence of a constant external force. This hypothesis can be checked looking at the capillary number Ca = ηV /γ that measures the relative impor-tance of viscous and capillary pressures. For the system considered experimentally the values of Caare well below unity justifying the assumption of an equilibrium defor-mation due to the predominance of capillary effects.
We use the program Surface Evolver (SE) [19] to nu-merically compute the function h(θ). We first simulate a drop wetting a substrate parallel to the (Ox, Oz) plane. The wetting angle is given as an input parameter and we fix the triple line position. We therefore use the
GRAV-ITY constant of the SE to apply an external force to the droplet. Under the influence of this external force, par-allel to the substrate and applied to the overall droplet volume, the drop reaches the equilibrium shape that min-imises its free energy. For different values of the GRAV-ITY constant we record the different quantities we are interested in : the advancing and receding wetting an-gles θa and θr, the position of the center of mass dx, the surface variation ∆S and the ghost radius variation dR that will be discussed and used in the experimen-tal section. For what concerns the numerical estimate of h(θ), we first plot ∆S versus dx to verify the expected quadratic relation. Since S0 and R are known quanti-ties, a best fit to equation 4. permits to obtain h(θ). The same procedure is used for different values of the wetting angle. Calculated values of h(θ) for wetting angles rang-ing between 90 and 170 degree are represented in Fig. 2. Note that we recover the limiting case discussed above for which h(θ) tends to zero when θ tends to π. This function is not material dependent and could therefore be used in the future for different systems. It should also permit, for example, to determine the angle of a tilted plane above which the gravity force becomes larger than the sticking one due the wetting angle hysteresis [20]. More generally this function permits to obtain the characteristic capillary time of a supported droplet as a function of its wetting angle.
In the experiments presented below an inertial force is applied to the droplet through the vibration of the substrate. The substrate momentum diffuses within the liquid over a distance δ = p2µ/ω known as the Stokes length where µ is the kinematic viscosity. Above this dis-tance the droplet therefore experiences the inertial force. This situation is different of the simulated one using the SE. Indeed in the numerical analysis the external force is applied to the overall droplet volume. A first order cor-rection consists in defining an effective equilibrium wet-ting angle θef f (Fig. 3). In the limit of a small Stokes length as compared to the droplet radius (Rsinθδ << 1) we have :
θef f = θ − δ
Rsinθ (7)
Finally, the corrected eigen frequency can be calcu-lated using equation 6 but replacing the true equilibrium wetting angle θ by the effective wetting angle value θef f. In the limit of weak vibrations the position of the droplet center of mass (in the vibrating frame) satisfies the differential equation :
¨
x + α ˙x + ω2
0x = a0cos(ωt) (8)
where a0 is the acceleration due to the substrate vi-bration and ω0 the eigen frequency discussed just above. We now need to identify the dissipation term α to fully characterize the oscillating drop. Since we here describe the regime with a fixed triple line, the dissipation is due
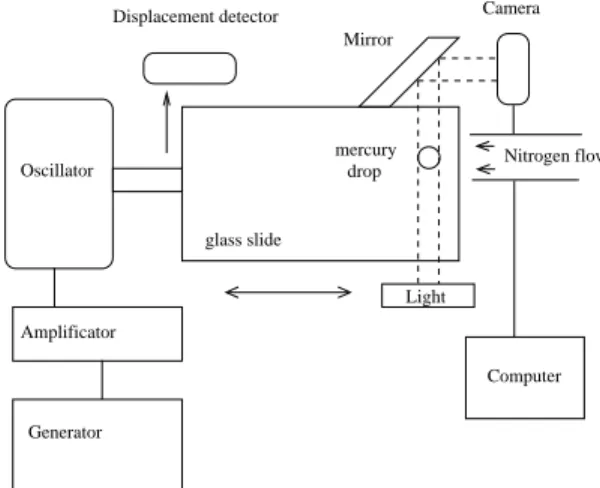
Generator Amplificator Oscillator glass slide Mirror Camera Light drop mercury Computer Nitrogen flow Displacement detector
FIG. 4: Schematic representation of the experimental appa-ratus.
to the diffusion of the substrate momentum within the liquid and therefore to the associated shear stress. This occurs on a distance of the order of the Stokes length δ. The associated viscous force Fs therefore scales as :
Fs∝ Scη
δ ˙x (9)
where Sc is the contact area with the substrate and η the liquid viscosity. Since α ∝ FsR−3, Sc ∝ R2 and δ ∝ ω−1/2 with ω = ω0 ∝ R−3/2 at the resonance, we therefore expect the scaling :
α ∝ R−7/4 and Q ∝ R1/4 (10) respectively for the inverse of the characteristic dissi-pation time α and Q = ω0/α the quality factor of the os-cillating droplet. It is important to note the weak size de-pendence of Q meaning that the resonance effect should be present even for very small droplets.
III. EXPERIMENTAL SECTION :
We choose to study mercury drops deposited on glass slides. The liquid drop has a wetting angle of 140◦. The glass slides are first cleaned with a detergent after what they are put into a freshly prepared piranha solution (30% H2O2 and 70% H2SO4) for twenty minutes. They are finally rinsed with an ultra-distilled water and dried under pure nitrogen. Mercury drops with radius ranging roughly between 0.05 and 1mm have been studied. For the larger drops a micro seringue is used for the deposi-tion while the smallest ones are producted using a thin capilar tube with an outer diameter of 70 µm. Once the drop is deposited, the glass slide is inserted in the vi-brating apparatus presented in Fig. 4. A nitrogen flow is necessary to prevent the oxydation of mercury. A low
4
2 δθ
2 dR 2 dx
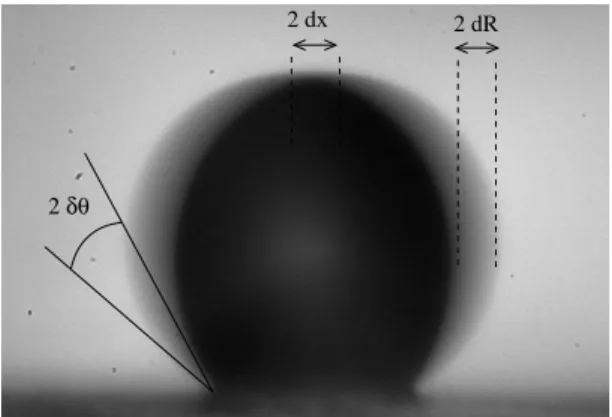
FIG. 5: Image of a vibrating R = 0.192mm mercury drop. The measure of the ghost radius variation dR permits to cal-culate both δθ and dx.
frequency signal is sent to the vibrator through an am-plificator and the oscillation amplitudes of the plate are optically measured with a photodiode. A video camera is used to visualize the drop and the image is formed through a mirror attached to the vibrating plate. We therefore just visualise the vibration induced to the drop by the substrate. The time exposure of the camera being larger than the applied vibration period we record ghost images of the drop. This is illustrated in Fig. 5 for a drop with radius 0.192mm vibrated at a frequency of 252Hz. In the same manner that we found the relation be-tween the surface variation and the center of mass dis-placement, we use the SE to obtain the relation between the ghost radius variation dR and the associated wetting angle variation δθ (Fig. 5). For a wetting equilibrium angle of 140◦ we found δθ ≃ 96.5dR/R. To fully and quantitatively describe the drop oscillations we also need the relation between δθ and the associated displacement of the center of mass dx (Fig. 5) as expressed in equa-tion 3. Once again we use the SE to numerically evaluate g(θ = 140◦) and obtain the relation : δθ = 102.7 dx/R.
IV. RESULTS :
We first concentrate on the eigen-frequency of the drops. A simpler manner to determine it is to find the fre-quency for which dR is maximum. This is what we do for mercury drops with radius raging between roughly 0.04 and 0.9 mm. We present in Fig. 6 the eigen-frequency as a function of the drop size. The dotted line corresponds to the Equ. 6 with a value of θ = 140◦corresponding to the true wetting angle of mercury on glass. We can see that the −3/2 exponent is recovered but that the model seems to underestimate the eigen frequency value. We therefore use the correction to θ due to the Stokes length (Equ. 7). For the drop size considered in this study the correction is roughly 10◦. The full line in Fig. 6 there-fore represents Equ. 6 with θ = θef f = 130◦. Even if the agreement is better we still underestimate the eigen
0,1 1
R (mm)
1001000
Frequency (Hz)
FIG. 6: Eigen frequency as a function of the drop size. The dotted and full lines are calculated using Equ. 6 respectively with θ = 140◦and θ = θ ef f= 130◦ . 295 300 305 310 315 320 frequency (Hz) 0 2 4 6 8 10 δθ (degree) 295 300 305 310 f (Hz) 0 5 10 δθ /a0 (degree m -1 s 2 )
FIG. 7: Amplitude of the wetting angle variation δθ as a function of the frequency vibration. The circles and diamonds respectively correspond to substrate accelerations a0 = 0.48
and 0.63 ms−2. In inset δθ is normalised by a
0 to verify the
linear response of the drop oscillator.
frequency. This means that the correction has to fully take into account the deformation within the region near the substrate. Nevertheless the model gives a reasonable prediction ( the underestimation is roughly 15%) with-out any adjustable parameter. A similar agreement has been found looking at the eigen frequency of the second mode, correponding to a vibration perpendicular to the substrate. The same approach has been used to obtain a semi-analytical expression and the results will be pre-sented elsewhere [21]. We also verified that the model gives a good agreement with the experimental data re-cently obtained [10, 18] for water droplets.
We now turn to the characterization of the energy dis-sipation. The resonance effect can be illustrated by mea-suring the amplitude of the wetting angle variation as a function of the applied frequency f . This can be achieved for different values of the substrate acceleration. We rep-resent in Fig. 7 δθ as a function of f for the two accelera-tions a0= 0.48 and 0.63 ms−2and for a droplet of radius
R = 0.176 mm. As expected δθ passes through a maxi-mum at the eigen frequency f0 and we recover a typical resonance plot. It is also not surprising to see that the larger the substrate accelerations, the larger the δθ values get. In inset we represent the same quantity but normal-ized by the substrate acceleration. In this case the two data sets lie on the same curve. This means that, for the acceleration considered here, the response of the oscilla-tor is linear and that the hypothesis of a fixed triple line is valid. One could extract from this curve the bandwidth ∆f = α/4π and therefore characterize the energy dissi-pation. For example from Fig. 7 we found ∆f ≃ 6Hz for the considered droplet. Nevertheless the procedure is rather complicated because we have to measure several resonance curves in order to verify the linear response of the system. We therefore choose a different procedure to characterize the dissipation. It consists, for different fixed substrate accelerations, to measure the maximum wetting angle variation i.e. to measure δθ at the eigen frequency ω0. For the simple oscillator considered here, we know that, at the resonace, dx = a0/ω0α. Using the relation between dx and δθ given in the experimental sec-tion we expect a linear relasec-tion δθ = p a0. A measure of the slope p therefore permits to extract the value of α and the associated bandwidth ∆f :
∆f = 96.5
4πω0R p
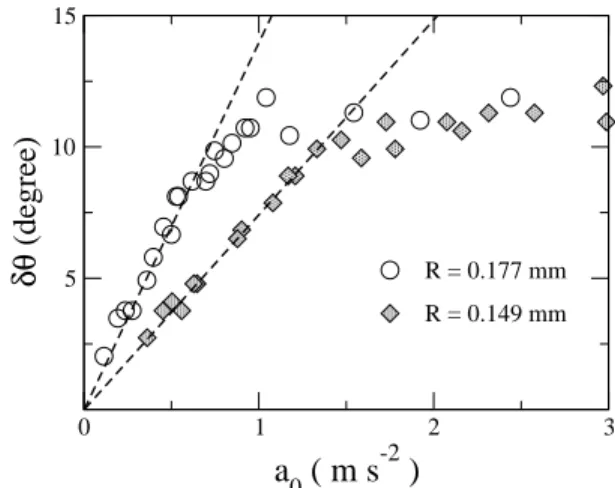
(11) We represent in figure 8 δθ as a function of a0for two droplets with radius 0.177 and 0.149 mm. We recover a linear relation for the weaker accelerations which con-firms the observation from the inset of Fig. 7. For larger a0 values, the curve deviates from linearity and tends to saturate. We interpret this behavior in the following manner : when δθ reaches the value of the wetting angle hysteresis, the triple line starts to moves and part of the substrate acceleration is used for this motion. As a con-sequence the angle amplitude variation saturates. The same qualitative behavior is observed for the two parti-cles. More quantitatively, we can remark that the value of δθ at which we reach the saturation is the same for the two droplets and roughly equal to 10◦. As stressed just above this gives us an estimate of the wetting angle hysteresis which, as expected, is not size dependant. A similar transition from a pinned to a mobile triple line has been recently obsverved for a sessile drop of water [22]. In this work the large radius droplets permit to directly measure both the triple line position and the droplet de-formation. This is not possible in our case and we detect the contact line motion through the non-linearity of the δθ versus a0 curve. Another way of detecting the con-tact line motion is to look at the frequency at which δθ is found to be maximum for different substrate ac-celerations. In the linear regime the eigen frequency is a constant as expected for an oscillator with a constant dis-sipation factor. Conversely, when we reach the nonlinear regime, the contact line motion induces a supplementary
0 1 2 3
a
0( m s
-2)
5 10 15δθ
(degree)
R = 0.177 mm R = 0.149 mmFIG. 8: Maximum wetting angle variation δθ as a function of the substrate acceleration for two droplets with R = 0.177 and 0.149mm. 0,1 1 R (mm) 1 10 100 1000 ∆ f ( Hz ) R -7/4
FIG. 9: Inverse of the relaxation time α as a function of the droplet radius. The full line represent the best fit to the expected scaling law (Equ. 9) for the larger droplet sizes.
dissipation source that lowers the eigen frequency. In the linear regime the slope is higher for the larger droplet. Since p is inversely proportional to α we recover here the prediction of a larger dissipation for the smaller droplets. To quantitatively test the scaling law given by Equ. 10 we measure ∆f for different droplet sizes. We plot in Fig. 9 ∆f as a function of R in a log-log represen-tation. We first verify that we obtain values of ∆f that are in good agreement with the ones directly obtained from the δθ versus f plot (Fig. 7). The full line repre-sents the best fit to the expected scaling law for the larger droplet sizes. The agreement between the model and the experiment is satisfactory for drops with radius roughly above 0.1 mm. Conversely, below this size the dissipa-tion is found to be well larger than expected. We have performed a lot of measurements in this region to confirm this apparent crossover and found that the dispersion in the experimental data increases as the droplet size de-creases. We have also verified that the disagreement is not due to the way we prepare and deposit the drop on the substrate. It is important to note that for the same
6 drop the scaling law for the eigen-frequency is respected
while we found a large disagreement for the dissipation term. Since the eigen frequency is governed by the liquid-vapor interface deformation it is therefore reasonable to think that a phenomenom is occuring at the contact area between the liquid and the substrate. The most probable explanation is that for the lower sizes the hypothesis of a fixed triple line is no longer valid. We therefore think that the substrate acceleration induces both a surface de-formation and a triple line motion. At present we cannot definitely explain why such a behavior is obtained for the smallest droplet sizes and plan to perform similar experi-ment on different substrates. The crossover could be due to the presence of impurity on the surface but also to the onset of slip at the liquid-solid interface.
V. CONCLUSIONS AND PERSPECTIVES :
To summarize, we have used an analogy with a sim-ple oscillator to extract a semi analytical expression for the eigen frequency of a supported droplet and a scal-ing law for the energy dissipation. We concentrate here
on the fundamental vibration mode coreesponding to a parallel vibration of the substrate (rocking mode). The agreement found between the model and the experiment is rather good for the eigen frequency without any free parameter. The expression given by equation 6 together with the numerical values of h(θ) (Fig. 2) could therefore be used in the future to obtain a reasonable prediction of the eigen frequency whatever system (i.e. the wetting angle) considered.
If the scaling law for the dissipation is verified for the largest considered droplets, a large discrepancy is found for radius roughly below 0.1 mm. We cannot give a defi-nite explanation for this crossover. We nevertheless think that it is related to the fact that for such drops substrate accelerations, even weak, induce both a drop deformation and a contact line motion. This behavior is qualitatively different of the one predicted and verified for the larger droplets. In this case, for the weaker accelerations the drop is simply deformed with a fixed triple line. Its mo-tion appears when the amplitude of the wetting angle variations is larger than the hysteresis. We plan future experiments to understand why this scenario is not re-covered for the smaller droplets.
[1] Lord Kelvin, mathematical and Physical papers, 3, 384 (1890).
[2] Lord Rayleigh, The Theory of Sound, Macmillan (1894). [3] H. Lamb hydrodynamics , Cambridge University press
(1932).
[4] O. A. Basaran and D. W. DePaoli, Phys. Fluids 6, 2923 (1994).
[5] M. Strani and F. Sabetta, J. Fluid mech. 141, 233 (1984). [6] R. W. Smithwick and J. A. M. Boulet, J. Colloid Interface
Sci. 130, 588 (1988).
[7] H. Rodot, C. Bisch and A. Lasek, Acta Astro. 6, 1083 (1979).
[8] E. L. Decker and S. Garoff, langmuir 12, 2100 (1996). [9] S. Daniel and M. K. Chaudhury, Langmuir 18, 3404
(2002).
[10] S. Daniel, S. Sircar, J. Gliem and M. K. Chaudhury, Langmuir 20, 4085 (2004).
[11] M. G. Pollack, R. B. Fair and A. D. Shenderov, Appl. Phys. Lett. 77, 1725 (2000).
[12] J. Simon, S. Saffer and C.J. Kim, J. MEMS 6, 208 (1997). [13] H. P. Greeenspan, J. Fluid. Mech. 84, 125 (1978). [14] F. Brochard, Langmuir 5, 432 (1989).
[15] T. Ondarcuhu and M. Veyssie, J. Phys II 1, 75 (1991). [16] G. Beni and S. Hackwood, Appl. Phys. Lett. 38, 207
(1981).
[17] P. G. de Gennes, 57, 827 (1985).
[18] S. Daniel, M. K. Chaudhury and P. G. de Gennes, Lang-muir 21, 4240 (2005).
[19] See K. A. Brakke, http://www.susqu.edu/facstaff/b/brakke/evolver [20] D. Qu´er´e, Langmuir 14, 2213 (1998).
[21] F. Celestini and R. Kofman, to be published.
[22] X. Noblin, A. Buguin and F. Brochard-Wyart, Eur. Phys. J. E 14, 395 (2005).