Département de Physique
Université de Fribourg (Suisse)
DuMond curved crystal spectrometer
and
Photoinduced K hypersatellite
x–ray lines of molybdenum
THÈSE
Présentée à la Faculté des Sciences de l’Université de Fribourg (Suisse) pour l’obtention du grade de
Doctor rerum naturalium
Monika Szlachetko
Pologne
Numéro de la thèse: 1637
Fribourg 2009
Ph. D. Thesis M. Szlachetko
sur la proposition de:
Prof. Dr. Dionys Baeriswyl, Université de Fribourg, Président de jury Prof. Dr. Jean-Claude Dousse, Université de Fribourg, Directeur de Thèse
Prof. Dr. Marek Pajek, Jan Kochanowski University, Kielce, Poland, Rapporteur Dr. Joanna Hoszowska, Université de Fribourg, Rapporteure
Fribourg, 29 mai 2009
Le Directeur de thèse : Le doyen : Prof. Dr. Jean-Claude Dousse Prof. Dr. Titus Jenny
Ph. D. Thesis M. Szlachetko
Contents
Abstract………3
Résumé……….7
Part I: The DuMond curved crystal spectrometer
1. Introduction………132. Bragg law and structure factor………...18
3. The DuMond crystal spectrometer of Fribourg.……….22
3.1 Spectrometer design.………...22
3.1.1 Overview of the instrument.……….22
3.1.2 Target chamber.………26
3.1.3 Crystal and crystal rotation mechanism.………...28
3.1.4 Optical laser interferometer.……….32
3.1.5 Collimator and collimator rotation mechanism.………...36
3.1.6 Detectors.………..39
3.1.7 Driving and acquisition electronics………..41
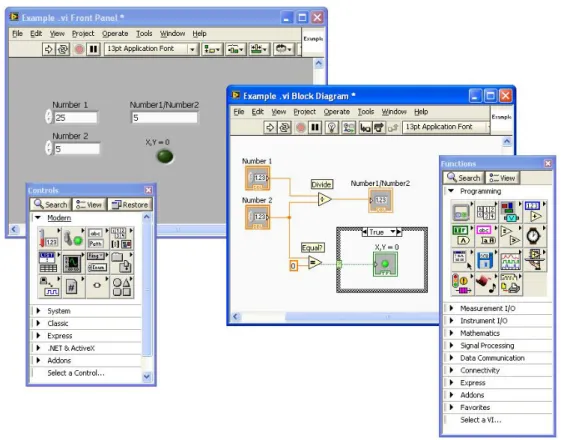
3.2 LabVIEW software……….43
3.2.1 General description………..43
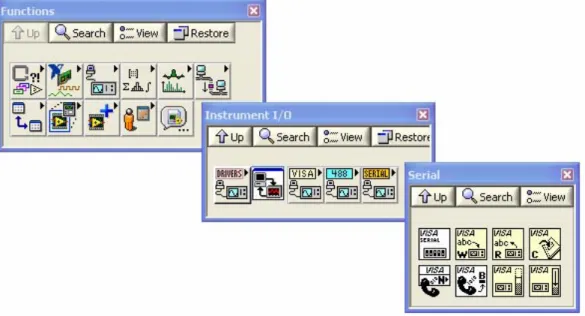
3.2.2 Serial port communication………...45
3.2.3 Communication with the DAQ card………..…..48
3.3 Data acquisition.……….………...…………..51
3.4 Data analysis………54
4. Examples of measurements.………57
4.1 Spectrometer resolution.………..57
4.1.1 Standard method to determine the instrumental broadening of the spectrometer……….………..57 4.1.2 Dependence of the spectrometer resolution on the slit width,
Ph. D. Thesis M. Szlachetko
focal distance and diffraction order……….59
4.1.3 Novel self–consistent method to determine the spectrometer resolution………..62
4.2 Spectrometer sensitivity.……….69
4.3 Spectrometer precision….………...72
4.4 Additional examples of applications…….………..76
4.4.1 Measurements of the Au L x–ray lines series….……….…76
4.4.2 Determination of the mass attenuation coefficient of molybdenum around the K–absorption edge……….……….….85
5. Conclusion……….…..91
6. Bibliography………....93
Part II Photoinduced K
hypersatellite x–ray lines of molybdenum
1. Introduction………...1012. Experimental method and measurements.………...105
3. Data analysis……….112
4. Results and discussion………...115
4.1 Energies……….115
4.2 Natural line widths………....118
4.3 h 1 K to h 2 K intensity ratio………..………...120
4.4 Hypersatellite line–to–diagram line intensity ratio I(Kαh)/I(Kα)………..122
5. Conclusion……….126 6. Bibliography………..127 Acknowledgments……….133 Curriculum vitae………135 List of publications………137
Abstract
Ph. D. Thesis M. Szlachetko
The present Ph.D. thesis includes two research projects in the field of Atomic Physics. The first project concerns the high–resolution transmission curved crystal spectrometer of the DuMond type installed at the University of Fribourg. The construction details and more specifically the developed software for the spectrometer control and data acquisition as well as the operation characteristics and performances of the spectrometer are presented. The second part is devoted to the study of the Kα hypersatellite lines of molybdenum induced by photon impact. From these measurements the energies, linewidths and the intensity ratio of the h
1
K to h 2
K hypersatellite lines, as well as the K– shell double photoionization probability were deduced and compared to theoretical and other experimental values.
Curved crystal x–ray spectrometers have proved to be important tools in atomic structure studies and x–ray transition metrology. The high energy resolution and precision of crystal x–ray spectrometers permit to resolve the complex x–ray spectra. The first project of the present thesis concerns the transmission–type bent–crystal spectrometer that was constructed several years ago at the Physics Department of the University of Fribourg. In the present work, to modernize the spectrometer control and acquisition system, the obsolete PEP Modular Computer System was replaced by a PC and a new LabVIEW– based user–friendly software for the control and data acquisition was developed. First, the spectrometer design and construction details including the target chamber, the crystal bending device and rotation mechanism, the optical laser interferometer, collimator, detectors and the driving and acquisition electronics as well as the developed LabVIEW– based software are presented. In order to check the operational characteristics of the spectrometer equipped with the new control software, the energy resolution, sensitivity and precision of the instrument were determined.
The instrumental response of the spectrometer was obtained from the measurements of the gadolinium Kα1 (2p3/2 → 1s1/2) x–ray emission line. For this purpose
a metallic Gd sample was irradiated with the bremsstrahlung produced by a Au–anode x– ray tube operated at 80 kV and 30 mA. It was found that the instrumental response of the spectrometer which depends mainly on the slit width, the crystal mosaicity and the precision of the crystal curvature is well reproduced by a Gaussian function with the
Ph. D. Thesis M. Szlachetko
standard deviation σ = 4.75 ± 0.02 arcsec of angular resolution. It was demonstrated that the slit–to–crystal distance should be optimized for each measured x–ray line in order to obtain the best resolution. It was also shown that the instrumental energy resolution of the spectrometer can be improved by measuring the x–ray spectra in higher orders of reflection. Moreover, a numerical method to determine the spectrometer resolution and natural linewidth of an x–ray transition was developed. It is based on measurements of an x–ray emission line in five different orders of reflection and solving a set of equations by means of the nonlinear least–squares method. A Gd Kα1 natural linewidth of 26.18 ± 0.09 eV was obtained, the accuracy of which is much better compared to the recommended value of 26.12 ± 1.77 eV. In order to test the sensitivity of the spectrometer (high luminosity with low background conditions) the very weak Gd Kα3 (2s1/2 → 1s1/2) x–ray
emission line was observed. The obtained Kα3 energy and the I(Kα3)/I(Kα1) intensity ratio of (1.61 ± 0.11) × 10-4 were found to be in good agreement with experimental results for neighboring elements and theoretical predictions. The K–L2, K–M3 and L2–M3 transitions
of Au were then measured to probe the precision of the spectrometer by means of the Ritz combination principle.
Further, the performance of the x–ray spectrometer was probed by measuring the
L–series lines of gold. These measurements were carried out in the direct geometry, i.e.,
the Au anode of the x–ray tube served as the target. The energies and the linewidths of 13 Au L x–ray emission lines were extracted and compared to the other existing theoretical and experimental values. In addition the Lβ2' and Lβ2" satellites of the Lβ2 (L3–N5) x–ray
line were observed and the obtained energies were found to be in good agreement with other experimental data. It should be mentioned that in this direct geometry it was possible to observe x–rays with energies down to 9.7 keV corresponding to the Au Lα1,2 (L3–M4,5)
x–ray transitions. In fact, the x–ray spectrometer angular range of ± 20 deg. corresponds theoretically to the minimum photon energy of 7.5 keV for the quartz crystal (110) reflecting planes in the first order of reflection. However, as for photon energies below about 10 keV the absorption of x–ray radiation in the crystal plate increases drastically, the transmission–type spectrometers are usually not employed for these energies, the lowest energy for most of them being even about 20 keV. Finally, the spectrometer was used to determine the absorption mass coefficient around the K–absorption edge for molybdenum
Ph. D. Thesis M. Szlachetko
(Z = 42). The obtained results were compared with existing data measured with monochromatic synchrotron radiation. A very good agreement between both datasets was found. Further, the binding energy of the Mo 1s atomic level was determined. A value of 20.00018(36) keV, in very good agreement with the tabulated ones, was obtained.
The second part of the thesis is devoted to the photoinduced Kα hypersatellite x– ray lines of molybdenum. The Kαh hypersatellites (1s-2 1s-12p-1) spectra result from the
radiative decay of the K–shell double vacancy states. The experiment was performed by means of high resolution x–ray emission spectroscopy using the Fribourg transmission type DuMond curved crystal x–ray spectrometer and the gold anode x–ray tube operated at 90 kV as the x–ray source. In general, the very low double photoionization cross sections for high–Z elements, as well as the presence of the Kα diagram line tails in the K x–ray hypersatellite energy region and the x–ray tube bremsstrahlung related background and also the low photon flux, make the measurements of the K x–ray hypersatellite spectra quite challenging and time consuming. In fact, the hypersatellite high–resolution x–ray emission spectrum of Mo induced by photon impact using a conventional x–ray source was measured for the first time.
Two sets of measurements were performed, namely with and without additional absorbers between the x–ray tube and the Mo sample. The absorbers served to reduce the background level in the region of the hypersatellite lines by cutting down the part of the bremsstrahlung below the K–shell double ionization threshold (~40 keV). The choice of the proper absorbers and optimal thicknesses of the lattes were based on calculations of the x–ray tube intensity response. From the measured x–ray hypersatellites spectra the energies, linewidths and the intensity ratio of the h
1
K to h 2
K were obtained. The energies and natural linewidths were found to be consistent, within the experimental uncertainties, with the MCDF (Multi–Configuration Dirac–Fock) calculations and the few existing data from electron and ion–collision studies. The h
1
K to h 2
K intensity ratio probes the intermediacy of the coupling. The extracted value of 1.4 ± 0.5 was found to be close to theoretical and other available experimental data. Moreover, the ratio of the double to single photoionization cross section was derived from the hypersatellite to diagram line intensity ratio. Since a polychromatic x–ray source was used, the differences
Ph. D. Thesis M. Szlachetko
in the average photon energies and the number of photons for the single– and double– ionization cross sections were accounted for. A value of 1.72 × 10⁻⁴ was obtained for the ratio which was found to be two times smaller than the single other experimental data existing for Mo.
Ph. D. Thesis M. Szlachetko
Ce mémoire de thèse comprend deux projets de recherche dans le domaine de la physique atomique. Le premier projet concerne le spectromètre à cristal courbé DuMond installé dans le bâtiment de physique de l’Université de Fribourg. Les détails de construction de cet instrument et plus spécifiquement le nouveau logiciel développé pour la conduite du spectromètre et l’acquisition des données sont présentés. Les propriétés du spectromètre et ses performances sont également décrites à l’aide de quelques exemples d’application. Le second projet est consacré à l’étude des raies X hypersatellites h
2 , 1 K du molybdène induites par photoionisation. A partir des mesures effectuées, les énergies et les largeurs naturelles de ces transitions ont été déterminées et comparées aux données expérimentales et théoriques existantes. Le rapport d’intensité I( h
1
K )/I( h 2
K ) ainsi que le rapport des sections efficaces de double et simple photoionisation photo
K photo KK /
ont
également pu être déduits des mesures.
Les spectromètres à cristal courbé ont prouvé leur importance dans les études de structure atomique et de métrologie de rayons X. Le pouvoir de résolution élevé de ces instruments ainsi que leur précision permettent en effet de résoudre des spectres de rayons X complexes. Le premier volet de cette thèse de doctorat concerne un spectromètre à cristal courbé de type Laue construit au Département de Physique de l’Université de Fribourg il y a quelques années. Dans ce travail, l’ancien système de commande du spectromètre et d’acquisition de données, le PEP Modular Computer System, a été remplacé par un PC et un nouveau logiciel, basé sur le système LabView, a été développé. Cette première partie de la thèse décrit tout d’abord le spectromètre dans son ensemble puis passe en revue les différents composants de l’instrument: la chambre à cible, le système utilisé pour courber le cristal et le mécanisme de rotation de ce dernier, l’interféromètre à laser, le collimateur, le système de détection, l’électronique de commande du spectromètre et celle pour l’acquisition des données ainsi que le nouveau logiciel basé sur LabView. Afin de vérifier les caractéristiques opérationnelles de l’appareil et jauger ses performances avec le nouveau logiciel de commande et d’acquisition, la résolution en énergie du spectromètre, sa sensibilité et sa précision ont été déterminées.
Ph. D. Thesis M. Szlachetko
du gadolinium. Pour cela, une cible métallique de Gd a été irradiée au moyen du Bremsstrahlung d’un tube de rayons X. Il a été montré que la réponse instrumentale qui dépend principalement de la largeur de la fente placée devant la cible, de la mosaïcité du cristal et de la précision de sa courbure, est bien reproduite par une Gaussienne ayant un écart–type angulaire = 4.75 0.02 arcsec. Les variations de la résolution instrumentale en fonction de la distance focale du cristal et de l’ordre de diffraction sont également démontrées. De plus, une nouvelle méthode auto–consistante pour déterminer la résolution du spectromètre a été développée. Elle est basée sur la mesure d’une raie X en cinq ordres de diffraction et la résolution du système surdéterminé d’équations résultant de ces mesures par une méthode des moindres carrés non–linéaire. En plus de la réponse instrumentale, cette méthode fournit la largeur naturelle de la raie X mesurée. Une valeur de 26.18 0.09 eV a par exemple été obtenue pour la raie K1 du Gd choisie pour tester la méthode, une valeur vingt fois plus précise que la valeur recommandée de 26.12 1.77 eV. Afin de vérifier la sensibilité du spectromètre, la transition interdite K3 (2s1/2 →
1s1/2) du Gd dont l’intensité est extrêmement faible a été mesurée. L’énergie de la
transition et le rapport d’intensité I(Kα3)/I(Kα1) = (1.61 0.11) × 10-4 obtenus sont en bon
accord avec les valeurs expérimentales trouvées pour des éléments voisins et les résultats théoriques. Les transitions K–L2, K–M3 et L2–M3 de l’or ont ensuite été mesurées pour
vérifier la précision du spectromètre à l’aide du principe de combinaison de Ritz.
Deux autres projets ont encore été réalisés pour contrôler les performances de l’instrument. Le premier a consisté à mesurer la série des rayons X L de l’or. Les énergies et largeurs naturelles de 13 transitions L ont pu être déterminées et comparées à d’autres valeurs existantes. En particulier, les satellites Lβ2' et Lβ2" de la raie Lβ2 (L3–N5) ont pu
être résolus. La transition Lα1,2 (L3–M4,5) dont l’énergie n’est que de 9.7 keV a pu être
observée. En fait, le domaine angulaire de 20 degrés couvert par le spectromètre et la constante réticulaire des plans de diffraction du cristal de quartz utilisé devraient permettre de mesurer des photons de 7.5 keV en premier ordre. Néanmoins, en raison de la très forte absorption des photons par les cristal en dessous de 10 keV, les spectromètres de type Laue ne sont en général pas employés à ces énergies, la plupart d’entre eux étant limités à la mesure de photons d’énergie supérieure à 20 keV. Dans le second projet, le spectromètre a été utilisé pour mesurer le coefficient d’absorption du molybdène (Z = 42)
Ph. D. Thesis M. Szlachetko
dans la région du bord K. Les résultats obtenus ont été comparés avec ceux d’une autre expérience réalisée auprès d’une source de rayonnement synchrotron. Un très bon accord a été observé. D’autre part, à partir de ces mesures, l’énergie de liaison de la couche K du Mo a pu être déterminée. Une valeur de 20.00018(36) a été trouvée, en parfait accord avec les valeurs de référence existantes.
La seconde partie de la thèse est une étude des raies hypersatellites Kh (1s-2 1s-12p-1) du Mo induites par photoionisation. Ces rayons X résultent de la désexcitation radiative d’états atomiques comprenant deux lacunes dans la couche K. L’expérience a été effectuée avec le spectromètre DuMond et un tube de rayons X avec anode d’or travaillant à 90 kV. En général, à cause des très faibles sections efficaces de double photoionisation K ainsi que de la présence dans la région d’énergie des hypersatellites des queues lorentziennes des raies diagrammes et du bruit de fonds résultant de la diffusion élastique par la cible des photons de bremsstrahlung du tube de rayons X, la mesure d’hypersatellites d’éléments mi–lourds utilisant un tube de rayons X pour la production de la fluorescence représente un défi expérimental particulièrement ardu. En fait, à notre connaissance, les mesures d’hypersatellites présentées dans ce travail sont les premières du genre.
Deux séries de mesures ont été réalisées, l’une sans absorbeur, l’autre avec un absorbeur formé de feuilles de niobium et d’yttrium superposées et placées entre le tube de rayons X et la cible de molybdène. Le rôle de l’absorbeur était d’améliorer le rapport signal–bruit en diminuant fortement le bruit de fonds dans la région d’énergie des hypersatellites. Plus précisément, la feuille de Nb servait à atténuer l’intensité des photons de bremsstrahlung ayant une énergie proche de celle des hypersatellites alors que la feuille d’Y servait à atténuer l’intensité des raies diagrammes et du même coup celle de leurs queues lorentziennes. A partir des spectres mesurés, les énergies et les largeurs naturelles des deux raies hypersatellites ainsi que le rapport d’intensité I( h
1
K )/I( h 2
K ) ont pu être déterminés. Un bon accord avec les rares autres données expérimentales existantes et avec les résultats de calculs MCDF a été observé pour les énergies et les largeurs naturelles. Pour le rapport d’intensité, une valeur de 1.4 0.5 a été trouvée, laquelle est également consistante avec les prévisions théoriques et les valeurs expérimentales obtenues par
Ph. D. Thesis M. Szlachetko
d’autres auteurs. Enfin, le rapport des sections efficaces photo K photo KK /
a pu être déduit du rapport d’intensité I(Kαh)/I(Kα) corrigé préalablement pour la différence entre les énergies moyennes des photons de bremsstrahlung contribuant à l’ionisation simple, respectivement double, et pour les nombres différents de ces photons. Une valeur de 1.72 × 10⁻⁴ a été trouvée pour le rapport des sections efficaces, un résultat deux fois plus petit que la seule autre valeur expérimentale existante dans la littérature pour le Mo.
Ph. D. Thesis M. Szlachetko
Part I:
The DuMond curved crystal
spectrometer
Ph. D. Thesis M. Szlachetko
Ph. D. Thesis M. Szlachetko
For the detection of x–rays or γ–rays energy dispersive or wavelength dispersive instruments can be used. Gas proportional counters, scintillation detectors or semiconductor diodes belong to the first category while crystal spectrometers belong to the second one. Crystal spectrometers are characterized by a high resolving power of the order of 10-4 which is much better than the one of energy–dispersive detectors (10-1–
10-2), a high precision and a good sensitivity. In contrast to that the efficiency of the wavelength dispersive detectors is much smaller than the one of energy dispersive detectors, mainly because of the small solid angles characterizing crystal spectrometers.
Many different types of crystal spectrometers have been developed until now. Flat crystal spectrometers provide the highest resolution and precision but their luminosity is extremely weak. To increase the solid angle, the crystal plate can be bent, cylindrically or spherically. Bending the crystal results in luminosity enhancements as big as 102–103 with, however, some losses in the resolution, due to the geometrical aberrations related to imperfections in the curvature of the crystal plate and the quasi–mosaicity induced in the crystal lamina by the bending torque. For both flat and curved crystal spectrometers, Laue type (also named transmission type) and Bragg type (reflection type) instruments do exist. In Bragg type spectrometers the diffraction planes are parallel to the surface of the crystal exposed to the incoming radiation, whereas for Laue type spectrometers the diffraction planes are normal to the exposed surface. In the Laue case the photons have thus to travel through the crystal thickness to reach the detector. As a result, the intensity of the diffracted radiation is attenuated, being partly absorbed by the crystal. This absorption grows drastically when the photon energy decreases. For instance, for a 1 mm thick quartz plate, the absorption amounts to 4.0% at 100 keV, 46.3% at 20 keV and 99.3% at 10 keV! For this reason, transmission type crystal spectrometers cannot be employed for photon energies below about 10 keV. On the other hand, due to geometrical constraints related to the spectrometer design, the minimum Bragg angles sustainable by reflection type crystal spectrometers cannot be below about 20 deg. For standard crystals such as quartz, silicon and germanium with typical spacing lattice constants 2d 3–5 Å, Bragg angles 20 deg. correspond to photon energies E 7–12 keV so that Bragg type crystal spectrometers are usually employed for measuring photons below about 10 keV. In that sense Bragg type and Laue type crystal spectrometers can be considered as complementary high–resolution
Ph. D. Thesis M. Szlachetko
instruments.
Most reflection type curved crystal spectrometers are operated in the Johann [1], Johansson [2] or von Hamos geometry [3–5], whereas for transmission type curved crystal spectrometers the DuMond [6] and Cauchois [7] geometries are the most commonly employed. For most geometries data collection is performed point by point: the angle between the crystal and the incoming radiation is increased step by step around the Bragg angle, the intensity of the diffracted radiation being measured for each angular step. The total acquisition time needed to measure a whole x–ray or γ–ray spectrum which is then given by the number of points in the spectrum multiplied by the acquisition time per point is rather long as compared to energy dispersive detectors. In the von Hamos geometry, for a fixed position of the crystal and detector, a certain angular range is covered by the crystal so that a whole energy interval can be measured at once. In this geometry, however, a position sensitive detector is needed and the width of the covered energy interval which depends on the Bragg angle is limited by the detector extension in the dispersive direction.
Curved crystal spectrometers of transmission type have proved to be an important tool in x–ray spectroscopy of transitions to the K–shell and L–subshells of heavy elements (Z > 40). For the metrology of x–ray transitions, in which the natural line widths and the energies of the transitions are of interest, an instrumental broadening comparable to the widths of the atomic levels involved in the transitions and a relative precision of 10-6 are
indeed needed. Furthermore, in the K and L x–ray spectra of multiply ionized heavy atoms, the radiative decay of the multiple inner–shell vacancy states leads to the occurrence in the spectra of satellite x–ray lines which can be only resolved from their parent diagram lines by means of high–resolution instruments such as Laue type crystal spectrometers. The same holds for –ray spectroscopy measurements of odd–odd unstable nuclei. To unravel the spectra of such radioactive isotopes characterized by large densities of close–lying –rays, the use of high–resolution instruments is also mandatory.
A major progress in determining the energy and intensity of electromagnetic radiation in complex spectra was made by DuMond in 1947 [6] with his development of the line source curved crystal transmission spectrometer. The DuMond geometry, in which the crystal is bent cylindrically, requires that the radius of curvature of the crystal is equal
Ph. D. Thesis M. Szlachetko
to the diameter of the so–called Rowland circle (focal circle) and that the center of the radiation source and the center of the crystal are located on opposite sides of the Rowland circle. If these geometrical conditions are fulfilled, then for a particular photon energy the Bragg law is satisfied over the whole area of the crystal. In the original DuMond spectrometer a quartz crystal plate of dimensions 80 × 70 × 1 mm3 was bent to a radius of 2 meters with the (310) reflecting planes normal to the surface. During the measurement the source of radiation was moved along the focal circle and the intensity of the diffracted radiation, transmitted through the crystal, was measured for each position of the source by a dedicated multi–cellular Geiger–Müller counting tube of high efficiency. To shield the detector from the directly transmitted and the scattered radiation beams, a multiple–slit collimator was inserted by DuMond between the bent crystal and the detector. This collimator allowed him to extend his measurement to the domain of small Bragg angles, i.e. to the high energy region. The spectrum was constructed by plotting the detector count rate as a function of the Bragg angle, i.e. the angle between the incident x–ray beam and the reflecting planes of the crystal.
Since that pioneering work many spectrometers based on the DuMond geometry have been constructed [8–16]. In most of them the radiation source is no longer a –ray radioactive source as in the case of DuMond but a target placed in a beam line of a nuclear reactor (for n– spectroscopy measurements), a heavy–ion (HI) accelerator (for HI– induced nuclear reactions or HI–induced multiple atomic inner–shell ionization studies) or a synchrotron radiation facility (for photoionization and metrology of x–ray transition measurements and resonant elastic and inelastic scattering experiments). In all these applications, the source can no longer be moved along the Rowland circle to vary the Bragg angle. For in–house experiments employing x–ray tubes or electron guns for the production of the target x–ray fluorescence, the samples have also to be kept fixed to avoid a new adjustment of the x–ray tube or electron gun after each target displacement. The Bragg angle is then varied by rotating the crystal and the detector around the same axis passing through the center of the crystal plate. When the crystal is rotated by an angle , the detector has to be rotated by 2. Furthermore, as the Rowland circle rotates with the crystal, after a crystal rotation the source of radiation is no longer on the focal circle and the apparent width of the source becomes wider, which leads to a resolution loss of the
Ph. D. Thesis M. Szlachetko
instrument. In DuMond spectrometers operated with a fixed source, the focusing distance, i.e. the distance between the crystal and the source, has therefore to be adjusted whenever the defocusing distance resulting from the change in the Bragg angle exceeds a value of the order of R/1000, where R is the radius of curvature of the crystal.
Thanks to the considerable developments made during the last decades in electronics and informatics modern DuMond crystal spectrometers are now equipped with sophisticated detector systems and the Bragg angles are determined with high accuracy by means of laser interferometers. Recent spectrometers are operated in a fully automatic way by computers which control also the data acquisition. Regarding the crystals, the know– how acquired at synchrotron radiation facilities in the preparation of ultra pure crystals and development of new bending devices have been also of great benefit. However, despite these improvements the basic mechanical design and the working principles of modern spectrometers have remained essentially the same as those of the DuMond prototype.
In the first part of this thesis the high–resolution DuMond type curved crystal spectrometer installed at the University of Fribourg and more specifically the new software that was developed to operate this instrument are presented. The spectrometer which was constructed several years ago for high–resolution studies of photoinduced x– ray spectra can be used for photon energies above about 10 keV. Thanks to its very good energy resolution (about 3 eV at 15 keV) and high precision (about 0.003 eV at 15 keV), this spectrometer represents an ideal tool for the metrology of K and L x–ray transitions of heavy elements. Furthermore, the very low background of the instrument (410-3 count
s-1keV-1 at 10 keV and 10-3 counts-1keV-1 above 20 keV) makes it particularly adequate
for the measurements of x–ray emission lines which are characterized by extremely low transition probabilities. Initially, the spectrometer and the data acquisition were controlled by a PEP Modular Computer System. Because of the high costs related to the maintenance of this old computer and the increasing difficulties to find spare parts for it as well as because the software was not really user friendly, a new LabVIEW–based software was developed to control the spectrometer and acquire data via a standard PC.
A brief reminder of the basic principles of x–ray diffraction by crystals is given in Sect. 2. Construction details and performances of the DuMond curved crystal spectrometer along with the new LabVIEW program are described in Sect. 3, whereas several examples
Ph. D. Thesis M. Szlachetko
of applications are presented in Sect. 4.
Ph. D. Thesis M. Szlachetko
In a crystal the atoms are uniformly placed in virtual, regularly spaced, parallel planes. Because the wavelength of x–rays (from about 0.1 nm to about 10 nm) or γ–rays (less than about 1 nm) is comparable to the spacing between atoms in the crystal, they are ideally suited for probing the structural arrangement of atoms in materials. With visible light it is not possible to investigate the crystalline structure because visible light has wavelengths much larger that the distance between the atoms in a crystal. For example yellow light has a wavelength of 570–580 nm, whereas the distance between the nearest atoms in a NaCl crystal is only 0.28 nm. Furthermore, energetic x–rays or γ–rays can penetrate into the materials and provide information about their bulk structure.
In x–ray or γ–ray spectrometry it is the energy of the radiation rather than the wavelength which is of interest. The wavelength λ [Å] of the x–ray or γ–ray as a function of the photon energy E [keV] is given by the relation:
keV , E Å keV 398419 . 12 Ε c h λ (1)where h is the Planck constant and c the velocity of light in vacuum.
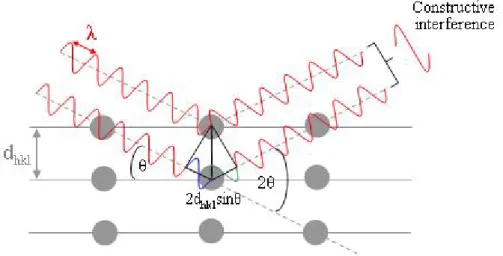
The x–rays or γ–rays are diffracted by the crystal. The condition for a constructive interference after the diffraction by different atomic planes of the crystal is given by the Bragg equation:
2dhklsin n, (2)
where n is the order of diffraction, λ the wavelength of the incident x–rays or γ–rays and dhkl is the lattice constant of the crystal for the diffraction planes corresponding to the Miller’s indices (hkl), i.e. the distance between adjacent (hkl) planes. For cubic crystals
such as silicon and germanium, the spacing lattice constant dhkl is given by [17]:
, l k h a d 2 2 2 hkl (3)
Ph. D. Thesis M. Szlachetko
FIGURE 1: Schematic diagram for determining the Bragg law. The beam diffracted from the second plane travels a distance 2dsinθ longer than the beam reflected from the first plane.
For hexagonal crystals like quartz (SiO2), dhkl can be obtained from [17]:
, c l a 3 k hk h 4 1 d 2 2 2 2 2 hkl (4)where a and c are the crystal constants (for SiO2, a = 4.91304 Å and c = 5.40463 Å). The
Bragg equation shows that the path difference 2dsinθ for waves diffracted by different
atomic planes should be equal to an integer number of the wavelengths λ [see Fig. 1].
When a constructive interference occurs the diffracted beam of x–rays or γ–rays leaves the crystal under an angle equal to the one of the incident beam. For a given wavelength and diffraction order constructive interferences are only possible for a given incident angle. Each angle corresponds thus to a particular wavelength and diffraction order and varies with the lattice spacing constant of the crystal. The two geometries in which the Bragg condition can be realized are shown in Fig. 2. The diffraction geometry shown in Fig. 2a is commonly referred to as the Bragg or reflection case, while the one shown in Fig. 2b is called the Laue or transmission case.
The Bragg law is a necessary but not sufficient condition to observe constructive interferences. Actually, the amplitudes and relative phases of the x–rays scattered by the
Ph. D. Thesis M. Szlachetko
FIGURE 2: Bragg (a) and Laue (b) diffraction cases.
individual atoms in the unit cell are given by the crystal structure factor Fhkl defined by:
F f e2 ihxj kyj lzj, N 1 j j hkl
(5)where fj stands for the atomic scattering factor of the j–th atom whose position in the unit
cell is given by the coordinates xj, yj, zj and N is the number of atoms in the unit cell of the
crystal. The atomic scattering factor fj corresponds to the ratio between the amplitude scattered by the atom j and the one scattered by an isolated electron, under identical
conditions. Clearly the maximum value that fj can have is Z (atomic number of the atom j).
When fj = Z all the electrons scatter in phase with each other. As the intensity of a wave is
given by the squared amplitude of the latter, the intensity of the photon beam diffracted by the planes (hkl) is proportional to the square of the modulus of the structure factor Fhkl: Ihkl Fhkl2 Fhkl Fhkl, (6)
where * hkl
F is the complex conjugate of Fhkl. For face centered cubic crystals like silicon and germanium, the structure factor Fhkl 0 only when all Miller indices are odd or all are even. In other words, for face centered cubic crystals there is no diffracted intensity if the Miller indices are mixed. For instance, no reflection is observed for the (110) planes of Ge
Ph. D. Thesis M. Szlachetko
but a strong reflection is observed for Ge(220) which is equivalent to Ge(110) in second order of diffraction (n = 2 in the Bragg law). For hexagonal crystals like quartz (SiO2),
reflection by ( planes is only possible when 00 ) is a multiple of 3. For most common crystals, the structure factors Fhkl can be calculated with the computer code XOP [18].
Ph. D. Thesis M. Szlachetko
3. The DuMond crystal spectrometer of Fribourg
3.1. Spectrometer design
3.1.1 Overview of the instrument
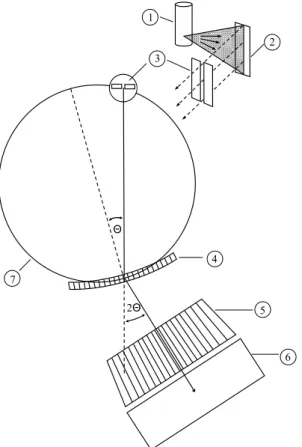
In the DuMond geometry, the radiation source must be a line–like source. For this reason the radioactive source or the irradiated target should be very thin (0.01–0.10 mm) and perfectly aligned with the source–crystal direction. In order to achieve an acceptable source strength, the tiny target width is compensated by a large depth (5 mm). This target geometry which was introduced by DuMond represents still the standard geometry for – ray measurements. For x–rays, however, whose energies are in general lower than those of –rays, this geometry is less appropriate because the x–rays produced in the depth of the target are almost fully absorbed by the target itself. Therefore, for x–ray spectroscopy measurements the spectrometer is usually operated in the so–called modified DuMond slit geometry. In this geometry represented schematically in Fig. 3, a narrow rectangular slit is placed on the focal circle at a fixed position and serves as the effective source of radiation. The target placed behind the slit can be tilted around a vertical axis to make a certain angle with respect to the target–crystal direction. For a given x–ray line, the angle is chosen so that the highest counting rate is obtained in the spectrometer detector. The variation of the counting rate as a function of the target alignment depends on the self–absorption of the x– rays in the target and the size of the target surface viewed by the crystal through the slit. Both quantities decrease with growing angles but with opposite effects on the counting rate. Two further advantages are provided by this geometry: first the slit width can be adjusted to obtain the desired instrumental resolution and secondly the line shapes of the measured x–rays are no more affected by thermal deformations of the target.
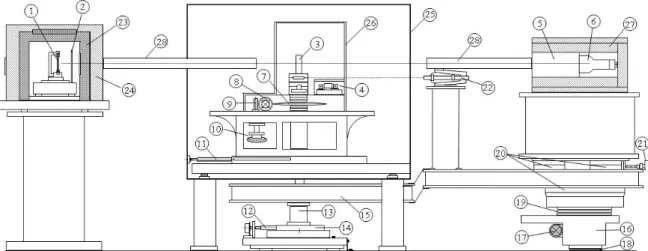
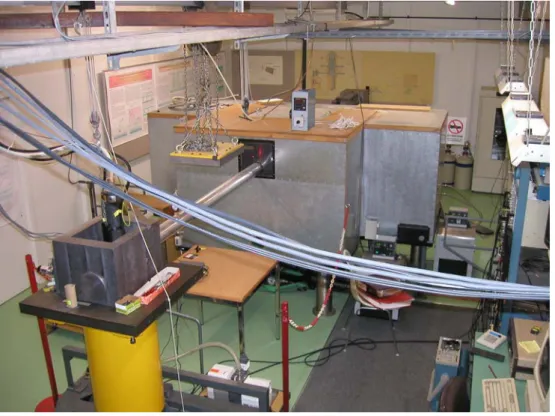
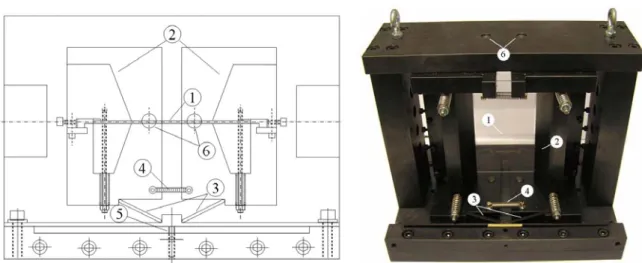
A side view of the spectrometer is shown in Fig. 4. The most important parts of the instrument are the target chamber, crystal, optical laser interferometer, collimator and detector which are described in more details in the next sub–sections. A photograph of the spectrometer is presented in Fig. 5. The x–rays diffracted by the curved crystal are recorded by a Phoswich scintillation detector. In front of the detector a Soller slit collimator permits to shield the detector from the radiation coming directly from the
Ph. D. Thesis M. Szlachetko 2 Θ 1 3 4 7 2Θ 6 5
FIGURE 3: Schematic drawing of the modified DuMond slit geometry: (1) x–ray tube, (2) target, (3) slit, (4) cylindrically bent crystal, (5) Soller slit collimator, (6) detector and (7) focal circle.
source. The Bragg angles are measured by means of an optical laser interferometer with a precision of approximately 510-3 arcsec. The most temperature–sensitive elements of the
spectrometer, namely the laser interferometer and the bent crystal, are enclosed in a double thermostatic housing which keeps their temperature constant around 23 °C with a precision better than 0.05 °C. The angular range covered by the spectrometer is ± 20 deg. For the (110) reflecting planes of a quartz crystal (d ≈ 2.456 Å) this maximum angle of 20 deg. corresponds theoretically to a minimum photon energy of about 7.5 keV in first order of reflection. Actually, due to the absorption of the x–rays in the crystal, the true minimum energy lies somewhat higher (at about 9 keV, see Sect. 4).
As the diffraction planes are not exactly perpendicular to the front surface of the crystal plate (depending on the crystal, cut errors of several minutes of arc can be observed), two different “zero” positions of the spectrometer are defined. The first one called the “mechanical zero position” corresponds to the position at which the laser
Ph. D. Thesis M. Szlachetko
FIGURE 4: Side view of the DuMond crystal spectrometer: (1) target, (2) slit, (3) crystal, (4) optical laser interferometer, (5) Soller slit–collimator, (6) detector, (7) large tooth wheel, (8) small tooth wheel and second worm gear (behind), (9) first worm gear, (10) stepping motor for the crystal rotation, (11) screw rod for the crystal focusing, (12) screw rod for the detector axis focusing, (13) detector rotation spindle, (14) movable table of the detector rotation spindle, (15) detector rotation arm, (16) detector automotive carriage, (17) step motor of the detector carriage, (18) circular rail, (19) large ball bearing, (20) Schneeberger minirails, (21) manual adjustment of the collimator position, (22) laser of the detector position optical tracking system, (23) target chamber, (24) lead shielding, (25) external thermostatic housing, (26) internal thermostatic housing, (27) lead shielding, (28) evacuated pipe.
interferometer has to be reset for a correct determination of the Bragg angles. This “mechanical zero position” which corresponds to the value of 1'000'000 in the electronic register CRY where the crystal position is saved (in units of motor steps) is fixed with
respect to the mechanical crystal rotation system. If for any reason, the electronic position is lost (for instance after a power supply failure) the correct “mechanical zero position” can be restored thanks to reference marks indicated on the stepping motor and both tooth wheels. The second “zero” position named the “spectroscopic zero position” corresponds to the origin of the Bragg angle scale. As the design of the spectrometer permits to rotate clockwise and anticlockwise the crystal and the detector, the “spectroscopic zero position” 0 can be simply determined by measuring the same line on both sides of reflection and using the following relation:
, 2 0 (7)
Ph. D. Thesis M. Szlachetko
where + and - are the Bragg angles corresponding to the line measured on the right (positive angles) and left (negative angles) sides of reflection. The “spectroscopic zero
position” is not constant and varies with the employed crystal and position of the slit. It varies also slightly with the focal distance, i.e. the distance between the crystal and the slit, so that a new determination of this “zero” has to be done whenever the focal distance of the spectrometer is changed.
As mentioned before to preserve the angular resolution of the spectrometer, the source of radiation, the slit in our case, should be kept on the focal circle when the crystal is rotated. As shown in Fig. 3 the distance f between the crystal and the slit is given by:
f Rcos, (8) where R stands for the radius of curvature of the crystal. The focal distance f is changed by
moving the whole crystal part, i.e. the crystal itself, the crystal rotation system and the laser interferometer, along the crystal–source direction with a screw rod driven by a step motor.
Ph. D. Thesis M. Szlachetko
The origin of the crystal focusing axis named FOC corresponds to a value of 100'000
[motor steps] in the position register of the motor driving the screw rod of the crystal focusing system. The change of the focal distance is 5 m per motor step. The origin of the axis (FOC = 100'000) was defined to correspond to a distance of 315 cm between the
crystal and the target. The positive direction of the axis was chosen to point towards the slit so that FOC values bigger than 100'000 correspond to focal distances smaller than 315
cm. As the slit is placed in front of the target at a distance d from it, the FOC value
corresponding to the Bragg angle is given by:
FOC 100'000
5104
cm Rcm cos d
cm 315
cm, (9a)
. 10 5 cm d cos cm R 315 000 ' 100 steps FOC 4 (9b)As in the DuMond geometry the rotation spindles of the crystal and detector should remain coaxial, the spindle of the detector should be also moved when the FOC value is
changed. This is realized automatically with a step motor named FOP and a second optical
tracking system which forces the detector axis FOP to remain aligned with the FOC axis
during a focusing operation.
3.1.2 Target chamber
As mentioned before the x–ray source is defined by a rectangular slit located on the focal circle of the spectrometer at a fixed position. The slit is made of two juxtaposed lead plates which are 40 mm high, 6 mm width and 5 mm thick. The distance between the two plates, i.e. the slit width, can be adjusted. If the slit width is increased, a wider part of the target surface is viewed by the crystal and the luminosity of the spectrometer is enhanced but the instrumental resolution becomes worse. In most applications, the slit width is chosen to correspond to the best compromise between a high enough luminosity and an acceptable instrumental resolution. Typical employed slit widths are 0.05 mm, 0.10 mm and 0.15 mm.
Most targets consist of 27 mm high × 4 mm wide metallic foils. Thicknesses vary from 10-3 mm to 10-1 mm. The foils are kept stretched by a spring in a dedicated holder
Ph. D. Thesis M. Szlachetko
as shown in Fig. 6. Powder samples can also be used. They are prepared by dusting the powder onto a thin adhesive backing having similar dimensions as the metallic foils. The alignment and verticality of the targets can be adjusted by means of remote–controlled step motors named SAL (Source Alignment) and SVE (Source verticality). As mentioned
before, for a given x–ray line, the alignment angle of the target is chosen so that the highest count rate is obtained in the spectrometer detector. Similarly, the vertical position of the sample is optimized in order to get the best resolution. The latter is obtained when the vertical axes of the sample and diffraction planes of the crystal are parallel. The smallest angular steps that can be made with the SAL and SVE systems are 0.225 deg. and
0.00083 deg., respectively. The transverse position of the slit can also be adjusted via a third remote–controlled step motor (SLT). One step of the SLT motor produces a 1.0 m displacement of the slit along an axis perpendicular to the target–crystal direction. For optimal operation, the center of the slit should be located on the straight line joining the center of the target and the center of the crystal. For gaseous samples, the target holder is replaced by a 3 cm in diameter and 3 cm high circular cell with an 11 mg/cm2 thick kapton wall. Gas pressures up to 3 bars can be used. Other target cells with metallic or polymeric walls were developed for liquid targets such as Hg. The distance d between the slit center
and the vertical axis of the solid target or the gaseous or liquid cell can be varied between 1.75 cm and 4.75 cm.
The target fluorescence is produced by irradiating the samples with the bremsstrahlung of side–window Coolidge–type x–ray tubes. Depending on the projects,
2
3 1
Ph. D. Thesis M. Szlachetko
x–ray tubes equipped with anodes of Au (1 mm Be window), Cr (0.5 mm Be window) and Sc (0.3 mm and 0.15 mm Be windows) can be used. The bremsstrahlung and the characteristic x–ray radiation of the tube are emitted in a cone having an aperture of about 30 deg. The x–ray tube is mounted vertically on a circular port on the top of the target chamber with the side–window in the direction of the target. The x–ray tube port can be rotated around a vertical axis passing through the center of the sample for performing angular distribution measurements. The angle between the axis of the x–ray tube beam and the target–crystal direction can be varied this way between 30 and 150 deg. with angular steps of 30 deg. The water–cooled x–ray tubes are connected to a 100 kV/3 kW high– voltage generator equipped with an automatic regulation system for the stabilization of the current and voltage.
The slit, the target and the nose of the x–ray tube are all enclosed in a 25 cm long × 25 cm wide × 15 cm high vacuum chamber with 2 cm thick iron walls. In the center of the front wall, a circular 0.2 mm thick mylar window permits the exit of the fluorescence x– rays. For safety reasons, the target chamber is enclosed in a 5 cm thick lead shielding and an automatic security system switches off the high–voltage generator if the x–ray tube port on the top of the target chamber or the two fences permitting the access to the rear part of the spectrometer are not closed. When the x–ray tube is on, the target chamber is pumped down to about 10-2 mbar with a rotary pump in order to minimize the oxidation of the sample, slit and target chamber walls.
3.1.3 Crystal and crystal rotation mechanism
The spectrometer can be equipped with different high–quality single crystals such as quartz, silicon or germanium. For x–ray measurements, quartz crystal plates are usually employed because, for the same thickness, the absorption is higher in silicon and even more in germanium. Several quartz crystal plates with different orientations and different thicknesses are available. For the present work a 100 mm high × 100 mm wide × 0.5 mm thick quartz was employed. The plate was cut so that the (110) diffraction planes were normal to the front surface. In general, the instrumental resolution can be improved by increasing the radius of curvature of the crystal, but because the solid angle is then smaller
Ph. D. Thesis M. Szlachetko
the collection efficiency decreases. On the other hand the luminosity loss can be compensated by choosing a larger crystal area, but this may result in geometrical aberrations when the crystal is bent. For these reasons, a radius of curvature of 315 cm was chosen as the best compromise between a high enough resolution and an acceptable luminosity.
The choice of the best crystal thickness depends on the reflectivity of the crystal and the absorption of the x–rays. The reflectivity grows with the crystal thickness as long as the latter is comparable to the extinction length (the length after which the intensity of the incident photons has decreased by a factor e 2.718). For x–rays with energies less than about 100 keV, the extinction length of quartz is of the order of several hundreds of m. Concerning the absorption, it is well known that the latter increases exponentially with the absorber thickness. Therefore a 0.5 mm thick quartz crystal was chosen as the best compromise.
In the standard bending technique, the crystal is pressed between two clamping blocks, machined out beforehand to have a precise convex cylindrical surface on the crystal side for the front block, respectively a concave cylindrical surface for the rear block. The crystal radius of curvature is determined by the radius of the cylindrical surfaces. Trapezoidal windows in the front and rear clamping blocks permit the transmission of the x–rays. The dimensions of these windows define the effective reflecting area of the crystal. To obtain a precise and constant curvature over the whole surface of the crystal, the latter should be very well polished and its thickness has to be constant at the level of about 0.01 m. Such conditions are almost impossible to satisfy with crystal laminas thinner than 1 mm so that thin crystal plates are difficult to bend with the standard bending technique. For this reason a novel dedicated bending device was developed. A schematic drawing and a photograph of this device are shown in Fig. 7. In this case the crystal (1) is clamped between two pairs of flat steel blocks (2). The two blocks of each pair are pressed together with two screws passing above, respectively below, the crystal plate. The force which maintains the two blocks together can be adjusted with two springs. The block pairs can rotate around the vertical axes (6). The latter are placed symmetrically with respect to the center of the crystal and the distance between them corresponds to one fourth of the crystal length. The bending torque is
Ph. D. Thesis M. Szlachetko
FIGURE 7: Schematic diagram (top view) and photograph (view from the backside) of the bending device: (1) crystal lamina, (2) clamping blocks, (3) lever arms, (4) restoring springs, (5) bending screw and (6) clamping block axes.
applied to the crystal via the pairs of clamping blocks through the lever arms (3) using the screw (5). The torque that should be applied depends on the thickness of the crystal plate and on the restoring force exerted by the two springs (4). The main difficulty here is to apply the torque as symmetrically as possible on both sides of the crystal. Only in this case the crystal will be given the correct cylindrical shape.
In principle, with the novel bending device, the whole height of the crystal can be used. However, as a result of the bending torque a second curvature along the vertical axis is induced in the crystal plate. The magnitude of this so–called saddle effect depends on the values of the elasticity tensor components of the crystal and on the particular orientation of the crystal cut. It leads to geometrical aberrations that increase with the vertical distance between the incidence point of the photon and the crystal center. As a consequence, the top and bottom parts of the crystal cannot be used if the best resolution is needed. For this reason, in most applications described in the present work (see Sect. 4), only the central part of the crystal was employed so that the effective reflecting area was 4 × 3 cm2 and the solid angle of the spectrometer about 1.2 × 10⁻⁴ sr. The two pairs of blocks are made of hardened stainless steel which is characterized by a long term mechanical stability. In addition the crystal and bending device are enclosed in a thermostatic house where the temperature fluctuations are kept below 0.05 °C throughout the year. This is needed to keep constant the crystal radius of curvature, any change of the latter resulting
Ph. D. Thesis M. Szlachetko
in a deterioration of the instrumental response of the spectrometer.
The crystal is rotated by means of a high precision two–stage tooth wheel mechanism (Fig. 8). The 100 mm in diameter rotation axis is mounted in a ball–cage bearing. Thanks to a static compression of the balls of 5 m, an accuracy of about 0.2 m is obtained for the crystal axis position. The crystal rotation is driven by a step motor and two worm gears in cascade. The big wheel fitted to the crystal axis has 360 teeth and is 440 mm in diameter. It is driven by the horizontal worm gear. The smaller wheel with 60 teeth is 120 mm in diameter and is driven by the vertical worm gear which is directly connected to the step motor. The total gearing ratio is 1:21'600 so that one motor step of 0.45 deg. corresponds to a crystal rotation of 0.075 arcsec. To minimize friction and thermal dilatations of the moving parts, the choice of the materials is crucial. The big tooth wheel is made of cast iron, the two worm gears of special hardened and polished steel and the small tooth wheel of a bronze alloy. Furthermore, in order to keep the backlash of the system at a small value, a constant restoring torque of about 2.5 Nm provided by a counterweight of lead is applied to the big tooth wheel. The reproducibility of the rotation mechanism was probed and found to be of the order of 0.15 arcsec, whereas the observed maximal nonlinearities amount to about 5 arcsec. Each crystal rotation is carried out via an acceleration – constant speed – deceleration sequence. In other words, the angular velocity of the step motor is first linearly increased up to a preset maximum value, kept then constant at this value as long as the angular difference with respect to the final position is smaller than 60 arcsec and finally decreased linearly from the maximum value down to a speed of a few steps/sec. when the final position is reached. The acceleration and deceleration ranges are 800 steps long and the maximum motor speed is 1400 steps/sec., which corresponds for the crystal rotation axis to an angular velocity of about 1/35 deg./sec. This mode of operation of the step motor permits a smoother and therefore more accurate rotation of the crystal.
As mentioned before the slit–to–crystal distance should be adjusted for each measurement in order to keep the x–ray source on the focal circle. On the other hand the crystal and collimator rotation axes have to be aligned in the vertical direction. For this reason, when the focusing distance is changed the crystal and the collimator axes have to be moved together. The collimator itself, however, must be kept fixed during the
Ph. D. Thesis M. Szlachetko
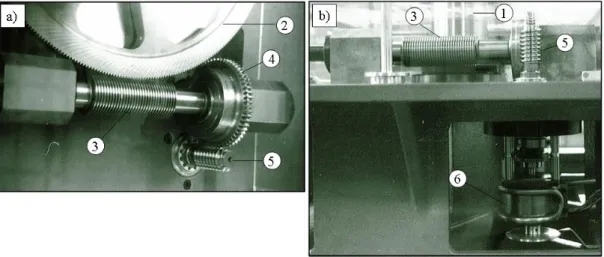
FIGURE 8: Photographs of the crystal tooth wheel mechanism a) top view b) side view: (1) crystal axis, (2) big wheel with 360 teeth, (3) horizontal worm gear, (4) small wheel with 60 teeth, (5) vertical worm gear coupled to the step motor, (6) step motor.
displacement of the axes. This is realized by a dedicated focusing mechanism which consists of two step motors, one for each axis, an optical tracking system and a double jamming device. The optical tracking system keeps the collimator axis vertically aligned to the crystal axis when the latter is moving. During the displacement the pneumatic jamming device, which allows the collimator axis to be fixed to the collimator carrier, is released and the collimator is blocked on the carriage by an electromagnetic jamming device. Note that during the data acquisition the situation is inversed, i.e., the pneumatic jamming system is active and the electromagnetic one is released (see also Sect. 3.1.5).
3.1.4 Optical laser interferometer
The Bragg angles are measured by means of an optical laser interferometer with a precision of several milli–arcsec over the 20 deg. angular range of the spectrometer. The schematic layout of the interferometer is represented in Fig. 9. A dedicated He–Ne laser developed by Hewlett–Packard for industrial linear displacement measurements [19] emits two beams of red light with slightly different optical frequencies, f1 and f2. The frequency difference f1–f2 of about 2 MHz which is obtained by using the laser transitions from two adjacent Zeeman sublevels is very stable and represents the reference signal of the
Ph. D. Thesis M. Szlachetko 1 2 3 3a 3b 5a 5b 4a 4b 7 8 9 10 11 6 f1 f2 f1 f2 x–ray
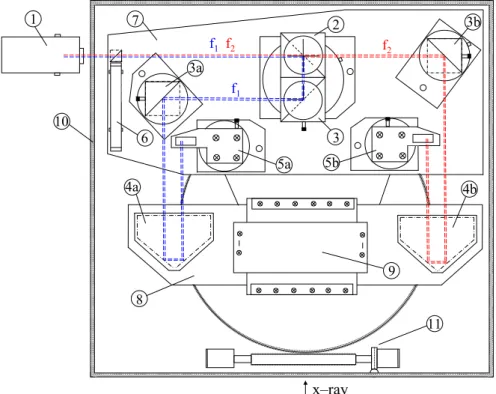
FIGURE 9: Top view of the optical laser interferometer: (1) two–frequency HP laser, (2) beam splitter, (3, 3a, 3b) plane mirrors, (4a, 4b) cube corner reflectors, (5a, 5b) roof prisms (end reflectors), (6) photodetector, (7) fixed table, (8) rotary table, (9) crystal bending device, (10) thermostatic box, (11) driving system of the crystal.
interferometer. Both beams are polarized linearly, the first one in the horizontal plane, the second one in the vertical plane, so that the two signals can be separated by optical elements sensitive to the direction of polarization. The double beam is directed to the beam splitter (2) which separates the two components according to their polarization. The beam f1,deflected by the mirrors (3) and (3a) and by the cube corner reflector (4a), reaches the roof prism (end reflector) (5a). The latter reflects the beam which is redirected to the beam splitter by the same optical elements but along a lower lying path. In the beam splitter the beam f1 is recombined with the beam f2 which has followed a similar path on the other side of the interferometer. The two beams interfere then in the photodetector (6) which provides an electric signal whose frequency corresponds to the beat frequency of the two beams.
The crystal and all optical elements of the interferometer, the laser excepted, are enclosed in a thermostatic box where the temperature is kept constant within 0.05°C by
Ph. D. Thesis M. Szlachetko
means of Peltier elements. The box contains two tables. A fixed one, which is used as a support for all optical elements, except the cube corner reflectors, and a rotary one, fixed to the crystal rotation axis, which supports the crystal bending device and the two cube corner prisms. When the rotary table is not moving, the frequency of the beat signal provided by the photodetector is the same as the reference frequency given by the laser so that the angle measured by the system remains unchanged. However, as soon as the table is rotated, due to the displacement of the cube corner reflectors which are moving in opposite directions, the two frequencies f1 and f2 are Doppler shifted, one frequency being increased, the other one decreased, and the beat frequency provided by the detector is no longer equal to the reference frequency. The HP controller receives the reference and measured signals, processes them and determines the actual crystal angle in optical units with respect to the mechanical zero position at which the interferometer was set to zero. Actually, as the system was developed by HP for linear displacement measurements, one optical unit corresponds to a difference of /40 between the optical paths of the two beams. A more detailed description of a similar interferometer and some theoretical calculations are given in Ref. [20].
The method consisting of measuring the optical path difference between the two beams via the Doppler effect instead of counting the interference fringes presents the great advantage to be less sensitive to the frequency instability of the laser because both light beams are affected in the same way. However, as the measured displacements of the cube corners during a rotation are determined through the frequency changes of the two beams but are expressed in units of /40, the light velocity inside the thermostatic housing must be known. For this reason, the temperature, pressure and humidity of air inside the thermostatic box are measured by the system. From the obtained values the HP controller computes the so–called compensation factor (ratio between the light velocity in the thermostatic house and in vacuum) and multiplies then the interferometer value by the calculated compensation factor. The corrected interferometer value, compensation factor, air temperature, air pressure and air humidity, as well as the temperature of the rotary table, can be obtained from the controller via the VME crate and a GPIB interface.
As the values provided by the interferometer correspond to optical path differences between the two laser beams and not directly to the angle made by the crystal with respect
Ph. D. Thesis M. Szlachetko
to the mechanical zero position, the interferometer was calibrated, using a Moore rotary table [21] and a Hilger–Watts TA53 autocollimator. The combination of these two instruments permitted us to determine 241 crystal angles between – 20 deg. and + 20 deg. with an angular step of 600 arcsec and a precision of 0.2 arcsec. For each angle the corresponding interferometer value was determined.
The crystal angle with respect to the mechanical zero position where the interferometer register is set to zero can be calculated from the following 7th order interpolation polynomial:
x a x a x ... a x7, 7 2 2 1 (10)where stands for the crystal angle in [rad] and x for the interferometer value in [optical
units10-7]. The polynomial coefficients ai were determined from the above mentioned
calibration, using a least–squares fit method. The obtained values are given in Table I.
TABLE I: Coefficients of the interpolation polynomial of the laser interferometer. a1 5.45706743 · 10–2 a2 6.58150153 · 10–7 a3 2.71086763 · 10–7 a4 2.36380371 · 10–9 a5 3.64198016 · 10–8 a6 – 8.93969951 · 10–12 a7 7.22075351 · 10–11
The uncertainties on the angles derived from the polynomial interpolation were determined from the error matrix of the least squares fit procedure. They are presented as a function of the crystal angle in Fig. 10 (curve B). However, it has to be mentioned that as a result of vibrations, successive readings of the interferometer for the same angular position of the crystal provide values that are fluctuating up to 15 optical units. To diminish these fluctuations, the interferometer is usually read several times during the data collection at a given crystal angle and the average value is taken. Typical standard deviations for three, five and ten interferometer readings are 7, 5 and 3 optical units, respectively. If these
Ph. D. Thesis M. Szlachetko
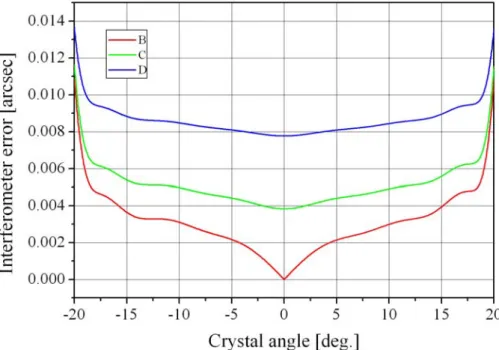
FIGURE 10: Interferometer errors in arcsec as a function of the crystal angle. The red curve B gives the error originating from the sole interferometer calibration, the green curve C and the blue curve D consider in addition the standard deviations for 10 and 3 interferometer readings, respectively.
fluctuations are taken into consideration, the uncertainties on the angles are somewhat larger as shown in Fig. 10 where the total interferometer errors corresponding to ten (curve C) and three readings (curve D) are also given.
3.1.5 Collimator and collimator rotation mechanism
As mentioned in Sect. 3.1.1, in the DuMond geometry a Soller slit collimator is installed in front of the spectrometer detector. It serves mainly to suppress the direct photon beam which is spatially overlapping with the diffracted beam at small Bragg angles. For the DuMond spectrometer of Fribourg, the two beams are overlapping for Bragg angles B 1.0 deg. In addition the collimator diminishes by a factor of about 65 the background originating from the elastic and inelastic scattering by the crystal of the incoming photon beam.
The collimator consists of 24 parallel rectangular slits which are 660 mm long, 110 mm high and 2 mm wide. The horizontal axes of symmetry of the 24 slits converge all to
Ph. D. Thesis M. Szlachetko
the same point. The latter which is located on the focal circle represents the virtual source of radiation. If one considers a vertical plane mirror containing the diameter passing through the crystal center and the crystal curvature center, this virtual source corresponds then to the mirror image of the real source. The collimator was constructed by inserting 23 stainless steel plates in a hollow prismatic frame made of cast iron. The vertical side walls of the frame are rectangular (660 mm long × 105 mm high × 20 mm thick) whereas the horizontal bottom and top walls are trapezoidal with the same length and thickness as the side walls but a width of 134 mm on the rear side and of 123.95 mm on the front side. The 23 rectangular plates have the same length and height as the vertical walls of the frame but a thickness varying linearly from 2.00 mm on the rear side to 1.56 mm on the front side. The plates are arranged so that the space between two neighboring plates is exactly 2 mm and the longitudinal axes of the plates converge all to the same point, the above defined virtual source of radiation. With this design, the transmission of the collimator amounts to 51%.
The response function of the collimator measured at a Bragg angle equal to zero is shown in Fig. 11 where the intensity of the direct photon beam is plotted as a function of the collimator angular position. The curve has a nearly–trapezoidal shape. The width of the plateau is about 200 arcsec and the one of the two flanks 1100 arcsec, in more or less satisfactory agreement with the calculations which predict widths of 140 and 1040 arcsec, respectively. The difference between the measured and theoretical plateau widths and the small curvature observed on the two flanks (which should correspond to straight lines according to geometrical considerations) result probably from the high count rate characterizing this measurement and the non–considered dead time of the detection system. Similar transmission curves can be obtained by setting the crystal on the Bragg angles corresponding to the centroids of diffracted x–ray lines. In this case, the collimator response function indicates the intensity transmitted by the collimator as a function of its misalignment, i.e., as a function of its angular deviation from 2B.
The collimator rotation mechanism is depicted in Fig. 4. A self–propelled carriage supports the collimator, the detector and the heavy lead shielding of the latter. The carriage can move independently on a circular rail made of hardened stainless steel. The radius of the circular rail is 2750 mm and its total length 4743 mm. This length is