HAL Id: hal-00023745
https://hal.archives-ouvertes.fr/hal-00023745v3
Submitted on 29 May 2007HAL is a multi-disciplinary open access
archive for the deposit and dissemination of sci-entific research documents, whether they are pub-lished or not. The documents may come from
L’archive ouverte pluridisciplinaire HAL, est destinée au dépôt et à la diffusion de documents scientifiques de niveau recherche, publiés ou non, émanant des établissements d’enseignement et de
Generalized Einstein Relation in an aging colloidal glass
Bérengère Abou, François Gallet, Pascal Monceau, Noëlle Pottier
To cite this version:
Bérengère Abou, François Gallet, Pascal Monceau, Noëlle Pottier. Generalized Einstein Relation in an aging colloidal glass. Physica A, Elsevier, 2008, 387, pp.3410-3422. �10.1016/j.physa.2008.02.034�. �hal-00023745v3�
hal-00023745, version 3 - 29 May 2007
Generalized Einstein Relation in an aging
colloidal glass
B´ereng`ere Abou, Fran¸cois Gallet, Pascal Monceau and No¨elle Pottier
Laboratoire Mati`ere et Syst`emes Complexes (MSC), UMR CNRS 7057 Universit´e Paris 7-Denis Diderot
10, rue Alice Domon et L´eonie Duquet 75205 Paris Cedex 13, France
Abstract
We present an experimental and theoretical investigation of the Generalized Ein-stein Relation (GER), a particular form of a fluctuation-dissipation relation, in an out-of-equilibrium visco-elastic fluid. Micrometer beads, used as thermometers, are immersed in an aging colloidal glass to provide both fluctuation and dissipation measurements. The deviations from the Generalized Einstein Relation are derived as a function of frequency and aging time. The observed deviations from GER are interpreted as directly related to the change in the glass relaxation times with aging time. In our scenario, deviations are observed in the regime where the observation time scale is of the order of a characteristic relaxation time of the glass.
Key words:
1 Motivation
During the past years, slow relaxation systems have received considerable at-tention in the sense that they constitute a challenge for new developments in nonequilibrium statistical mechanics. Such systems, which are rather common in nature, include structural glasses, polymers, colloids and granular matter. They share some characteristics called glassy behavior, in particular a drastic slowing down of relaxation processes when some control parameters are varied. As the characteristic relaxation times becomes longer than, or comparable to, the observation timescale, the system is said to age. The physical properties of the material depend on the waiting time, which is the time elapsed since preparation in the nonequilibrium state.
Recently, there have been serious attempts to approach and understand ag-ing phenomena on a theoretical level. Many efforts have been devoted to ap-ply statistical physics description – in particular, fluctuation-dissipation rela-tions (FDR) – to out-of-equilibrium systems. At thermodynamic equilibrium, fluctuation-dissipation relations relate the response functions of the system to its autocorrelation functions, involving a single thermodynamic parameter, the equilibrium temperature. However, FDR are not expected to hold in out-of-equilibrium systems. The idea that a timescale dependent nonout-of-equilibrium or effectivetemperature could describe the slow relaxation modes has received a lot of attention. This effective temperature, defined from an extension of FDR, is different from the bath temperature and has been shown to display many of the properties of a thermodynamic temperature (1; 2). Deviations from FDR have been observed in many numerical simulations (3; 4; 5; 6; 7; 8; 9; 10). To date, there are still few experiments where FDR are studied in aging
mate-rials, such as structural glasses (11), colloidal glasses (12; 13; 14; 15; 16; 17), spin glasses (18), polymer glasses (19) and granular media (20; 21). In most cases, they show deviations from FDR as a function of waiting time and fre-quency. Unfortunately, no global understanding can yet be extracted from these experimental findings.
Here we present an experimental and theoretical investigation of the Gener-alized Einstein Relation (GER), a particular form of a fluctuation-dissipation relation, in an out-of-equilibrium visco-elastic fluid. The deviations from the GER are measured as a function of waiting time tw and frequency ω, leading
to an effective temperature Teff(ω), parametrized by tw. This is achieved by
si-multaneously measuring the response function to an external force – using an optical tweezer – and the position fluctuations of micrometric beads embedded in the glass.
The paper is organized as follows. Sec. 2 is devoted to the theoretical investi-gation of the Generalized Einstein Relation in an out-of-equilibrium system, leading to the definition of an effective temperature. Sec. 3 presents the ex-perimental procedures used to test such a GER in an aging colloidal glass: Brownian motion measurements and response to an oscillatory force – using optical tweezer. In Sec. 4, the effective temperature is derived as a function of aging time and frequency. In Sec. 5, we suggest a microscopic interpretation of our findings. We conclude the paper with comparisons with other tests of FDR in the same glass and with open questions.
2 Fluctuation-dissipation relation in an out-of-equilibrium envi-ronment
2.1 Equilibrium medium case
Let us first consider a diffusing particle of mass m evolving in a stationary medium. Its motion can be described by a generalized Langevin equation, in which v(t) = dx/dt is the particle velocity, F (t) the random force acting on the particle, and γ(t) a delayed friction kernel that takes into account the visco-elastic properties of the medium :
mdv dt + m ∞ Z −∞ γ(t − t′ )v(t′ ) dt′ = F (t) (1)
Note for further purpose that, in the usual experimental frequency range, the inertial term in Eq.(1) is quite negligible. The frequency-dependent particle mobility thus reduces to ˜µ(ω) = [m˜γ(ω)]−1
, where ˜γ(ω) = R∞ −∞γ(t)e
iωtdt is
the Fourier transform of the delayed kernel γ(t).
2.1.1 The Generalized Einstein Relation
If the surrounding stationary medium is in thermal equilibrium at temperature T , one can write a Kubo formula expressing the frequency-dependent particle mobility ˜µ(ω) in terms of the velocity correlation function (22) :
˜ µ(ω) = 1 kT ∞ Z 0 hv(t)v(t = 0)ieiωtdt (2)
(the symbol h. . .i denotes the average over an ensemble of realizations). For-mula (2) defines ˜µ(ω) as an analytic function of ω in the upper complex half
plane.
From Eq. (2), one can derive a formula linking the drift and diffusion properties of the particle. The mean-squared displacement of the diffusing particle, as defined by :
h∆x2(t)i = h[x(t) − x(t = 0)]2
i, t > 0 (3)
can be deduced from the velocity correlation function via a double integration over time: h∆x2(t)i = 2 t Z 0 dt1 t1 Z 0 dt2hv(t1)v(t2)i (4)
Introducing the Laplace transformed quantities ˆv(s) = R∞ 0 v(t)e −st dt and h∆x2(s)i =R∞ 0 h∆xd2(t)ie −st
dt, one gets, by Laplace transforming Eq. (3): s2h∆xd2(s)i = 2 hˆv(s)v(t = 0)i (5)
The quantity hˆv(s)v(t = 0)i can be obtained by setting ω = is in the Kubo formula (2) (which is allowed for positive s, since the function ˜µ(ω) is analytic in the upper complex half plane). One gets :
hˆv(s)v(t = 0)i = kT ˆµ(s) (6)
with ˆµ(s) = ˜µ(ω = is). Eq. (5) then takes the form of a relation linking the Laplace transforms of the particle mean-squared displacement and mobility : s2h∆xd2(s)i = 2kT ˆµ(s) (7)
2.1.2 The fluctuation-dissipation relation
It follows from Eq. (2) that the velocity spectral density is related to the dissipative part of the mobility by a fluctuation-dissipation relation (namely, the celebrated Einstein relation):
Cvv(ω) = ∞ Z −∞
hv(t)v(t = 0)ieiωtdt = 2kT ℜe˜µ(ω) (8)
The validity of Eq. (8) is restricted to ω real.
2.1.3 Discussion
The Einstein relation (8) contains the same information as the GER (7), since ˜
µ(ω) can be deduced from ℜe˜µ(ω) with the help of the usual Kramers-Kronig relations valid for real ω. Thus, Eqs. (7) and (8) constitute fully equivalent formulas, which both involve the thermodynamic bath temperature T .
2.2 Out-of-equilibrium environment
The general situation of a particle diffusing in an out-of-equilibrium environ-ment is much more difficult to describe. As well-known, in an aging medium, no well defined thermodynamical temperature does exist, so that Eqs. (7) and (8) are no longer expected to be valid.
We address the question whether the study of the diffusion and drift of the probe particle is likely to provide information about the out-of-equilibrium properties of its surrounding medium.
2.2.1 Modified Generalized Einstein Relation
Out of equilibrium, one can write a modified Kubo formula as : ˜ µ(ω) = 1 k ˜Θ(ω) ∞ Z 0 hv(t)v(t = 0)ieiωtdt (9)
Formula (9) defines the product ˜µ(ω) ˜Θ(ω) as an analytic function of ω in the upper complex half plane. Since this analyticity property holds for ˜µ(ω), it also holds for ˜Θ(ω).
Accordingly, Eq. (6) has to be replaced by :
hˆv(s)v(t = 0)i = k ˆΘ(s)ˆµ(s) (10)
Thus, the relation linking the Laplace transforms of the particle mean-squared displacement and mobility writes :
s2h∆xd2(s)i = 2k ˆΘ(s)ˆµ(s) (11)
Eq. (11) states an out-of-equilibrium GER. It involves a s-dependent GER ratio ˆΘ(s), parametrized by the age of the system tw.
Experimentally, it is always possible to measure independently both quantities – h∆xd2(s)i and ˆµ(s) – during aging. For a particle evolving in a bath at
equilibrium, ˆΘ(s) = T would be independent on s, as shown by Eq. (7). In an out-of-equilibrium environment where ˆΘ(s) is a priori expected to be different from T , the mobility of the probe particle cannot be deduced from the mean-squared displacement measurement, and vice-versa. As a consequence, the visco-elastic properties of the out-of-equilibrium medium cannot be deduced from the single measurement of the probe thermal fluctuations and passive
microrheology cannot be achieved [21].
2.2.2 Modified fluctuation-dissipation relation
Since, in an out-of-equilibrium environment, even stationary, the Einstein re-lation (8) is not a priori satisfied, it has been proposed (1; 2) to rewrite it in a modified way with the help of a frequency-dependent effective temperature. Such a quantity, denoted as Teff(ω) and parametrized by the age of the system
tw, has been defined, for real ω, via an extension of the Einstein relation (8).
One writes a modified Einstein relation as (24; 25) :
Cvv(ω) = 2kTeff(ω)ℜe˜µ(ω) (12)
It has been argued in (1; 2) that the effective temperature Teff(ω) defined
in such a way would have a possible thermodynamic meaning, in the sense that it plays the same role as the thermodynamic temperature in systems at equilibrium (namely, it controls the direction of heat flow and acts as a criterion for thermalisation).
2.2.3 Discussion
In the case of an out-of-equilibrium medium, one has at hand the modified GER (11) and the modified FDR (12). The question thus arises of the link between these two descriptions, namely of the relation between the GER ratio
ˆ
Θ(s) and the effective temperature Teff(ω).
func-tion ˜Θ(ω), in terms of which the velocity spectral density writes:
Cvv(ω) = 2kℜe[ ˜Θ(ω)˜µ(ω)] (13)
Comparing Eqs. (12) and (13), one gets the following relationship between ˜
Θ(ω) and Teff(ω) :
Teff(ω) ℜe˜µ(ω) = ℜe[˜µ(ω) ˜Θ(ω)] (14)
Eq. (14) displays the fact that the effective temperature Teff(ω) involved in the
modified Einstein relation (12) can be deduced from the GER ratio introduced in the modified GER (11) (and vice-versa). This point has been developed in details in (25).
Thus, as it can be seen from Eq. (11), independent measurements of the parti-cle mean-squared displacement and mobility in an aging medium give access, once h∆xb 2(s)i and ˆµ(s) = ˜µ(ω = is) are determined, to the GER ratio ˆΘ(s).
Eq. (14) then allows to derive an effective temperature Teff(ω) from the
ex-perimentally measurable GER ratio ˜Θ(ω) = ˆΘ(s = −iω).
In the out-of-equilibrium case, the modified GER (11) and the modified FDR (12) constitute fully equivalent formulas. However, Eq. (11) involves a GER ratio ˆΘ(s), naturally expressed in terms of the Laplace variable s, while Eq. (12) involves an effective temperature Teff(ω), naturally expressed in terms of
3 Experimental procedures
3.1 Samples preparation
The experiments were performed on Laponite RD, a synthetic clay manufac-tured by Laporte Industry. The particles of Laponite are colloidal disks of 25 nm diameter and 1 nm thickness, with a negative surface charge on both faces (26). The clay powder was mixed in ultra-pure water, and the pH value of the suspensions fixed to pH = 10 by addition of NaOH, providing chemically stable particles (27). The suspension was stirred vigorously during 15 minutes and then filtered through a Millipore Millex - AA 0.8 µm filter unit. This procedure allows us to prepare a reproducible initial liquid state. The aging time tw = 0 of the suspension is defined as the moment it passes through the
filter.
These aqueous suspensions form glasses for low volume fraction in particles (28). Starting from a viscous “liquid” state right after preparation, the sus-pension becomes more and more visco-elastic with time. Since the physical properties of the suspension depend on the time tw elapsed since preparation,
the sample is said to age. Aging can be seen through the change in both the visco-elastic properties and of the colloidal disks diffusion (29; 30). Laponite suspensions age on timescales that depend on the particles’ concentration. We are thus able to control the aging timescales of the glass by adjusting this con-centration. With a volume fraction of 2.3% wt, the glass evolves over several hours, slowly enough to allow us quasi-simultaneous measurements of the fluc-tuation and dissipation properties, within a few minutes, without significative aging of the sample. These two successive measurements are thus considered
to be performed at the same waiting time tw.
The experiments were carried out in a square chamber – 20 × 20 mm2 – made
of a microscope plate and a coverslip separated by a thin spacer (0.1 mm thickness). The beads are suspended in the glass right after its preparation. The chamber is then filled with the suspension, sealed with vacuum grease and mounted on a piezoelectric stage on the optical microscope plate. The probes are latex and silica beads, in very low concentration (respectively 10−4
% and 4.10−4
% in volume). Latex beads (1.0±0.1µm in diameter, Polysciences, Inc.), were preferentially used for fluctuation measurements : since they do not sed-iment during the expersed-iment, their random motion is not perturbed by the chamber walls. Silica beads (2.1 ± 0.1µm in diameter, Bangs Lab Inc.) were used for dissipation measurements, because they are more efficiently trapped by the optical tweezers. By assuming that the particle mobility scales as the inverse particle size according to ˜µ(ω) = 1/6πR˜η(ω) (Stokes assumption in a visco-elastic fluid), the comparison between the results of the fluctuation and dissipation measurements, once rescaled to the same diameter, is meaningful. This relation is exact in a purely viscous fluid at low Reynolds number; here we assume its validity in the visco-elastic fluid.
In these experiments, the nature of the bead material may play a role through the particle-sample interactions, dominated by electrostatics. Actually, the suspensions of Laponite are prepared at pH = 10 by addition of NaOH. At this ionic concentration, the Debye-H¨uckel screening length is of the order of 30 nm, which is comparable to the Laponite particle diameter, and smaller than the interparticle distance. In such conditions, the electrostatic interactions between the micro beads (actually both silica and latex beads are charged) and the Laponite particles are screened on a distance much smaller than the
bead diameter. As a consequence, the range of interactions between beads and particles does not exceed 30 nm and the system is not perturbed on large scales by the introduction of the beads.
3.2 Thermal fluctuations of the beads
At a given aging time tw, we record the fluctuating motion of 1 µm latex beads
during 8 s, with a fast CCD camera sampling at 250 Hz (Fastcam-PHOTRON LTD). A digital image analysis allows us to track the bead positions x(t) and y(t) close to the focus plane of the microscope objective. For each bead, we calculate the time-averaged mean-squared displacement h∆r2(t)i
t′ = h[x(t′ +
t) − x(t′
)]2+ [y(t′
+ t) − y(t′
)]2i
t′ = 2h∆x2(t)it′. To preserve a good statistics,
we keep the data of h∆r2(t)i
t′ in the range 0.004 < t < 1 s. The resolution
on the bead position, determined by sub-pixel accuracy in the image analysis detection, is 10 nm. The glass remains in a quasi-stationary state during the recording, which takes a short time compared to the aging timescale. The quantity h∆r2(t)i
t′, averaged over several beads and realizations, can thus be
identified to the ensemble-averaged mean-squared displacement.
3.3 Dissipative response to an oscillatory force
We describe now the measurement of the mobility ˜µ(ω), at a given frequency ω, for various aging times tw. This measurement is performed immediately
after the Brownian motion recording, at the same aging time tw. Since the
aging Laponite suspension is a visco-elastic fluid, the bead mobility ˜µ(ω) = |˜µ(ω)|eiϕ(ω) is a complex number. We thus need to measure the phase and
modulus of the tracer mobility. We use an optical tweezer to trap a 2.1 µm silica bead immersed in the glass. Trapping is achieved by focusing a powerful infrared laser beam (Nd YAG, Spectra-Physics, Pmax = 600 mW) through a
microscope objective of large numerical aperture (31). The trapping force F on a small dielectric object like a silica bead is proportional to the intensity gradient in the focusing region. It depends on the distance x of the center of the trapped object to the center of the trap, according to F (x) = −kx(1+ǫ|x|). The corrective factor ǫ is introduced to take into account the non-harmonicity of the trapping potential. The trap stiffness k and the factor ǫ are determined from an independent calibration. The calibration procedure was described in details in previous publications using optical tweezers set-up (34). Once the bead is trapped, we make the experimental chamber oscillate by monitoring the displacement xpexp(−iωt) of a piezoelectric stage. Neglecting in a first
step the visco-elastic fluid inertia, the fluid displacement xf in the bead
vicin-ity is taken equal to the piezolectric stage displacement xp. The validity of this
assumption is discussed in the Appendix. Due to the relative bead/fluid mo-tion, the visco-elastic fluid exerts a sinusoidal force F′
exp(−iωt) on the bead. We record with the fast camera the bead movement, and measure by con-ventional image analysis its displacement x exp (−iωt) from the trap center. Notice that x is a complex number which includes a phase shift due to the fluid visco-elasticity. At a given frequency ω, the force amplitude F′
(ω) is given by ˜
F′
(ω) = ˜v(ω)/˜µ(ω), where ˜v(ω) = iω(xf−x) = iω(xp−x) is the relative
cham-ber wall / bead velocity, and ˜µ(ω) the Fourier transform of the bead mobility. In our range of experimental frequencies (0.5 ≤ f ≤ 10 Hz), the bead inertia is negligible, so that we can simply use the relation F + F′
= 0 to calculate |˜µ(ω)| and ϕ(ω). Notice that the motion of the piezoelectric stage is numeri-cally controlled by a sequence of successive sinusoidal signals at five different
frequencies {0.5, 1, 2, 5, 10} Hz. The same program synchronously generates a sequence of pulses to trigger the image acquisition, so that the phase shift be-tween the force and the bead movement can be accurately measured. For both the passive and the active microrheology experiments, we used a conventional image processing software (IMAQ vision builder from National Instruments) to determine the bead position from the numerical recording of the bead im-ages. The accuracy on the bead position was about 10 nm, for typical motions comparable to the bead radius, in the micrometer range.
4 Results
4.1 Rescaling of the aging dynamics
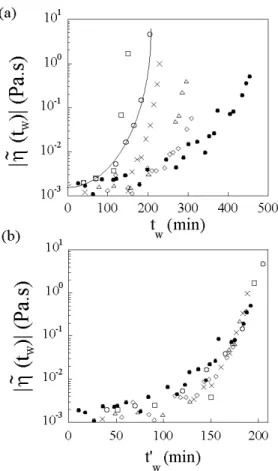
Figure 1(a) shows the increase in the viscosity modulus with waiting time for a set of six different realizations. The complex mobility of a Laponite suspension at 2.3% wt was measured by applying an oscillatory force on a silica bead in the linear regime. The complex viscosity modulus |˜η(ω)| was estimated from the complex mobility modulus |˜µ(ω)| assuming that the Stokes relation ˜µ(ω) = 1
6πR˜η(ω) remains valid in the visco-elastic fluid. Starting from
a value close to the water viscosity 10−3
Pa.s, the glass viscosity modulus is shown to increase by 3 orders of magnitude over about 200 − 400 minutes. These variations in aging timescales are not so surprising because in such suspensions, the aging dynamics is known to drastically depend on the particle concentration. In a suspension at 2.5% wt, a three orders of magnitude increase of the complex viscosity modulus – measured with a conventional rheometer – is reached after 100 minutes, while in a 3.5% wt suspension, the same increase
is reached after 10 minutes (30). Besides, slight ionic concentration variations in the suspension induce important changes in particle interactions. These variations may arise either from pH differences or ions salting-out from the chamber walls.
Here we suggest a time rescaling in order to compare the different realizations. We assume that the differences in the aging dynamic shown in Fig. 1(a) can be compensated by a linear stretching in aging time. This is supported by a recent paper by Joshi where the glass transition of a Laponite suspension is investigated (32). The characteristic dimensionless relaxation time τ /τ0 of
the suspension before the system enters the full aging regime (tw < tw∗) is
shown to only depend on the dimensionless age tw/tw∗. The transition time
tw∗ depends on the volume fraction Φ, according to t∗w ∼ Φ −2/3
. Given a mas-sic fraction of 2.3 %, and the aging timescales involved, our experiments were performed before the full aging regime takes place (29). By assuming that i) the suspension viscosity only depends on the characteristic relaxation time τ /τ0 and thus on tw/tw∗ (33), and ii) that the differences between realizations
are essentially due to slight volume fraction variations, it seems realistic to balance the differences by a linear stretching in aging time. In Fig. 1(b), the aging time was linearly stretched to make the viscosities roughly coincide for all experiments, choosing a particular realization as a reference. Nevertheless, it must be clear that the same conclusions on Teff are obtained on each
sep-arate sample. With this rescaling, we are now able to average over different realizations. From now on, the aging times of the different realizations are rescaled by using this rescaling.
Fig. 1. (a): Viscosity modulus of the glass as a function of aging time, for six different realizations. The viscosity modulus was measured by applying an oscillatory force at a frequency f = 1 Hz on a silica bead in the linear regime; (b): Rescaling of the complex viscosity modulus. The aging time is linearly stretched tw → t′w = αtw to make the viscosities roughly coincide for all experiments, choosing a particular realization as a reference.
4.2 Brownian motion of beads in the glass
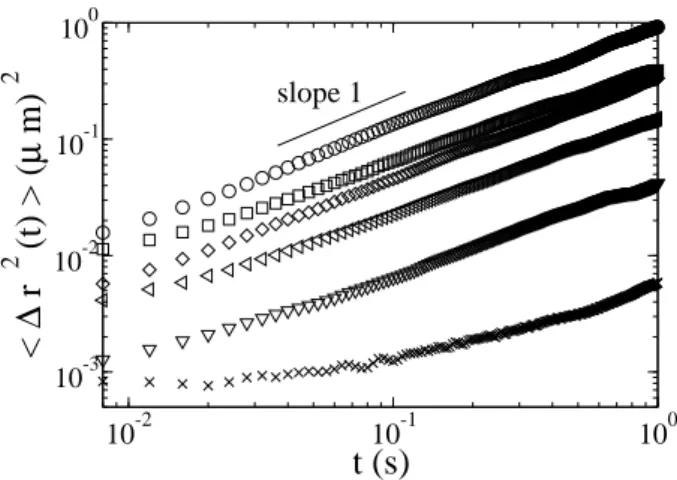
Figure 2 shows the mean-squared displacement of latex beads immersed in the colloidal glass, as a function of time t, for various aging times tw. At tw = 0, we
observe a nearly diffusive behavior of the tracer beads, characterized by a linear dependency of the mean-squared displacement with time. Upon increasing on tw, the tracer motion becomes sub-diffusive.
10-2 10-1 100 t (s) 10-3 10-2 10-1 100 < ∆ r 2 (t) > ( µ m) 2 slope 1
Fig. 2. Mean-squared displacement of 1 µm latex beads immersed in the glass, as a function of time. The curves correspond to different aging times tw = 15, 64, 100, 148, 169 and 186 minutes from top to bottom, measured for one realization. The fluctuating motion is purely diffusive at short tw, and becomes sub-diffusive as the glass ages.
4.3 Mobility from oscillatory force
Figure 3 shows the frequency and aging time dependence of the complex mo-bility modulus |˜µ(ω)| and phase ϕ(ω) measured when applying an oscillatory external force at successive frequencies {0.5, 1, 2, 5, 10} Hz. The mobility mod-ulus |˜µ(ω)| of the bead was found to decrease with aging time tw as shown in
Fig. 3(a). This corresponds to the increase in the glass visco-elastic modulus. Fig. 3(b) represents the phase shift ϕ(ω) as a function of tw. Starting from zero,
the phase ϕ decreases with tw. This corresponds to the shift between a purely
viscous behaviour (ϕ = 0) to a visco-elastic one (−π/2 < ϕ < 0). In a first-order approximation, the phase remains independent of the frequency. Figure 3(c) shows the same |˜µ(ω)| data, plotted as a function of the frequency ω, for different aging times tw. The mobility modulus |˜µ(ω)| is well fitted by a power
law |˜µ(ω)| = µ0(ω/ω0)β in the experimental frequency range corresponding to
rad.s−1
for convenience. Starting from about zero at low aging times, the ex-ponent β increases with tw. Since |˜µ(ω)| exhibits a power-law behavior, the
dependence of ϕ(tw) must be related to β by ϕ(tw) = −β(tw)π/2. This ensures
that ˆµ(s) is a real number. In Fig. 3(b), we plot the quantity −β(tw)π/2 (full
circles), which is in fair agreement with the experimental data ϕ(tw).
4.4 Effective Temperature derived from oscillatory measurements
The GER ratio ˆΘ(s) is now derived from the oscillatory and Brownian mo-tion measurements. The selected range s ∈ [3; 60] s−1
corresponds to the experimental frequencies range f ∈ [0.5; 10] Hz. From the oscillatory mea-surements, the variations of ˜µ(ω) are well represented by the analytical form ˜
µ(ω) = µ0(ω/ω0)βexp (−iβπ/2). The Laplace transform ˆµ(s) = ˜µ(ω = is) =
µ0(s/s0)β is then derived by analytical continuation. Again, s0 is an arbitrary
reference frequency set to s0 = 1 s−1. As can be seen in Fig. 2, h∆r2(t)i can be
approximated by a power-law in the range t ∈ [0.015; 0.3] s. As a consequence, in the corresponding range s ∈ [3; 60] s−1
, the Laplace transform of the mean-squared displacement is well described by a power-law h∆rd2(s)i = a(s/s
0)−b.
Fig. 4 shows the parameters a, b, µ0and β as a function of aging time tw,
aver-aged over a set of six different realizations, using the time rescaling described in section 4.1.
The exponent b decreases from about 1.9 ± 0.05 to 1 ± 0.05 while the exponent β increases from about zero at low aging times to 0.82 ± 0.1 at the end of the experiment. This is consistent with the change from a viscous dominated to an elastic dominated behavior. The error bars on β take into account the depar-ture between the measured and extrapolated values, which are not systematic
(see another realization in (14)).
Bringing together our data for h∆rd2(s)i and ˆµ(s), and using the modified
Generalized Einstein Relation (11), the GER ratio ˆΘ(s), parametrized by tw,
is given by : ˆ Θ(s) = a 4kµ0 (s/s0)2−b−β in the range s ∈ [3, 60] s−1 .
After analytical continuation of ˜Θ(ω) = ˆΘ(s = −iω), we derive the effective temperature Teff(ω), at a given tw, from :
Teff(ω) = a 4kµ0 cos[(b − 2)π/2] cos(βπ/2) (ω/ω0) 2−b−β (15)
in the range ω ∈ [3; 60] rad.s−1
. In a system at equilibrium, we should have
a
4kµ0 = T and 2 − b − β = 0, which leads to ˆΘ(s) = T and Teff(ω) = T . This is
not the case here for the aging colloidal glass.
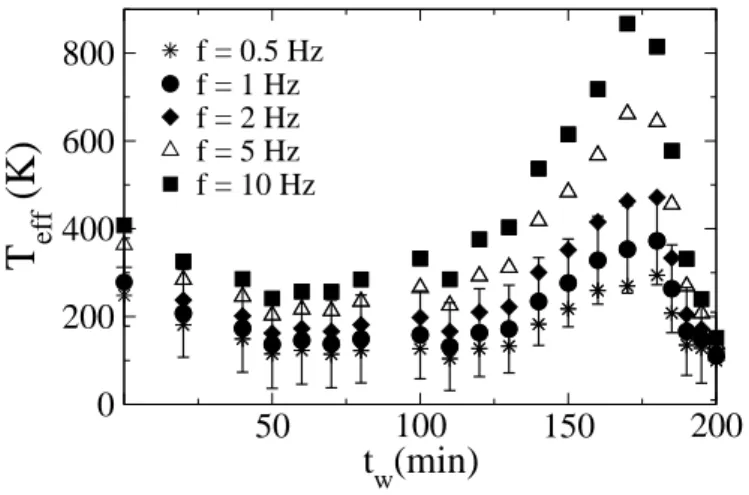
The dependence of the effective temperature Teff with aging time tw, at
dif-ferent frequencies, is shown in Fig. 5. The results have been averaged over six realizations. At the earliest tw, the effective temperature is close to the bath
temperature T = 300 K. Upon increase on tw, Teff increases up to 2-3 times
the bath temperature and then decreases back upon further increase on tw.
Such a behavior – an increase of Teff followed by a decrease – was observed
for the first time in a colloidal glassy system in (14), where a scenario for this non-monotonic behavior was suggested. In the range ω ∈ [3; 60] rad. s−1
, Teff increases with frequency for all aging times as seen in Fig. 5. In these
experiments, the set-up does not allow to measure Teff at longer tw. Indeed,
beyond tw = 200 minutes, the mobility modulus becomes smaller than 10−2 m
s−1
pN−1
a detectable motion of the bead.
Here we remain in the frame of power-law approximation. This is obviously not true in the full time range, but at least in the range [0.015; 0.3] s. Signif-icant deviations from a power-law are measured at large aging times and are currently under study.
5 Discussion and conclusion
As previously reported in (14), the dependence of Teffon tw can be interpreted
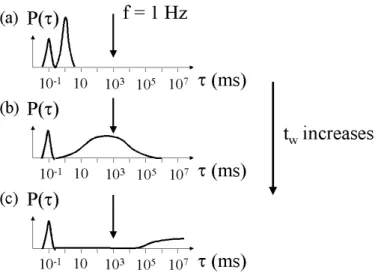
through the change in the glass relaxation times with aging time. In colloidal glasses, dynamic light scattering and diffusive wave spectroscopy experiments provide the opportunity to probe the relaxation times associated to the col-loidal particles diffusion (29; 36; 37). Fig. 6 shows a scheme of the resulting relaxation times distribution function P (τ ), centred around two characteristic relaxation times τfast and τslow. Upon increasing tw, part of the modes
distri-bution function, centred around τslow, shifts to larger times, while the mode
at τfast ∼ 0.1 ms remains unchanged.
We suggest the following scenario for the dependence of the effective tempera-ture on the aging time. When probing the colloidal glass at a typical frequency f = 1 Hz, three situations successively occur upon increasing tw. At the
earli-est tw, the glass relaxation times are small compared to the observation time
scale τfast,slow ≪ 1/f and do not play any role on this observation time. The
glass is “at equilibrium”. In this experiment, the bead is small enough to be sensitive to molecular fluctuations. This ensures that it can thermalize with the bath when the glass relaxation times do not play any role on the
observa-tion time scale. In this case, the reading of the bead thermometer reduces to the bath temperature T . Upon increase on tw, relaxation modes of the order of
the observation time scale τslow ∼ 1/f appear in the glass as seen in Fig. 6 b.
On this observation timescale 1/f , the system is out of equilibrium : the mea-sured temperature becomes different from the bath temperature. Deviations from the Generalized Einstein Relation are thus observed. Finally, for very long tw, the first situation is recovered. The slow and fast relaxation processes
of the glass do not play any role at the experimental observation timescale because τslow ≫ 1/f and τfast ≪ 1/f . The bead thermometer, only sensitive
to the fast relaxation processes at the molecular scale, again thermalizes with the bath. The measured temperature is then expected to reduce back to the bath temperature T . Finally, in this scenario, deviations are only observed in the regime where the observation time scale is of the order of a characteristic relaxation time of the glass, ωτ ∼ 1 (14). These different situations are clearly identified in Fig. 5.
As described in (2; 38), the temperature of an object is measured by cou-pling it to a thermometer during a sufficiently long time interval such that all heat exchanges between thermometer and system take place and the whole system equilibrates. In (2), the authors consider an oscillator of characteristic frequency ω0 as a thermometer, weakly coupled to a glassy system in which a
regime with small energy flows exist. The glass exhibits two time correlation scales, a fast one and a slow one, such that: RST(t − tw) = kT1 ∂twCST(t − tw)
is satisfied at short times t − tw ≪ tw and RAG(tw/t) = kT1∗∂twCAG(tw/t) is
satisfied if tw/t = O(1). RST and CST (or RAG and CAG) are respectively
the stationary or aging parts of the response and correlation functions. T is the bath temperature and T∗
tw/t = O(1).
If ω0is high enough so that the thermometer evaluates the fast relaxation and
quasiequilibrium is achieved on the time scale 1/ω0, its asymptotic internal
energy density reads ETHERM = kT . The reading of the thermometer is the
bath temperature T . If ω0 is very low, the thermometer examines the system
in its long time scales behavior and one finds ETHERM = kT∗, where T∗ is
identified as the temperature of the system on this observation time. Any small but macroscopic thermometer, weakly coupled to the system, is shown to play the same role as the above considered oscillator. The role of ω0 is then
played by the inverse of the typical response time of the thermometer.
In our experiments, the bead plays the role of a thermometer which character-istic frequency ω0 is set to the probing frequency ω. Indeed, the bead inertia
is negligible below ωinertia = 108 rad.s−1 for the highest value of the fluid
vis-cosity (≃ 10 Pa.s). Experimentally, the observation time scale 1/ω is much higher than the typical response time of the bead thermometer 1/ωinertia. As a
result, the response time of the bead is set to the observation time scale 1/ω. It follows that by changing this observation time scale, the thermometer can explore or be sensitive to, different relaxation time scales of the glass (see Fig. 6).
In models and simulations – where the characteristic relaxation time of the system is set to the waiting time – deviations are observed when the charac-teristic observation time 1/ω is of the same order or greater than the aging time tw. Experimentally, deviations are observed in the other regime when
1/ω ≪ tw. In our sense, this discrepancy arises because the aging time tw
processes, characterized by the distribution of relaxation times in the system, must be considered. In our experiments, deviations are observed when ωτ ∼ 1. This suggests that, besides the waiting time tw, the distribution of relaxation
times must be included in models to get an accurate description of aging.
In the past, FDR have been experimentally investigated in the same colloidal glasswith electrical and rheological measurements (13). In the dielectric mea-surements, the effective temperature decreases with tw and ω, and reaches the
bath temperature at high frequency and aging times. In the rheological mea-surements, no deviation from FDR could be detected. More recently, FDR, in the form of a Generalized Stokes-Einstein relation, has been investigated by combining dynamic light scattering and rheological measurements (15). The authors assume that the bulk stress relaxation probed by a rheometer is the same as the local stress relaxation affecting the probe particles. The effective temperature is shown to increase with frequency and aging time in the range tw ∈ [82; 135] min and ω ∈ [20; 100] rad. s−1 for a 3% wt suspension. The
authors suggest the existence of two regimes: ωτ ≪ 1 leading to the bath temperature T and ωτ ≫ 1 leading to Teff, which is not consistent with our
interpretation despite the authors claim. Other groups have recently investi-gated the deviations from FDR, by performing a test of the Stokes-Einstein relation, using optical tweezers (16; 17). In one case, they found that no de-viation could be detected in the aging colloidal glass over a wide range of frequencies f ∈ [1.2; 12000] Hz. In the other one, deviations are observed at large aging times. Although the reason of these discrepancies have to be elu-cidated, our experimental findings are fully supported by our interpretation based on microscopic processes probed in light scattering experiments (see Fig. 6).
At this stage, whether these experimental investigations with the same observ-ables, in the same colloidal glass, are in contradiction still remains an open question (14; 15; 16). Furthermore, the definition of an effective temperature, with a thermodynamic meaning, implies that this quantity is independent of the chosen observable, which is not verified in (13) where rheological and dielectric measurements do not lead to the same effective temperature. Is the effective temperature defined through a generalisation of FDR a relevant concept ? Does it depend on the chosen observable, as shown in the glass phase of Bouchaud’s trap model (10), or not, as in simulations on a binary Lennard-Jones mixture (39) ? More experimental investigations are needed to understand these contradictory findings (see (40) for a review).
In conclusion, this work provides an experimental and theoretical investigation of the Generalized Einstein Relation in an aging colloidal glass. We interpret the observed deviations from GER as directly related to the change in the glass relaxation times. Deviations are observed in the regime ωτ ∼ 1.
As a final comment, let us add that dynamical heterogeneities are recognized as a general feature of slow dynamics encountered in supercooled liquids and glasses (41; 42; 43). In supercooled liquids, deviations from the Einstein re-lation were explained by such dynamical heterogeneities (41). Up to now, in models and simulations, deviations from FDR have been found in homoge-neous glassy systems and interpreted in terms of an effective temperature. Moreover, the effective temperature is defined as an ensemble-averaged quan-tity in experiments, models and simulations. Understanding how the concept of effective temperature interplays with such heterogeneities is an open ques-tion.
References
[1] L.F. Cugliandolo and J. Kurchan, Phys. Rev. Lett. 71, 173 -176 (1993). [2] L.F Cugliandolo, J. Kurchan, and L. Peliti, Phys. Rev. E 55, 3898 - 3914
(1997).
[3] G. Parisi, Phys. Rev. Lett. 79, 3660 - 3663 (1997). [4] A. Barrat, Phys. Rev. E 57, 3629 - 3632 (1998). [5] M. Sellitto, Eur. Phys. Journ. B 4, 135 - 138 (1998).
[6] E. Marinari, G. Parisi, F. Ricci-Tersenghi, and J.J. Ruiz-Lorenzo, J. Phys. A : Math Gen. 31, 2611 - 2620 (1998).
[7] J.-L. Barrat and W. Kob, Europhys. Lett. 46, 637 - 642 (1999).
[8] L. Berthier, J.-L. Barrat, and J. Kurchan, Phys. Rev. E 61, 5464 - 5472 (2000).
[9] H.A. Makse and J. Kurchan, Nature 415, 614 - 617 (2002).
[10] S. Fielding and P. Sollich, Phys. Rev. Lett. 88, 050603-1 - 050603-4 (2002). [11] T.S. Grigera and N.E. Israeloff, Phys. Rev. Lett. 83, 5038 - 5041 (1999). [12] L. Bellon, S. Ciliberto, and C. Laroche, Europhys. Lett. 53, 511 - 517
(2001).
[13] L. Bellon and S. Ciliberto, Physica D 168 - 169 , 325 - 335 (2002). [14] B. Abou and F. Gallet, Phys. Rev. Lett. 93, 160603 1-4 (2004).
[15] D.R. Strachan, G.C. Kalur, and S.R. Raghavan, Phys. Rev. E 73, 041509 1-5 (2006).
[16] S. Jabbari-Farouji, D. Mizuno, M. Atakhorrami, F.C. MacKintosh, C.F. Schmidt, E. Eiser, G.H. Wegdam, and D. Bonn, Phys. Rev. Lett. 98, 108302 (2007).
[17] N. Greinert, T. Wood, and P. Bartlett, Phys. Rev. Lett. 97, 257202 (2006). [18] D. H´erisson and M. Ocio, Phys. Rev. Lett. 88, 257202 - 257205 (2002).
[19] L. Buisson, S. Ciliberto, and A. Garcimart´ın, Europhys. Lett. 63, 603 -609 (2003).
[20] G. D’Anna, P. Mayor, A. Barrat, V. Loreto, and F. Nori, Nature 424, 1909 - 912 (2003).
[21] R.P. Ojha, P.-A. Lemieux, P.K. Dixon, A.J. Liu, and D.J. Durian, Nature 427, 521 - 523 (2004).
[22] R. Kubo, Rep. Prog. Phys. 29, 255 - 284 (1966); R. Kubo, M. Toda, and N. Hashitsume, Statistical physics II : nonequilibrium statistical mechanics, Second edition, Springer-Verlag, Berlin, 1991.
[23] T.G. Mason, K. Ganesan, J.H. van Zanten, D. Wirtz, and S.C. Kuo, Phys. Rev. Lett. 79, 3282 - 3285 (1997).
[24] N. Pottier and A. Mauger, Physica A 332, 15 - 28 (2004). [25] N. Pottier Physica A 345, 472 - 484 (2005).
[26] M. Kroon, W.L. Vos, and G.H. Wegdam, Phys. Rev. E 57, 1962-1970 (1998).
[27] D.W. Thompson and J.T. Butterworth, J. Colloid Interface Sci. 151, 236-243 (1992).
[28] D. Bonn, S. Tanaka, G.H. Wegdam, H. Kellay, and J. Meunier, Europhys. Lett. 45, 52 - 57 1(1999).
[29] B. Abou, D. Bonn, and J. Meunier, Phys. Rev. E 64, 021510 - 021513 (2001).
[30] B. Abou, D. Bonn, and J. Meunier, J. Rheol. 47, 979 - 988 (2003). [31] S. H´enon, G. Lenormand, A. Richert, and F. Gallet, Biophys. J. 76, 1145
- 1151 (1999).
[32] Y. Joshi, cond-mat/0702467 (2007).
[33] D. Bonn, S. Tanase, B. Abou, H. Tanaka and J. Meunier, Phys. Rev. Lett. 89, 015701-1 (2002).
[34] M. Balland, A. Richert, and F. Gallet, Eur. Biophys. J. 34, 255 - 261 (2005).
[35] J.-F. Berret, Molecular gels, Springer-Verlag, Weiss (Eds), 2005; cond-mat/0406681.
[36] A. Knaebel, M. Bellour, J.-P. Munch, V. Viasnoff, F. Lequeux, and J.L. Harden, Europhys. Lett. 52, 73 - 79 (2000).
[37] M. Bellour, A. Knaebel, J.L. Harden, F. Lequeux, and J.-P. Munch, Phys. Rev. E 67, 031405 1-8 (2003).
[38] L.F. Cugliandolo, Lecture notes, Les Houches (2002); cond-mat/0210312. [39] L. Berthier and J.L. Barrat, J. Chem. Phys. 116, 6228 - 6242 (2002). [40] L. Cipelletti and L. Ramos, Journal of Physics: Cond. Matt. 17, R253
-R285 (2005).
[41] S.F. Swallen, P.A. Bonvallet, R.J. McMahon, and M.D. Ediger, Phys. Rev. Lett. 90, 015901 1-4 (2003).
[42] E.R. Weeks, J.C. Crocker, A.C. Levitt, A. Schofield, and D.A. Weitz, Science 287, 627 - 631 (2000).
[43] A. Duri, P. Ballesta, L. Cipelletti, H. Bissig, and V. Trappe, Fluctuation and noise Letters 5, L1 (2005).
Fig. 3. Modulus (a) and phase (b) of the complex mobility ˜µ(ω) = |˜µ(ω)|eiϕ(ω) of the bead as a function of tw, for various frequencies of the applied force; (c) mobility modulus versus ω for various tw; from top to bottom, tw varies from 8 to 191 min, for this realization. At low tw, |˜µ(ω)| is nearly independent of ω. Upon increasing tw, the modulus is well fitted by a power-law |˜µ(ω)| = µ0(ω/ω0)β with ω0 = 1 rad.s−1 and β only depending on tw. The full circles in (b) correspond to ϕ(tw) = −β(tw)π/2.
10-4 10-3 10-2 10-1 100 a ( µ m 2 s -1 ) 1 1,2 1,4 1,6 1,8 2
b
0 50 100 150 200 tw(min) 10-3 10-2 10-1 100 101 102 µ 0 (µ m s -1 pN -1 ) 0 50 100 150 200 tw(min) -0,2 0,2 0,6 βFig. 4. Top: Brownian motion parameters a and b as a function of aging time, where h∆rd2(s)i = a(s/s
0)−b, with s0 = 1 s−1; Bottom : Mobility parameters µ0and β as a function of aging time, where ˜µ(ω) = µ0(ω/ω0)βexp (−iβπ/2), with ω0 = 1 rad.s−1. The results have been averaged over six realizations, and rescaled in aging time.
50 100 150 200
t
w(min)
0 200 400 600 800T
eff(K)
f = 0.5 Hz f = 1 Hz f = 2 Hz f = 5 Hz f = 10 HzFig. 5. Effective temperature Teffof the colloidal glass as a function of aging time tw, measured at different frequencies. Upon increase on tw, Teff increases up to about 2-3 times the bath temperature and then decreases back. The results have been averaged over six realizations rescaled in aging time. The typical errors bars on Tef f have only been shown on the data at f = 1 Hz for clarity, but all error bars roughly have the same magnitude.
Fig. 6. Scheme of the relaxation times distribution function P (τ ) in the glass of Laponite (typically 2.5% wt) at different aging times tw. Upon increasing tw, part of the modes distribution, centred around τslow, shifts towards larger times, while the mode at τfast∼ 0.1 ms remains unchanged. The arrow represents the measurements timescale 1/f .