HAL Id: hal-01214332
https://hal.archives-ouvertes.fr/hal-01214332
Submitted on 6 Nov 2015
HAL is a multi-disciplinary open access
archive for the deposit and dissemination of
sci-entific research documents, whether they are
pub-lished or not. The documents may come from
teaching and research institutions in France or
abroad, or from public or private research centers.
L’archive ouverte pluridisciplinaire HAL, est
destinée au dépôt et à la diffusion de documents
scientifiques de niveau recherche, publiés ou non,
émanant des établissements d’enseignement et de
recherche français ou étrangers, des laboratoires
publics ou privés.
Experimental and Computer Simulation Study of the
Variation with Depth of the X-ray Section Topograph
Images of a Dislocation
André Authier, M Lefeld-Sosnowska, Yves Epelboin, Alain Soyer
To cite this version:
André Authier, M Lefeld-Sosnowska, Yves Epelboin, Alain Soyer. Experimental and Computer
Sim-ulation Study of the Variation with Depth of the X-ray Section Topograph Images of a Dislocation.
Journal of Applied Crystallography, International Union of Crystallography, 1985, 18 (2), pp.93-105.
�10.1107/S002188988500989X�. �hal-01214332�
93
J. Appl. Cryst. (1985). 18, 93-105
Experimental and Computer Simulation Study of the Variation with Depth of the X-ray
Section Topograph Images of a Dislocation*
By A. AUTHIERt AND M. LEFELD-SOSNOWSKA
Institute for Experimental Physics, University of Warsaw, 69 Hoza, Warsaw, Poland
AND Y. EPELBOIN AND A. SOYER
Laboratoire de Min@ralogie-Cristallographie, associk au C N R S , Universit@s P. et M. Curie et Paris VII, 4 Place Jussieu, 75230-Paris C E D E X 05, France
(Received 24 May 1984; accepted 5 December 1984)
Abstract
A systematic study of the variations of the contrast of a dislocation in silicon on section topographs with the depth of the line was performed both experimentally and with computer simulations. Mo K~I radiation and 333 and 333 symmetric reflections were used. The crystal thickness was 440 ~tm so that the value of pt was 0.64. The influence of the orientation of the dislocation was studied for values of the angle between the line and its Burgers vector ranging between 60 and 90 ° in the glide plane. It was observed that when the dislocation lies close to the entrance surface, whatever its orientation, its image is centred around the trace of the plane of incidence passing through the inter- section of the dislocation with the direct beam while when the dislocation lies close to the exit surface its image is centred around the projection of the disloca- tion on the section pattern. The variation of the orientation of the image for intermediate depths of the dislocation is interpreted by means of the geometrical construction of the dynamical image. The values of the orientation of the image calculated according to this simple model are in good agreement with those measured on both experimental and simulated topo- graphs. The same geometrical model enables the difference in the relative positions of the direct and dynamic images of stereo pairs to be explained. A new feature was observed in the simulated images and several of the experimental ones, namely a con- centration of intensity along the projection of the dislocation in the reflected direction. Slit width was taken into account in the simulations for a better fit with experimental topographs but not polarization, which was taken to be normal to the plane of incidence. Because of the small value of the crystal
*This research was partly supported under research project MR-I-5.
tOn leave from Laboratoire de Min6ralogie-Cristallographie, associ6 au CNRS, Paris.
thickness and of #t, the variation of the contrast with the Burgers vector is very small, making its determina- tion very difficult.
1. Introduction
Many papers have been devoted to the study of the main features of dislocation images on X-ray section topographs and to their computer simulations (Authier, 1961, 1967, 1977; Balibar & Authier, 1967; Authier, Balibar & Epelboin, 1970; Epelboin, 1974, 1975, 1979; Suvorov, Polovinkina, Nikitenko & Indenbom, 1974; Suvorov, Gorelik & Ponomareva, 1976; Lefeld-Sosnowska, 1978; Lefeld-Sosnowska & Zawadzka, 1978; Kowalski & Gronkowski, 1982; Epelboin & Patel, 1982; Kowalski, 1984) and the good agreement between experimental and simulated topo- graphs has been established satisfactorily. The influence of the Burgers vectors in certain cases (Epelboin, 1974, 1979; Epelboin & Patel, 1982) and the influence of the position of the dislocation line with respect to the Borrmann fan has been shown (Authier, 1967, 1977; Epelboin, 1975; Lefeld-Sosnowska, 1978; Kowalski & Gronkowski, 1982) but no systematic study has been undertaken as yet of the variations of the contrast and of their physical interpretation in terms of the many parameters on which it depends, namely respective orientations of the crystal surface, diffraction vector, dislocation line and Burgers vector, depth of the dislocation, crystal thickness, absorption coefficient, order of the reflection, structure factor etc. For the experimenter what is important is to be able to derive the properties of a dislocation from the interpretation of the various features of its image. This requires an understanding of the behaviour of wave- fields propagating in a deformed region in terms of the distribution of strains and of their gradient and the possibility of predicting how the contrast of the image is modified when the geometrical and diffraction parameters are varied. The latter is obviously a consequence of the former; however it is extremely
94 X-RAY S E C T I O N T O P O G R A P H I M A G E S O F A D I S L O C A T I O N
complicated to unravel the intricate mechanisms of dislocation-image formation in section patterns, that is for an incident distribution of spherical waves, and it has actually never been done satisfactorily. It is therefore worth while to pursue concurrent ap- proaches simultaneously, namely studies of wavefield propagation and generation (interbranch scattering) from diffraction theory on one hand and from an analysis of the variations of the contrast with the various parameters on experimental and simulated topographs on the other.
The present paper is the first of a series that will endeavour to show the influence of the geometrical parameters. It is concerned with the variations of the contrast of a series of dislocations with their depth within the crystal for values of their orientations with their common Burgers vector ranging from 60 to more than 90 ° . The study was performed both experimen- tally (Lefeld-Sosnowska & Zawadzka, 1978) and with computer simulations performed using the varying- step algorithm (Epelboin, 1983).
2. Experimental conditions
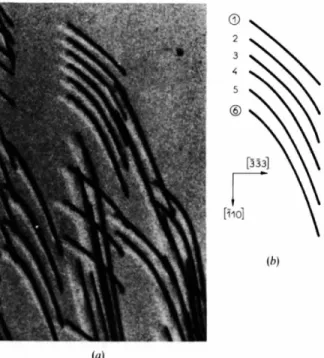
The dislocations studied in the present paper were contained in a 440 ~tm thick slab cut perpendicular to the [112] direction and parallel to the [11i] pulling axis of an as-grown Cz silicon crystal. Fig. 1 shows a selected area from a 333 traverse topograph of this
® 2 3 4 5 ® (b) (a)
Fig. 1. (a) X-ray traverse t o p o g r a p h of a (112) silicon crystal, 333 reflection, Mo Kcq. (b) Schematic diagram showing the disloca- tions, labelled 1 to 6, studied in this paper, and the crystallo- graphic orientations on the crystal surface. The dislocations lie in a (I l 1) glide plane, which intersects the crystal surface along [ l I 0 ] .
slab. The dislocations observed in Fig. 1 and labelled 1 to 6 were shown in a previous study (Lefeld- Sosnowska & Zawadzka, 1978) to lie in a (111) slip plane and to have ½[01i] as Burgers vector. Presum- ably they were generated by a source that was ac- tivated by stresses present during the cooling of the crystal but this point is not really relevant for the present study. Fig. 2 is a diagram showing the position of the two extreme dislocations, 1 and 6, within the crystal and the orientation of the Borrmann prism. Close to their outcrop at the entrance surface the dislocations are parallel to [10i] and are of 60 ° type. Their orientation changes progressively as they get deeper inside the crystal, more rapidly so from disloca- tion 1 to dislocation 6 so that the orientation of dislocation 6 close to the exit surface is approximately [211] and it is of edge type.
Fig. 3 shows the intersection of one of these disloca- tion lines with the Borrmann prism for a given position of the entrance slit. The orientations of the axes that have been used for the calculations are indicated. Let D, be the intersection of the dislocation with the direct beam. For a straight dislocation the depth z, of D~ below the surface is related to the distance O'A' of the edge of the Borrmann prism from
1 I _[119] J ,, I # \ ../' t X . ' i X " , ' "
..-
C, - b . .
~ 3 X . \ \ \ \ kFig. 2. Diagram showing the position of the dislocations in the crystal with respect to that of the Bom'nann prism.
,,~.~- . . . .~
A. AUTHIER, M. LEFELD-SOSNOWSKA, Y. EPELBOIN AND A. SOYER 95
the outcrop O' of the dislocation at the entrance surface by the relation
O ' A ' = z I (tan s - t a n 0), (2.1) where 0 is the Bragg angle and ~ is the angle between the normal to the crystal surface and the projection of the dislocation line on the plane of incidence. The latter angle is related to the direction cosines of the dislocation line u, v, w by
tan ~ = u/w. (2.2)
The value of I~l is equal to 70.5 ° for all the orientations of the dislocations studied in this paper since they lie in a (111) plane, the intersection of which with the plane of incidence is [112-].
The whole present study was performed using Mo K~t radiation and the 333 and 333 reflections, which are here symmetric. The values of the main diffraction parameters are the following:
Bragg angle
Fourier coefficient of the real part of
susceptibility (after Aldred & Hart, 1973)
Fourier coefficient of the imaginary part of susceptibility (after Aldred & Hart, 1973)
Pendell6sung distance Width of the rocking
c u r v e
Product of absorption coefficient and crystal thickness 0 = 10"83 ° Zrh = --0"947 × 10 -6 Zih = -- 0"95 × 10- 8 A = 70"4 l.tm 6 = 0"297 × 10- s rad /~t = 0"64 3. Computer simulations
The simulations were performed by solving the Takagi-Taupin equations by means of the half-step derivative method used by Authier, Malgrange & Tournarie (1968) and the variable-step algorithm in- troduced by Epelboin (1983). Petrashen (1976) sug- gested decreasing the steps of integration near the edges of the Borrmann fan and Epelboin (1981, 1983) wrote an algorithm where the steps are automatically adjusted to the local oscillation of the wavefields. They are small near the edges and become large in the middle of the Borrmann fan where the amplitudes vary slowly. This ensures both a much higher accuracy and a smaller computing time than with a constant- step algorithm.
The simulated image is photographed from a Numelec-Pericolor 2000 raster picture system. With a minicomputer Mini 6/53 CII-HB linked to an FPS 100 array processor, the total computing time including input and output of the data is of the order of a few
minutes only for a section topograph calculated for a single point source. It is therefore easy to perform many simulations and to study by means of computer experiments how the contrast is modified when the geometrical and diffraction parameters are varied.
Simulations are calculated, using as an incident wave a spherical wave emitted by a single point source on the crystal surface. This is a very different situation from the experimental one where the incident beam is a superposition of spherical waves emitted by the anode of the X-ray tube. Each wave is limited by the angular admittance of the crystal, that is the width of the rocking curve and the beam is limited by an entrance slit. The best way to simulate this situation is to superpose a series of simulations performed for a series of point sources distributed over the width of the slit (Aristov, Kohn, Polovinkina & Snigirev, 1982; Epelboin & Authier, 1983). The results show a slight blurring of the spherical-wave Kato Pendell6sung fringes and a much better overall agreement between experimental and simulated topographs (Epelboin & Authier, 1983) to the point that the width of the slit can be fitted for best agreement. The simulated topo- graphs of Figs. 4 and 15 of the present paper were calculated using a 12 lam wide entrance slit corre- sponding to the superposition of five topographs calculated with an incident point source, at 2-4 lam intervals. The other simulations were calculated for an incident point source. They show details of the image that cannot be expected to be resolved on an experi- mental topograph.
Polarization has been assumed to be normal to the plane of incidence. For best correspondence with experiment, the average between the images calculated for polarization normal and parallel to the plane of incidence should be taken. This has not been done here because this would have implied computing twice the number of images simulated. The numerical preci- sion of the varying-step algorithm is sufficient for polarization to be taken into account and this will be discussed in a separate paper.
4. Comparison of experimental and simulated section topographs
A series of more than ten section topographs of the silicon slab was taken for successive positions of the crystal with respect to the slit for both 333 and 333 reflections. For this purpose, the crystal was translated by steps of about 50 ~m in front of a 10 to 15 ~m wide slit. Figs. 4(a) and (c) show examples of the section topographs thus obtained, which are most character- istic of the observed variations of the contrast as the dislocation dips into the crystal. Images of dislocation 1 only are represented here. The estimated depths at which the dislocation line cuts the direct beam for each position of the crystal are given in Table 1 as well
96 X-RAY S E C T I O N T O P O G R A P H I M A G E S O F A D I S L O C A T I O N
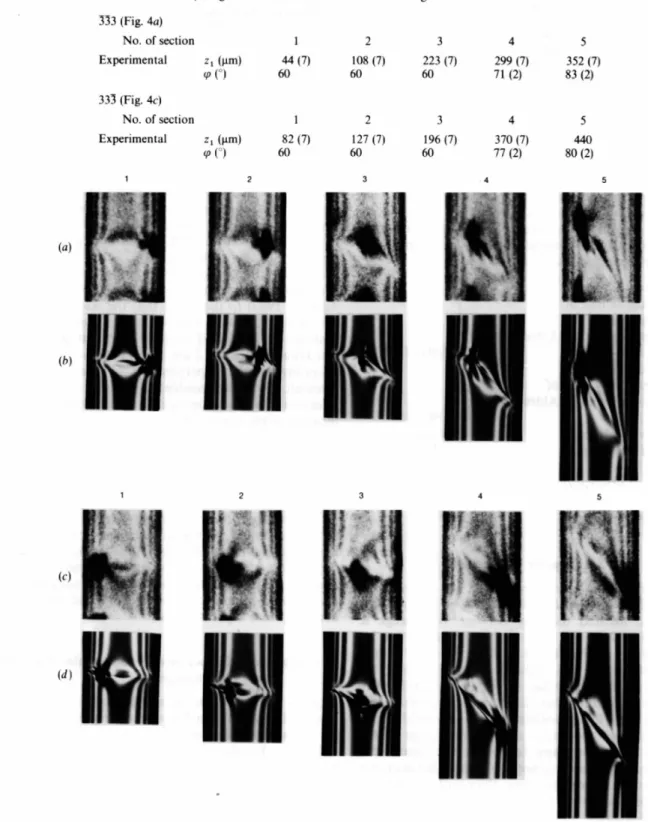
T a b l e 1. Depths and orientations of dislocation 1 corresponding to the experimental topographs of Fig. 4 z~: depth of the intersection of the dislocation with the direct beam.
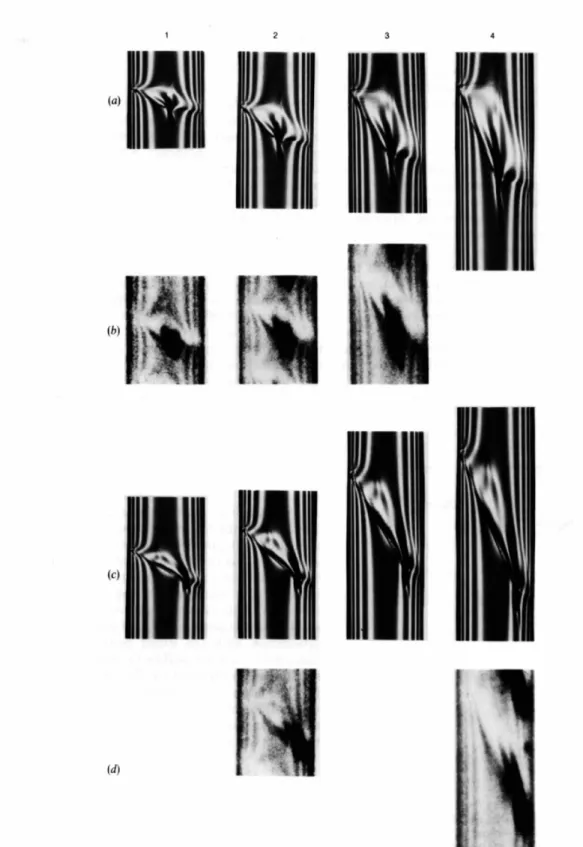
tp: angle between the dislocation and its Burgers vector. 333 (Fig. 4a) No. of section 1 2 3 4 5 Experimental z~ (lam) 44 (7) 108 (7) 223 (7) 299 (7) 352 (7) ~o (o) 60 60 60 71 (2) 83 (2) 333 (Fig. 4c) No. of section 1 2 3 4 5 Experimental zl (~tm) 82 (7) 127 (7) 196 (7) 370 (7) 440 q~ (°) 60 60 60 77 (2) 80 (2) 1 2 3 4 5 1 2 3 4 5 (d)
Fig. 4. Experimental (a and c) and simulated (b and at) section topographs for the 333 (a and b) and 333 (c and d) reflections of dislocation 1. The experimental topographs were taken for successive positions of the crystal. The corresponding depths and orientations of the dislocation are given in Table 1. The simulated topographs were calculated for the same values of the depth and the orientation of the dislocation, Burgers vector b = ½[011] and an entrance-slit width of 12 lam. The topographs are viewed looking towards the X-ray source.
A. AUTHIER, M. LEFELD-SOSNOWSKA, Y. EPELBOIN AND A. SOYER 97
as the estimated orientation of the line at that point. These values are necessarily approximate, not only because of the width of the entrance slit but also because of the manner by which they are estimated. This can be done in four different ways. First of all they can be deduced by means of (2.1) from the positions of the crystal read on the driving screw; however only relative translations of the crystal can be measured and absolute values are not known; fur- thermore, the movement of the screw is not perfectly accurate. The depth of the dislocation can also be deduced from the position of its direct image in the section topograph but this image is very large and it is therefore difficult to find where the centre of the strain field exactly lies, all the more so since an accurate model of the formation of the image is lacking.
The depth of the dislocation can also be confirmed independently by two indirect ways. One is to find among the simulations that have been performed for various depths the one that fits best with experiment. The other one is to measure the angle of the dynamical image with the axis of the section pattern, which is directly related to the depth and orientation of the dislocation through (6.3). The orientation of the dis- location can be deduced from a traverse topograph. The values of depth and orientation given in Table 1 are the result of the best fitting of all the available data. Dislocation 1 remains parallel to [10T] down to about three quarters of the crystal thickness and then begins to rotate slightly towards the [2]-1] direction. About 150 simulations have been calculated for various depths and orientations of the dislocation line, for the two possible orientations of the Burgers vector, ½[011] and ½[0T1], and for the two reflections, ~33 and 333. Figs. 4(b) and (d) present the simulations for which depth and orientation of the dislocation have been fitted for best agreement of the images with the experimental ones. They have been calculated for an entrance slit width of 12 lam.
The agreement of experimental and simulated topo- graphs is seen to be quite good. The contrast is different for 3~3 and 333, the more so as the disloca- tion lies deeper inside the crystal. It changes drasti- cally with the depth of the dislocation. This very important point will be discussed after the principles of image formation have been recalled.
The main features in a dislocation image, namely the direct image, the dynamic image and the inter- mediary image have been described by Authier (1967) and have been observed by m a n y authors. They are schematically represented in Fig. 5 as an example.
The relative position and importance of these features depend strongly on the various geometrical and diffraction parameters and the exact mechanism of their origin is not yet really known. Simulations are a good way to progress in their understanding with respect to the time they were first described.
Apart from these features, there are other aspects in m a n y dislocation images on section topographs. One is the deformation of the normal spherical-wave Kato
Pendell~sung fringes. This effect is due to a decrease of
the Pendell6sung distance, itself a consequence of the
bending of wave fields in slightly deformed areas far from the dislocation core. It was first observed and explained by K a t o (1963) and was further discussed by Suvorov et al. (1974) in terms of the phase shift to be associated with the relative translation of lattice planes above and below a dislocation. It is sketched in Fig. 5(a) and is clearly visible on most of the topo- graphs of Fig. 4. This effect can obviously only be seen for values o f / a t for which Pendell~sung fringes are visible.
Another very interesting feature that can be ob- served in some cases is a line of high intensity along the projection of the dislocation line on the photo- graphic plate, that is along what would be the direct image on a traverse pattern. Such an accumulation of
(a) (b)
5. Image formation in section topographs Section topographs were the first type of topographs by means of which single dislocations were observed (Lang, 1957). They have the big advantage of contain- ing a lot of information about the strain field inside the crystal but are more complicated to interpret than plane-wave topographs because of the spherical-wave nature of the incident beam and the influence of the slit width.
Fig. 5. (a) Schematic diagram showing the various features of the dislocation image according to the simulation of: two black lobes, i1: direct image; shaded area: intermediary image; area limited by broken lines: dynamic image; straight black line between il and the left-hand extremity of the section pattern: last fringe of the intermediary image. It lies along the projection of the dislocation on the topograph; thin vertical black lines: Kato fringes deformed around the dislocation image. (b) Simulated topograph, 333 re- flection, Burgers vector ½[011], depth of the dislocation: 240 ~tm. The contour drawn by the computer surrounds the region corresponding to an intensity higher than a certain arbitrary value. It corresponds roughly to the direct image.
98 X-RAY SECTION TOPOGRAPH IMAGES OF A DISLOCATION
intensity along the reflected direction from the disloca- tion was first observed on simulations of energy propagation in the plane of incidence (Epelboin, 1975) and it was mentioned in a comparison of simu- lated and experimental topographs (Gronowski & Kowalski, 1981). It is very clearly seen on practically all simulated topographs of Fig. 4 and quite well on many of the experimental ones. It is represented as a straight line on the diagram of Fig. 5. Its contrast is the strongest when the dislocation lies closest to the direct-beam side of the Borrmann prism. This is confirmed by simulations; if the dislocation lies in the incident beam, the contrast of this image is maximum while it is not to be seen if the dislocation lies in the reflected-direction side of the Borrmann prism (Authier, 1985). The length of the image is propor- tional to the depth of the dislocation inside the crystal as will be clear from its geometrical construction, which will be described in § 6 in connection with the formation of the dynamical image (Figs. 7 and 9). This is why it is most visible on experimental topographs when the dislocation lies deepest in the crystal (see also Fig. 11).
One of us (Authier, 1985) performed simulations for the same crystal and dislocation geometry but a larger crystal thickness. The intermediary image is then very clearly visible because it contains more fringes and it can be seen that the new image is actually part of the intermediary image. This is confirmed by simulations made with a large value of/~t for which the inter- mediary image has a strong contrast while the direct image is almost absorbed out.
6. Geometrical shape of the dynamical image
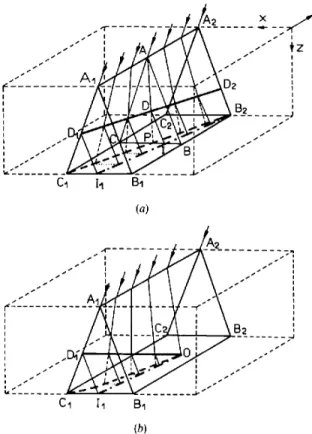
Figs. 6 and 7 illustrate the formation of the dynamical image from a geometrical point of view. Fig. 6(a) shows the paths of the wavefields propagating from the apex of the Borrmann triangle to the dislocation for several planes of incidence. Let AtB~C ~ and A2BzCz be those which pass through the intersections D~ and De of the dislocation with the direct and reflected beams, respectively, and ABC a particular plane of incidence. Further, let D be the intersection of the dislocation with that plane, P the intersection of the wavefield propagating along AD with the base BC of the Borrmann triangle, I and It, the projections of D and D~ on BC and on BICt, the reflected direction, respectively.
The top part of Fig. 7(a) shows the frontal projec- tion of all the planes of incidence and the dislocation on the particular one, ABC, and the bottom part a projection on the photographic plate in the reflected direction. The section topograph is limited by the projection b~bzc~cz of the base of the Borrmann prism and the dynamical image lies along the projection c~pb2 of the curve C~PB2. The line b2ii~ is the
projection of the dislocation and is part of the direct image on a traverse or projection topograph (Lang, 1958). On the section topograph, the direct image is a spot centred around the projection i 1 of D1, and along b2ii 1 can be seen this concentration of intensity, which was described at the end of § 5 and looks like the extremity of the intermediary image.
Figs. 6(b) and 8 illustrate situations where the outcrop of the dislocation at the exit surface of the crystal lies within the Borrmann prism. Figs. 6(b) and 8(a) correspond to the case where the dislocation intersects the direct beam. The dynamical image is along opcl and the reflected direction along oil (Fig. 8a). This situation is that of the experimental and simulated topographs of Figs. 4(a)5 and 4(b)5. Fig. 8(b) describes a situation where the dislocation does not intersect the direct beam. There is no direct image and the dynamical image bzpo lies very close to the projection of the dislocation line on the section topo- graph. This situation is that of the experimental and simulated topographs of Figs. 4(c)5 and 4(d)5.
Let us now consider a set of coordinate axes bzX,
s ~ ' S I ~ ~ ~ " f l ~ ~ . " I ...._ .. . . " t,. t'A \ A s S I s "S I.r,,.~ ~ S S . . . ..,Is ~ S S S " CI II BI (a) . . . M ... s s t ° i s S S ~-_ . . . ~ . . . . 2 - - " C1 ll BI (b)
Fig. 6. Projection of the dislocation on the exit surface of the crystal: (a) The dislocation intersects both sides of the Borrmann prism at D1 and D2. CIB2: shadow of the dislocation cast along the
direction of propagation of the wavefields; it corresponds to the dynamic image. IIBz: projection of the dislocation along the reflected direction; 11 corresponds to the direct image. (b) The dislocation intersects only the direct-beam side of the Borrmann prism. ODI is the dislocation, 0C1 its shadow. 011 its projection in the reflected direction.
A. AUTHIER, M, L E F E L D - S O S N O W S K A , Y. E P E L B O I N A N D A. SOYER 99 O, ~ ° ~ .
,4\
•D.L
~ ° C B T " ~ 0 \\ ~',, ~ - - \\ \\ .-- --"~ ~ C .... ~ / b X °°°.-'°'° °" 1 (a) ~ " ~ ° ~ ° 2 ° B/ ]/P; / t t / / \C / " 0 I i I I I I I I I I i/ I i I / / I // / / I ///,,'/../,
b,l / , ' 1 , 1
" ' " ' - t L "bl
I
/ I .... "-Icz/
(b)Fig. 7. Construction of the direct and dynamical images (a) 333 reflection; (b) 333 reflection. The top part of each figure is a projection of the crystal on a particular plane of incidence, ABC. DtD 2 is the projection of the dislocation on that plane, D its intersection with it. The bottom part is a projection on the photographic plate; bc is the trace of the plane of incidence ABC, b2i 2 is the projection of the dislocation and i2 the direct image; b2c~ is the projection of the shadow cast on the exit surface by the dislocation, it is its dynamical image.
\ \\ '
\
\ \ B\\.
\\ I
d
e o...- \1 (a)t
/ / (b)Fig. 8. Same construction as for Fig. 7 but for a situation where the dislocation intersects one side only of the Borrmann prism. (a). 333. The dislocation intersects the direct beam side of the Borrmann prism. There is a direct image i~ and a dynamical image ocl. (b) 33.3. The dislocation intersects the reflected beam side of the Borrmann prism. There is no direct image and only the dynamical image oh2.
100 X-RAY SECTION TOPOGRAPH IMAGES OF A DISLOCATION
b 2 Y in the plane of the section topograph (Fig. 7a). It can be shown that the equation of the dynamical image
b2pc~
is given byZ t a n - ~5(tan 0t - tan
O)x
Y= tan 0t+tan
O-2x
tan 0 ' (6.1) where x, y and Z are reduced coordinates:x=X/b2c2; y= Y/b2c2; Z=zl/t
(b2c2 = 2t sin 0). X and Y are the coordinates of point p of the dynamical image,
b2c2
is the width of the section pattern, zx the depth of D~, t the crystal thickness; tan 0t is given by (2.2).Equation (6.1) shows that the shape of the dynam- ical image is a hyperbola. The angle ~ between the projection of the dislocation on the section topograph and the axis of that section are given in terms of the direction cosines of the dislocation by
tan 6 = (u cos 0 + w sin
O)/v.
(6.2) The slope of the lineb2c1
(Fig. 7a) that connects the two ends of the dynamical image is given by:tan 5 ' = tan
6/Z
(6.3) when the dislocation line intersects both sides of the Borrmann triangle;tan 5 ' = (u cos 0 - w sin
O)/v
(6.4) when the dislocation intersects the direct beam side only (Fig. 8a);6'=5
(6.5)when the dislocation intersects the reflected-beam side only (Fig. 8b).
It can be noticed on the topographs of Fig. 4 that the dynamical image lies below the direct lmage for the 333 reflection and above it for 333. This can be readily understood from a comparison of Figs. 7(a)
1 2 3 4 5
33§
\
\
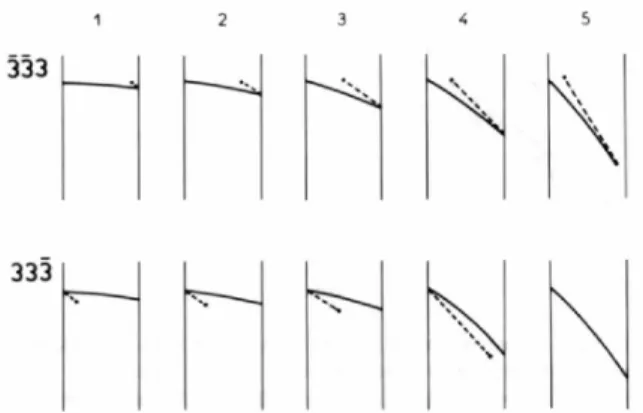
Fig. 9. Calculated dynamical images for the topographs of Fig. 4. The black dot represents the direct image and the dashed line the projection of the dislocation line.
and 8(a) on one hand and Fig. 7(b) and 8(b) on the other, which illustrate the construction of the dynam- ical image for the two situations, respectively. It can further be noticed in these figures that for 333 the dynamical image lies between the projection
b2il
of the dislocation andb2c,
and outside the angle formed by these two lines for 333. These remarks would be reversed if the slope of the projection of the dislocation on the plane of incidence had the opposite sign. Coupled with (6.3) to (6.5) they confirm that the orientation of the dislocation can be deduced from these if its direct and dynamical images on a traverse and a section topograph, respectively, are taken with a single reflection only (Authier, 1961).As an illustration of the agreement between the observed and calculated shape of the dynamical image, Figs. 9(a) and (b) represent the calculated shape of the dynamical image and the predicted line of concentrated intensity for each of the section topo- graphs of Figs. 4(a) and (b) and 4(c) and (d), respectively.
7. Variation of the contrast with depth of the dislocation for several orientations 7.1.
Observations
Fig. 10 compares computer simulations of the image of the dislocation for the 333 reflection and a depth of 20 lxm and two orientations of the dislocation line with respect to their Burgers vector ½[011] in the slip plane, 60 and 98 ° . It can be observed that the dynamical image is in both cases practically normal to the axis of the section but that the perturbation of the Kato
Pendell6sung
fringes extend over a much greater distance for the dislocation which is practically along the edge than for the 60 ° one.Figs. 1 l(a) and (b) compare simulated and experi- mental images for similar conditions as before but for depths of 240 and 350 lxm respectively and for four orientations of the dislocation with respect to its Burgers vector in the slip plane: 60, 72, 90 and 98 ° .
(a) (b)
Fig. 10. Variation of the contrast with orientation for a given depth of the dislocation. Simulated topographs, 333 reflection, depth 20 lain. Burgers vector ½ [011"]. (a) Angle tO of the dislocation to its Burgers vector: 60 °, angle 6 of the projection of the dislocation on the section topograph to the trace of the beam (see Fig. 7): 120 °. (b) tO = 98 °, 6 = 158 °.
A. AUTHIER, M. LEFELD-SOSNOWSKA, Y. EPELBOIN AND A. SOYER 101 1 2 3 4 (b) } --, , " a ~!1 (c) (~
i
Fig. 11. Variation of the contrast of the dislocation with orientation for two values of the depth. Comparison between simulations (a and c) and experimental topographs (b and d). 33] reflection, Burgers vector ½[01I]. (a) and (b) depth: 240 lam. Orientations (from left to right): ~t
102 X-RAY S E C T I O N T O P O G R A P H I M A G E S O F A D I S L O C A T I O N
Here it can be observed that for a given depth of dislocation the main features of the dislocation remain unchanged except for a rotation. It can therefore be concluded that when the dislocation lies deeply inside the crystal the orientation of the image depends very strongly on the orientation of the line while this is not the case when the dislocation lies close to the entrance surface.
7.2. Discussion
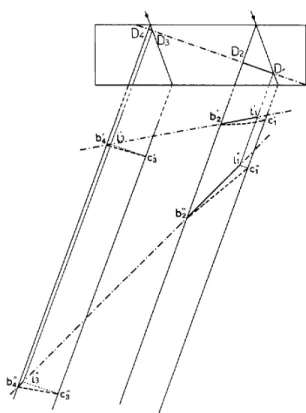
The variation of the orientation dependence of the image with the depth of the dislocation can be under- stood by reference to the variations with depth of the dynamical image. Fig. 12 compares the dynamical images of the dislocation for two orientations of its projection on the photographic plate and two po- sitions of the Borrmann triangle, one for which the dislocation lies very close to the entrance surface and the other for which the dislocation lies close to the exit surface. In the former case the orientation of the dynamical image is seen to be practically normal to the section pattern, whatever the orientation of the dislocation. This is because when Z tends towards 0 in
,,,•
"'--... [~2 .--.s i / / t I
j/
/
.
t; '
".;.-b', .
~
... - -b-'~'/~
/ L.,
'~//
Fig. 12. Variation of the dynamical image with depth and orienta- tion of the dislocation in its slip plane. DtD2D3D4 projection of the dislocation on the plane of incidence i'lbzi'3b'4, i~b2i]b'~
projections of the dislocation on the photographic plate for two orientations of the dislocation in the slip plane. Note that the dynamical images (dashed lines) are close to the projection of the dislocation when it lies close to the exit surface and close to the trace of the plane of incidence when the dislocation is near the entrance surface.
(6.3), &' tends towards 90 ° whatever the value of 6. On the contrary, when the dislocation lies close to the exit surface, Z tends towards 1 and 6' is practically equal to 6.
7.3. Application
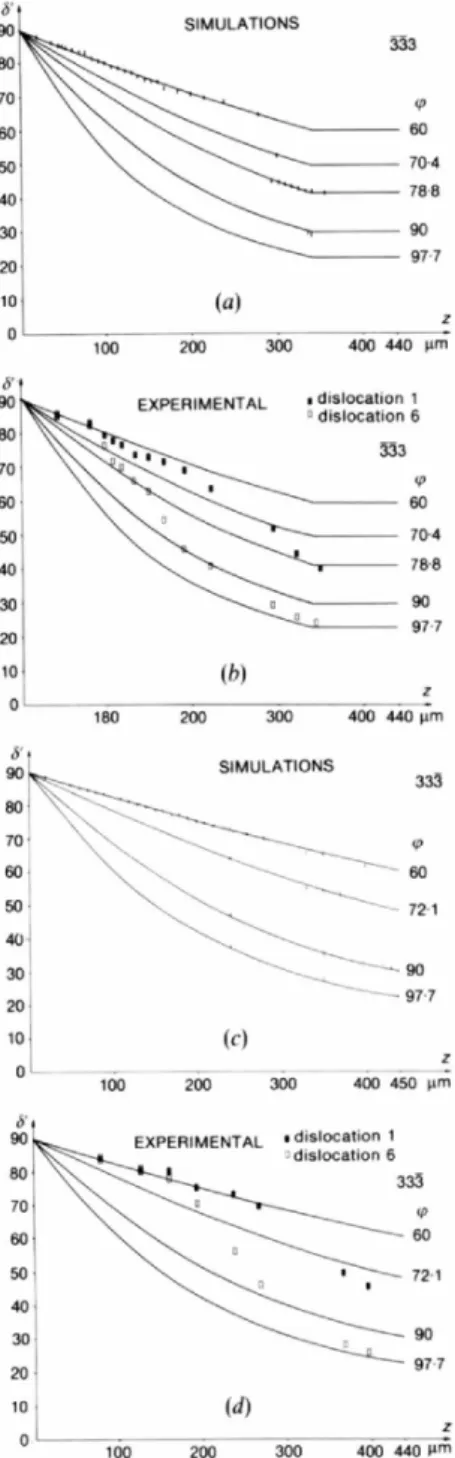
It so happens that with the geometry of the disloca- tions studied here the dislocation image does not differ very much from a straight line (see Fig. 7). This is because the angle ~ of the projection of the dislocation on the plane of incidence with the normal to the crystal surface is close to 90 ° . It is therefore possible to measure the orientation 6' of the dynamical image either on an experimental or on a simulated topograph and to compare it with the value calculated from (6.3), (6.4) or (6.5) according to the geo- metrical situation. This is done in Figs. 13(a) to 13(d). The values calculated for five different orientations tp of the dislocations are plotted in terms of the depth of their intersection with the direct beam in Figs. 13(a) and (b) for 333 reflection and in Figs. 13(c) and (d) for 333. The values measured on the simulations per- formed for the same orientations and various depths of the dislocation are represented in Figs. 13(a) and (c). The agreement is seen to be very good with the calculated curves. Figs. 13(b) and (d) represent the values measured on experimental topographs taken at successive positions of the entrance slit for the two dislocations labelled 1 and 6 in Fig. 1. It can be seen that close to the entrance surface the dislocations are of 60 ° type and that close to the exit surface disloca- tion 1 makes an angle of about 80 ° with the Burgers vector and dislocation 6 an angle of about 98 °, in agreement with the observations made on traverse topographs. It can also be observed that the depth at which the dislocations start rotating away from the 60 ° orientation seems to be different depending on whether it is measured on the 333 or on the 333 reflection. This is easily understood from Figs. 7(a) and (b): for the same depth Zl of the intersection of the dislocation with the direct beam, the part of the dislocation that lies within the Borrmann triangle is situated below this depth in the former case and above it in the latter. It is a different par, ~ of the dislocation, with a different orientation, that is therefore giving rise to the dynamical image in each case, which explains the observed result.
8. Variation of the contrast with the sign of the Burgers vector
In order to try to determine the sign of the Burgers vector whose direction was shown to be ½[01]] by usual topographic techniques (Lefeld-Sosnowska & Zawadzka, 1978), computer simulations were made for both I[01T] and ½[011] Burgers vectors, for many values of the depth of the dislocation and for both 333 and 333 reflections. An example is given in Fig. 14 for
A. AUTHIER, M. LEFELD-SOSNOWSKA, Y. EPELBOIN AND A. SOYER 103 SIMULATIONS , ~ 70
~
70"4 ~ 97"7 lO (a) z 0 100 200 300 400 440 I.tm 0 ,s,o at,oo 0 7 0 4:
~ 97.7 lO (b) 180 200 300 400 440 p.m 9~' ~ : ~ SIMULATIONS 33~ 7 0 m ' 9 0 97"7 lO (c) z 0 . . . . . 100 200 .... 300 400 450 p.m 9 ~ ' ~ 1 ~ , ~ _ EXPERIMENTAL ,dislocation 1 I ~.~----Ik~ _ ~ dislocation 6 50 72-1 3 0 .7 2 0 101 (d) z o 100 200 300 400 440 I~mFig. 13. Variations of the angle 6' between the dynamical image and the trace of the beam on the section pattern with the depth of the dislocation for several orientations tp of the dislocation in the slip plane (tp is the angle with the Burgers vector). (a) 3~3 reflection. The curves represent the values calculated according to (6.3) and the error bars to the values measured on the simulations. When the dislocation is so deep that it intersects the direct beam only, the orientation of the dynamical image becomes constant (6.4). The limiting value for the depth is here equal to 341 lam. (b) ~]3. The curves are the calculated ones according to (6.3) and (6.4) and the rectangles represent the values measured on the experimental topographs for two different dislocations, labelled 1 and 6 in Fig. 1. The sizes of the rectangles give the error bars. (c) and (d) Same thing for the 33~ reflection.
a dislocation d e p t h of 330 ~tm. It can be seen t h a t no difference in c o n t r a s t can be detected between the two orientations of the Burgers vector, a l t h o u g h on a false color display which e n h a n c e s small c o n t r a s t dif- ferences a small difference in intensity of the K a t o fringes can be observed between the top a n d the b o t t o m p a r t s of the image. This difference reverses when c h a n g i n g the sign of either the Burgers vector b or the diffraction vector h a n d remains c o n s t a n t when h.b is also constant. W h e n the depth of the dislocation is smaller the differences are slightly m o r e visible, even on black a n d white displays. F o r instance, Fig. 15 shows a 333 simulation for a dislocation depth of 44 ~tm a n d a ½[011] Burgers vector. This simulation, cal- culated with a n e n t r a n c e slit of 12~tm, is to be c o m p a r e d with the first t o p o g r a p h of Fig. 4(b) cal- culated for the same reflection a n d the same disloca- tion d e p t h b u t a ½[011] Burgers vector a n d with the first t o p o g r a p h of Fig. 4(a), which is an experimental one. It can be seen that it is very difficult to determine which is the correct Burgers vector even if a careful e x a m i n a t i o n of the original seems to indicate that ½[011] is slightly m o r e likely.
This situation is very different from that studied by Epelboin (1974) with a dislocation having a different g e o m e t r y a n d a thicker crystal where the i n t e r m e d i a r y image is very i m p o r t a n t . A m a r k e d difference was then observed in the c o n t r a s t when c h a n g i n g the sign of the Burgers vector. T h a t the dislocation images studied in the present p a p e r are not very sensitive to the sign of the Burgers vector seems to be because for such a small crystal thickness the i n t e r m e d i a r y image has very few fringes. Indeed, on simulations p e r f o r m e d
(a) (b) (c) (d)
Fig. 14. Variation of the contrast with the sign of the Burgers vector. Simulated topographs. Depth: 330~tm. (a) 333, b=½[01T]; (b) 33~, b=½[0T1]; (c) 333, b=½[01i]; (at) ~3, b=½[011].
Fig. 15. Simulated topograph. Depth: 44 ~tm, 333, Burgers vector ½[0T1], opposite to that of the simulated image of Fig. 4(a)l. Width of the entrance slit: 12 I~m.
104 X-RAY SECTION TOPOGRAPH IMAGES OF A DISLOCATION
with the same geometry of dislocation but a thicker crystal, the intermediary image is very visible and changes markedly when changing the sign of the Burgers vector.
9. Sensitivity of the Kato fringes to small variations of the depth of the dislocation
Fig. 16 compares the five topographs calculated for an incident point source that have been used to simulate the first topograph of Fig. 4(b), which corresponds to a slit width of 12 lxm. They have been calculated for lateral translations of the crystal with respect to the entrance slit of 2.4 I.tm each time. Since the dislocation is inclined with respect to the crystal surfaces, the depth of its intersection with the direct beam changes for each position of the slit and takes the successive values of 30.7, 37.4, 44, 50-7 and 57.3 ~tm. It can be seen that as the depth of the dislocation changes the shape of the Kato fringes is modified, as is to be expected, and is very sensitive even to small changes.
10. Conclusion
This study, as several others before, has confirmed that dislocation images on section topographs can be simulated with very good agreement, which is highly improved when the width of the entrance slit is taken into account and that computer experiments are a very fruitful tool for the investigation of the mechan- ism of image formation.
The drastic variation of the contrast of the image with its depth inside the crystal has been shown by systematic studies both experimentally and with simulations and has been explained by simple geo- r, ietrical considerations. When the dislocation lies close to the entrance surface the orientation of its image is normal to the axis of the section pattern and practically does not depend on the orientation of the dislocation but the distance over which Pendell6sung
fringes are deformed does depend strongly on this orientation. O n the contrary, for the part of the dislocation that is close to the exit surface, its orien- tation depends primarily on that of the dislocation since it lies very close to the projection of the disloca- tion on the photographic plate.
A new feature in the dislocation image has been analysed. It is a concentration of intensity along the
projection of the dislocation on the photographic plate and is due to the propagation of energy along the reflected direction from points of the dislocation that are situated inside the Borrmann prism. It merges into the direct image for points of the dislocation that are very close to the direct beam, and seems to be the limit of the intermediary image.
An attempt has been made to determine the sign of the Burgers vector from comparison between experi- mental topographs and simulations made for the two opposite signs of the Burgers vector, the magnitude and direction of which were already known by usual topographic techniques. However, very small dif- ferences only have been observed and this is probably because the crystal is rather thin and the fringes of the intermediary image are not well separated. From the scant evidence, the Burgers vector has been assumed to be ½[011].
The further developments of this work will consist on one hand in a systematic study of the influence of orientation on all the features of the dislocation image in relation to the relative variations of equal strain and equal strain gradient surfaces and on the other in a study of the influence of absorption in order to analyse the various components of the image that are known to have very different absorption dependence.
The authors are greatly indebted to J. Bondziul (University of Warsaw) and to A. Jeanne-Michaud (Universit6 Pierre et Marie Curie) for their assistance in the preparation of the illustrations and to F. Morris (Universit6 P. et M. Curie) for developing the link between the computer and the picture system. One of us (AA) is very grateful to the University of Warsaw and to CNRS who made his stay in Warsaw possible.
References
ALDRED, P. J. E. & HART, M. (1973). Proc. R. Soc. London Set. A, 332, 223-238, 239-254.
ARISTOV, V. V., KOHN, V. G., POLOVINKINA, V. I. & SNIGIREV, A. A. (1982). Phys. Status Solidi A, 72, 483-491.
AUTHIER, A. (1961). Bull. Soc. Ft. Min&al. Cristallogr. 84, 115-127.
AUTmER, A. (1967). Adv. X-ray Anal. 10, 9-31.
AUTmER, A. (1977). X-ray Optics, edited by H. J. QUElSSER, p. 145. Berlin: Springer.
AUTHIER, A. (1985). In preparation.
(a) (b) (c) (d) (e)
Fig. 16. Topographs sim. ulated with a point source corresponding to successive positions of the crystal translated by 2.4 ixm intervals parallel to its entrance surface. The corresponding depths of the dislocation are equal to 30.7, 37.4, 44, 50-7, 57-3 lam from left to right, resPectively. These topographs were added to calculate the simulation of Fig. 4(a)l with an entrance slit of 12 lam.
A. AUTHIER, M. LEFELD-SOSNOWSKA, Y. EPELBOIN AND A. SOYER 105
AUTHIER, A., BALIBAR, F. & EPELBOIN, Y. (1970). Phys. Status
Solidi 41,225-237.
AUTHIER, A., MALGRANGE, C. & TOURNARIE, M. (1968). Acta
Cryst. A24, 126--136.
BALIBAR, F. & AUTHIER, A. (1967). Phys. Status Solidi 21,
413-422.
EPELBOIN, Y. (1974). J. Appl. Cryst. 7, 372-377.
EPELBOIN, Y. (1975). Acta Cryst. A31, 591-599.
EPELBOIN, Y. (1979). Acta Cryst. A35, 38-44.
EPELBOIN, Y. (1981). Acta Cryst. A37, 132-133.
EPELBOIN, Y. (1983). Acta Cryst. A39, 761-767.
EPELBOIN, Y. & AUTHIER, A. (1983). Acta Cryst. A39,
767-772.
EPELBOIN, Y. & PATEL, J. R. (1982). J. Appl. Phys. 53,
271-275.
GRONKOWSKI, J. & KOWALSK1, G. (1981). Acta Cryst. A37,
C251.
KATO, N. (1963). In Crystallography and Crystal Perfection,
edited by G. N. RAMACHANDRAN, p. 18. London:
Academic Press.
KOWALSKI, G. (1984). Phys. Status Solidi A, 84, 119-132.
KOWALSKI, G. & GRONKOWSKI, J. (1982). Phys. Status Solidi
A, 71, 611-617.
LANG, A. R. (1957). Acta Metall. 5, 358-359.
LANG, A. R. (1958). J. Appl. Phys. 29, 597-598.
LEFELD-SOSNOWSKA, M. (1978). Phys. Status Solidi A, 48,
565-569.
LEFELD-SOSNOWSKA, M. & ZAWADZKA, E. (1978). Acta
Cryst. A34, $250.
PETRASHEN, P. V. (1976). Fiz. Tverd. Tela, 18, 3729-3731.
SUVOROV, E. V., GORELIK, O. S. & PONOMAREVA, R. R. (1976).
Kristallografiya, 21, 1151-1157.
SUVOROV, E. V., POLOVINKINA, V. I. NIKITENKO, V. I. &