REVIEW
Direct analysis of dried blood spots coupled with mass
spectrometry: concepts and biomedical applications
Julien Déglon&Aurélien Thomas&Patrice Mangin&
Christian Staub
Received: 31 March 2011 / Revised: 17 May 2011 / Accepted: 2 June 2011 / Published online: 25 June 2011 # Springer-Verlag 2011
Abstract Because of the emergence of dried blood spots (DBS) as an attractive alternative to conventional venous plasma sampling in many pharmaceutical companies and clinical laboratories, different analytical approaches have been developed to enable automated handling of DBS samples without any pretreatment. Associated with selec-tive and sensiselec-tive MS–MS detection, these procedures give good results in the rapid identification and quantification of drugs (generally less than 3 min total run time), which is desirable because of the high throughput requirements of analytical laboratories. The objective of this review is to describe the analytical concepts of current direct DBS techniques and to present their advantages and disadvantages, with particular focus on automation capacity and commercial availability. Finally, an overview of the different biomedical applications in which these concepts could be of major interest will be presented.
Keywords Dried blood spots . Direct LC–MS–MS analysis . Ambient MS . Automated on-line DBS
Introduction
Although biological analysis is usually performed using plasma obtained by venipuncture, the use of dried blood spots (DBS) has grown in popularity in the clinical and pharma-ceutical communities over the past decade as an alternative sampling procedure. The numerous advantages of the DBS sampling process can be summarized as follows:
& Ease – DBS is less invasive than conventional whole blood, plasma, or serum sample collection [1–3] because the blood can be collected after a small finger prick (or heel prick for pediatric applications). Because of the ease of collection, DBS can be obtained in a non-hospital environment by minimally trained technicians or even at home by the patients themselves [4–6]. Moreover, the DBS process does not require use of an anticoagulant, or plasma separation, which limits the number of manipulations.
& Small sampling volume – less than 20 μL is usually spotted on to filter paper, whereas a minimum volume of 0.5 mL is required with conventional venous sampling. & Cost-effective process – the cost of shipping/storage of
filter paper cards is substantially reduced, because the DBS samples can be stored at room temperature without the use of dry ice [7].
& Analyte stability – it has been reported in numerous publications that DBS that have been stored over many months (even years) at ambient temperature are just as stable as plasma samples that were stored at−20 °C [8,9]. & Improved safety – during drying, most of the patho-genic agents are deactivated on the filter paper, which reduces the risk of infection to a minimum. Similarly, transfer of blood material on to a filter paper card is considered to have a low infection risk [4,10,11].
Published in the special issue Analytical Sciences in Switzerland with guest editors P. Dittrich, D. Günther, G. Hopfgartner, and R. Zenobi. Electronic supplementary material The online version of this article (doi:10.1007/s00216-011-5161-6) contains supplementary material, which is available to authorized users.
J. Déglon
:
A. Thomas:
P. Mangin:
C. Staub (*) Unit of Toxicology, CURML,1 rue Michel-Servet, 1211 Geneva 4, Switzerland e-mail: [email protected] J. Déglon
:
A. Thomas:
C. StaubSwiss Centre for Applied Human Toxicology, University of Geneva,
1211 Geneva, Switzerland DOI 10.1007/s00216-011-5161-6
These advantages make the DBS procedure a patient-friendly tool for blood collection, especially for problematic and vulnerable patient populations [12–14]. The ease of the process can also help in the recruitment of subjects (human and animal) for preclinical and clinical studies [15–17] and can significantly reduce the cost of these studies [18]. Interesting reviews covering these different aspects were recently published to promote the use of DBS in bioanalysis [19,20].
The first biomedical application of DBS on filter paper dates back to 1963 when Professor Robert Guthrie introduced this alternative sampling method for detection of phenylketonuria in the newborn population [21]. Detection ofL-phenylalanine was based on a microbiological
test that was sufficiently sensitive but with low analytical throughput. In the early 1990s, the development of PCR and immunoassays, including ELISA, RIA, or FIA, enabled the detection of DNA, viral RNA, antibodies, and hormones from DBS with an acceptable waiting time that was suitable for high-throughput analyses [22–27]. These advances extended the scope of applications of the DBS to the detection of different biomarkers in epidemiological studies [11,28].
At the same time, the detection of small pharmaceutical compounds was investigated by coupling liquid chroma-tography (LC), as separation technique, with UV or fluorescence detection. Although LC was, in general, more selective than immunoassays by separating the compounds of interest from the matrix before detection, the initial methods based on DBS–LC–UV were limited to the quantification of drugs at high concentrations [29–31], because of the poor sensitivity.
In fact, one limitation of DBS analysis is that the small volume of biomatrices spotted implies the need for highly sensitive techniques for detection and quantification of molecules present at concentrations below 1 ng mL−1[19]. A new generation of mass spectrometers (MS), particularly triple-quadrupole spectrometers (MS–MS) operating in MRM mode, have greatly improved sensitivity, which enables analysis of pharmaceuticals in the low therapeutic range [32]. Therefore, many studies have recently been published showing interest in coupling DBS samples with LC–MS–MS for measurement of therapeutic agents or biomarkers in clinical and research settings [33–37].
Before detection, the analytes must be extracted from the DBS to be more compatible with the analytical technique (for example, immunoassays or LC–MS–MS). Thus, an extraction is usually performed in off-line mode using a mixture of aqueous and organic solvents. This pretreatment step requires time and manipulation by technicians and can become problematic if the number of samples is large. Interestingly, the implementation of DBS support in pharmaceutical companies in the last five years has led to
the development of novel techniques for handling this new support before the analysis. This review will, therefore, highlight the recent developments that enable direct analysis of DBS samples either by direct insertion into conventional LC–MS–MS systems or by direct ambient extraction/ionization with subsequent MS–MS detection. Finally, an overview of the different biomedical applications will be presented.
Analytical concepts On-line DBS
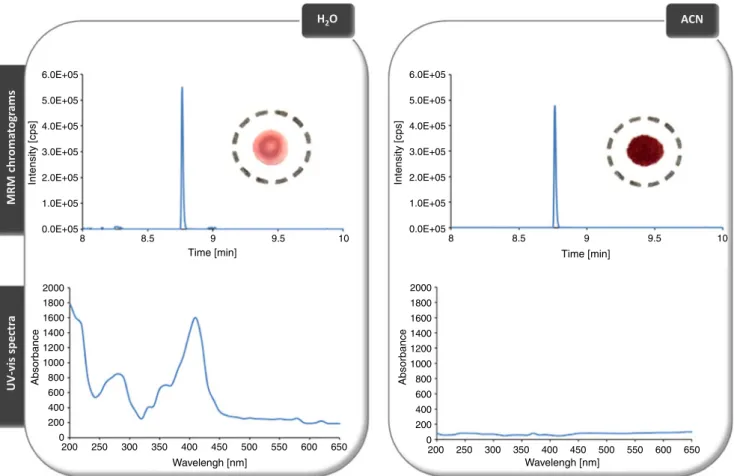
Integration of DBS with LC–MS is generally performed by solvent extraction, which ensures transfer of the analytes from the filter paper into an injectable solution that is compatible with LC, as discussed above. Emphasis on DBS sampling, especially in pharmaceutical analysis, has led to the development of novel techniques that enable high-throughput analysis. In a recent report, Déglon et al. described a novel concept that enabled on-line desorption of filter paper into an LC–MS system without any sample pretreatment [38]. For this purpose, a stainless steel desorption cell compatible with LC capillaries was designed to integrate the filter paper containing the dried spot. The behavior of the DBS during dynamic desorption (ensured by application of a constant flow rate) was also investigated to determine the kinetics and the efficiency of analyte desorption and their dependence on experimental conditions such as solvent and the flow rate. Experiments have shown that the type of solvent can selectively affect desorption output. As shown in Fig. 1, use of an aqueous solution led to complete desorption of analytes and matrix components, for example hemoglobin and proteins, which were monitored using MS–MS and UV–visible spectroscopy, respectively. Interestingly, use of organic solvents such as ACN or MeOH led to contrasting results—only the analyte of interest was monitored and the matrix components were not detected. This was in agreement with the color of the filter paper, which was maintained after organic desorption. In another study, Thomas et al. showed that selective desorption was applicable to a wide range of polarity compounds, for example hydrophobic and hydrophilic drugs and their phase I and II metabolites [15]. These results demonstrated that filter paper can not only be regarded as a biofluid support. Indeed, the intrinsic properties of cellulose have to be considered when developing sample preparation or investigating novel approaches, for example the development of selective chemical or affinity interactions on the filter paper. In this case, percolation of organic solvents through the filter paper induced protein precipitation “on support,” which enabled selective desorption of small molecules, for example drugs
and pharmaceutical compounds. Because of the well-known ion suppression encountered with atmospheric pressure ionization sources such as ESI, the ability to eliminate matrix effects without any sample preparation can be particularly beneficial when LC–MS analysis is performed. Post-column infusions have confirmed that this experimental design is promising in reducing or avoiding matrix effects, compared with conventional analysis of plasma. As illustrated in Fig.1, use of an aqueous desorption mobile phase (MP) can lead to rapid clogging of analytical systems, the risk of matrix effects, and the need to change chromatographic columns frequently.
The kinetics of compound desorption have been inves-tigated, and they were dependent on the flow rate and cell geometry. In the first test of cell geometry (in which a 10 mm i.d. filter paper was used), a flow rate of 0.25 mL min−1 was shown to give complete desorption after 5 min. Reduction of dead volume is particularly important to reduce desorption time to a few seconds while maintaining a low flow rate (0.1 mL min−1). However, this reduction implies a concomitant decrease in the size of the DBS used, and therefore in sensitivity, because, proportionally, a lower volume of blood will be desorbed.
The fact that desorption was performed with an organic solvent required the polarity of the MP to be adjusted using an additional pump (delivering aqueous MP) after desorption to ensure good trapping of the analyte on the reversed-phase column and to avoid compound dispersion. Therefore, focusing of the compounds can be performed on a trapping column in a column-switching setup or directly on the analytical column (because of very low desorption of the contaminants).
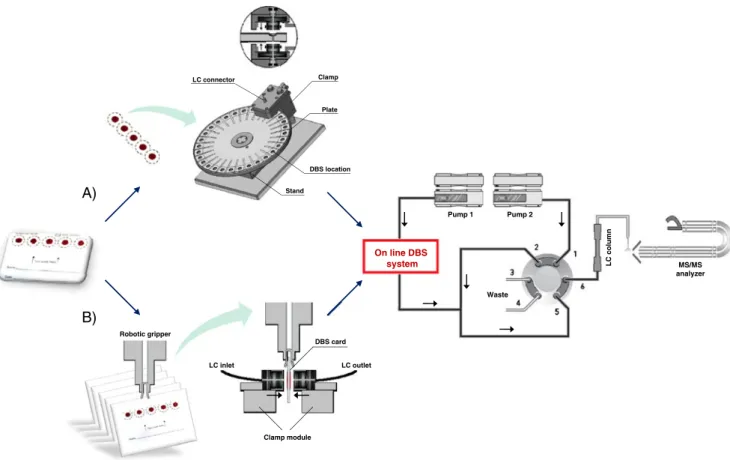
This concept was recently automated by Déglon et al. [39]. As illustrated in Fig.2A, the developed prototype was based on an automated rotating plate machined to host multiple wells in which filter paper can be placed manually. Next, an automatic clamp that contains two pistons was programmed to sequentially ensure locking of the well positions (followed by the desorption step) and was synchronized with an LC–MS–MS system. This system setup enabled many DBS samples to be analyzed. Further-more, Thomas et al. demonstrated that reduction of the flow rate to a few μL min−1with the automated system gave a desorption profile that was very close to an infusion profile, which enabled MS acquisition over several minutes [40]. Based on the selectivity of the process discussed above, this
6.0E+05 Intensity [cps] 5.0E+05 4.0E+05 3.0E+05 2.0E+05 1.0E+05 0.0E+05 8 8.5 Time [min] 9 9.5 10 2000 Absorbance 1800 1600 1400 1200 1000 800 600 400 200 200 250 300 350 400 450 500 550 600 650 Wavelengh [nm] 0 6.0E+05 Intensity [cps] 5.0E+05 4.0E+05 3.0E+05 2.0E+05 1.0E+05 0.0E+05 8 8.5 Time [min] 9 9.5 10 2000 Absorbance 1800 1600 1400 1200 1000 800 600 400 200 200 250 300 350 400 450 500 550 600 650 Wavelengh [nm] 0
Fig. 1 MRM chromatograms (top) and associated UV–visible spectra (bottom) obtained after on-line extraction with H2O (left) and ACN (right) of
approach was applied in a lipidomic approach for direct MS analysis of dried spots without any sample preparation or chromatographic separation (see the section “Biomarkers identification”).
In parallel, the robot industry has recently developed automatic systems for on-line DBS analyses [41, 42]. Prolab Instruments recently presented a commercially available solution called SCAP DBS based on the principles discussed above. In their configuration, an automatic clamp (with different available i.d. sizes) enables direct desorption of DBS integrated to a column-switching system with the presence of an auxiliary pump for dilution of the desorption MP [43]. The setup works directly on the DBS card without the previous punch-out step because desorption of the blood spot is ensured by the on-spot locking of the clamp, as shown in Fig.2B. Furthermore, this system is combined with the versatile CombiPal autosampler for successive handling of multiple DBS cards. In this configuration, a desorption of 0.5 min (for a total run time of less than 4 min) was shown to be a good compromise between sensitivity and extraction efficiency.
Compared with off-line extraction, which dilutes the analyte, a remarkable advantage of on-line DBS procedures is the efficient desorption of the compounds of interest
directly into the analytical systems; it is therefore a non-diluting procedure [44]. Recent applications based on automated on-line DBS analysis coupled to LC–MS–MS systems (in MRM mode) have enabled full validation of this technique using different pharmaceutical probes, for example oseltamivir [43], flurbiprofen and its phase I metabolite [39], and six tyrosine kinase inhibitors (data not given). Good accuracy and precision (<15%) have been obtained for these compounds, and the limit of quantification is as low as 1 ng mL−1. For these automatic systems carryover is low; this is explained by the cleanup position of the clamp after DBS extraction. The different aspects of the techniques that were discussed in this section are summarized in Table1. Surface sampling probe
Compared with the on-line DBS approach in which the analytes are desorbed from the filter paper by percolation of a solvent through the blood spots, a second approach, called surface sampling probe (SSP), extracts the compounds of interest from a surface by connecting this surface with a confined liquid stream dispensed by an appropriate probe [45]. The stream is both brought to the surface then carried on to the conventional LC–MS device or directly infused
Stand Clamp LC connector DBS location Plate Pump 1 Pump 2 On line DBS system Waste MS/MS analyzer LC column LC inlet LC outlet Clamp module DBS card Robotic gripper A) B)
Fig. 2 Illustration of two automated on-line DBS instruments, the automated on-line DBS prototype developed by Déglon et al. (A) and the SCAP solution commercialized by Prolab (B), and their respective integration into conventional LC–MS–MS systems
into the MS ionization source. Two different types of SSP have been published—the liquid microjunction-surface sampling probe (LMJ-SSP), which can be applied to extraction of analytes from the surfaces of hard and nonporous materials like glass or metal, and the sealing surface sampling probe (SSSP), by use of which porous surfaces, including most filter papers, can also be analyzed. SSSP
Direct liquid extraction based on SSSP is part of an emerging area in MS that combines ambient extraction of analytes contained in or on surfaces with ESI or APCI ionization. Initially, SSSP was developed to couple cost-effective thin layer chromatographic (TLC) separation with selective and sensitive MS detection. Luftmann reported an original device that enabled on-line transfer of TLC-separated compounds into a solvent stream toward MS [46]. Based on this proof-of-concept, Camag commercialized a TLC–MS interface that had the same characteristics as the Luftmann plunger [47]. However, unlike the latest development of the Luftmann plunger in terms of automation [48], Camag did not include automatic positioning of the plunger above the sample foil in its first version.
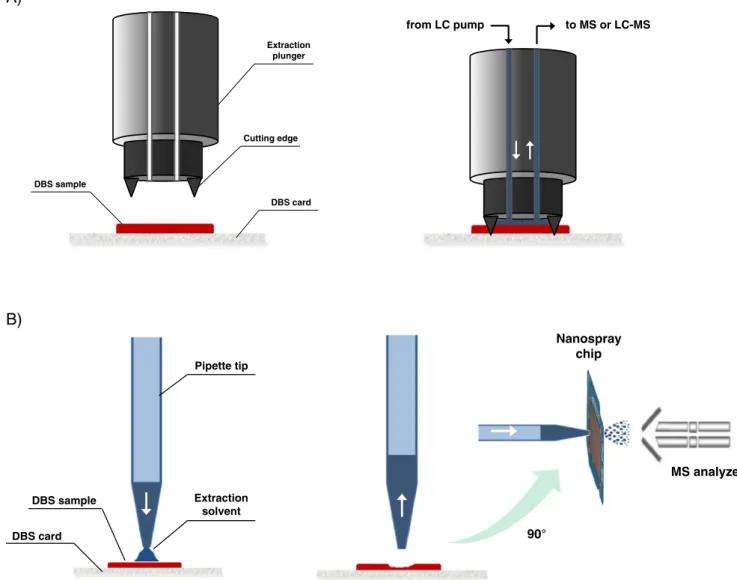
More recently, Van Berkel et al. extended the original use of the Camag TLC–MS interface for DBS analysis by replacing the TLC plates with filter paper sheets containing DBS samples [45]. Briefly, the Camag interface used for this approach comprised a stainless steel plunger (also called an extraction head) with a solvent inlet and an outlet capillary and a ring-shaped cutting edge at its end face (Fig.3A). Before analysis, the DBS samples were manually positioned under the extraction head assisted by a laser pointer, and the plunger was activated and pressed on the paper sheet by compressed air. The cutting edge severed the filter paper and formed a tight seal with the paper. The extraction solvent, which was delivered by a conventional
LC pump, entered the plunger through the inlet capillary, dissolved the analytes contained in the DBS, and left through the outlet capillary before ESI–MS detection. To avoid any clogging of the instrument, the outlet capillary was protected by a filter frit. A six-port valve enabled isolation of the solvent flow from the MS interface when the plunger was in the retracted position. Thus, the capacity of the Camag TLC–MS equipment to directly extract drugs from DBS previously spotted on filter paper was demon-strated for the first time. For these tests, sitamaquine and acetaminophen were used as probes to evaluate the reproducibility and the quantitative aspects of the system. Experiments were conducted using MeOH as extraction solvent at a flow rate of 0.2 mL min−1through a 4 mm i.d. plunger for a duration of 60 s, and the extraction was followed by direct MS detection in MRM mode. To eliminate carryover, the system was washed for 60 s between each DBS by sampling a blank zone on the filter paper. The spot-to-spot analysis time was approximately 3 min, which includes the DBS extraction and cleanup steps. The reproducibility of the extraction was excellent, carryover was low when using washout, and good quantification was achieved over the concentration ranges 10 to 10,000 ng mL−1 and 50 to 5000 ng mL−1 for sitamaquine and acetaminophen, respectively. Unfortunately, the effect of the matrix was not investigated in this study.
In parallel studies, Abu-Rabie et al. tested the Camag TLC–MS interface in combination with LC separation before MS detection [49]. On the basis of the same LC– ESI–MS–MS method, they compared traditional off-line DBS extraction and both modes of the Camag TLC–MS (with or without the LC column). For these experiments, different solvents, flow rates, and extraction times were tested in the analysis of DBS for various pharmaceuticals. Extraction solvents giving good sensitivity were usually a mixture of aqueous buffer and MeOH or ACN. Because of the lack of a second LC pump that could deliver H2O to
Table 1 Evaluation of the different techniques that enable direct DBS analysis coupled with MS–MS detection Criteria Direct DBS analysis techniques
Online DBS (SCAP) SSSP (TLC–MS) LMJ-SSP (LESA) Paper spray DESI (Omni Spray)
LC separation-compatible Yes Yes No No No
Sensitivity **** **** ** ** **
Quantitative performance **** **** ** * *
Automation/throughput *** * (***)a **** * *
Commercial availability Yes Yes Yes No Yes
Cost ** * *** n.d. *
a
Available soon
Criteria evaluation is based on four levels corresponding to low (*), medium (**), high (***), and very high (****). For cost evaluation, one * corresponds to a price going from 10,000 to 50,000 $.
focus the analytes ahead the analytical column, a higher flow rate was applied (between 0.5 and 1 mL min−1) during a very short period to obtain sufficient extraction efficiency. Under these conditions, the chromatographic peak shape was acceptable up to an extraction time of 5 s, after which it became increasingly broad. Use of short (i.e. 50 mm) LC columns with medium-sized (3 μm) particles enabled the application of high flow rates without generating excessive backpressure in the plunger. Despite the use of a very short extraction period, improved sensitivity was achieved compared with the off-line extraction mode, with which only part of the extraction solvent could be injected, which implies an important dilution factor. Bioanalytical valida-tion of the TLC–MS interface in LC–MS–MS mode was performed on sitamaquine and acetaminophen. According to international validation criteria, acceptable accuracy, precision, and linearity were achieved over the ranges 5 to
1000 ng mL−1and 50 to 50,000 ng mL−1for sitamaquine and acetaminophen, respectively. However, a substantial amount of carryover was observed; this required manual cleaning of the system.
Subsequently, Heinig et al. presented a TLC–MS interface that was integrated into a column-switching LC– MS–MS system that enabled quantification of drugs in DBS at concentrations as low as 50 pg mL−1 [44]. The increase in sensitivity compared with the work discussed above was because of the combination of a longer extraction step (typically 45 s) with focusing of analytes ahead of the trapping column ensured by a tee connector and a second LC pump delivering high H2O flow rate (see the section“On-line DBS”).
The SSSP technique, by means of the commercial TLC– MS interface, has proved to be a promising method with sufficiently reproducibility and sensitivity with a suitable DBS card DBS sample Pipette tip Extraction solvent Nanospray chip 90° MS analyzer Cutting edge Extraction plunger DBS card DBS sample from LC pump to MS or LC-MS
A)
B)
Fig. 3 Schematic views of the extraction head of the Camag TLC–MS interface (A) and the TriVersa NanoMate of Advion operating in LESA mode (B) for the direct extraction of DBS samples with subsequent MS detection
delay for high-throughput DBS analysis (Table1). Intrinsi-cally, the total run time using LC separation was similar to the run times obtained by use of SCAP technology [43]. However, the TLC–MS interface suffers from an important lack of automation, because three manual operations (DBS positioning below the extraction head, activation of the plunger, and the six-pore valve switch) were required before the start of an analysis. To handle larger sample numbers by feeding the DBS card automatically into the extraction device, Camag is currently developing an automated system for routine application which should be commercially available during 2011 [50].
LMJ-SSP
In the LMJ-SSP approach, the analytes are extracted from the surface by connecting the surface to a wall-less liquid microjunction dispensed by an appropriate probe. Unlike the SSSP technique, in which the plunger forms a sealed contact with the sampling surface, the probe used in the LMJ-SSP is positioned an appropriate distance from the surface (typically 0.2 mm), and a liquid microjunction is then formed by enabling the liquid from the end of the probe to extend from the probe to the surface [51]. Because of the dynamic solvent flow and the lack of sealing, the current LMJ-SSP probe is unsuitable for extraction of porous surfaces. In the analysis of DBS, the liquid micro-junction will not remain in contact with the filter paper because of its high absorption capacity. However, an interesting alternative which overcomes this limitation is use of the Advion TriVersa NanoMate system operating in LESA mode in which a static microjunction can be performed. As depicted in Fig.3B, the TriVersa NanoMate is constituted of two distinct parts: a robotic arm with adequate conductive pipette tips ensuring that samples are loaded, and a chip that contains microfabricated nozzles to generate a nanoelectrospray of the liquid samples. Before the surface sampling process, the robotic arm picks up a conductive pipette tip and moves above the well that contains the extraction solvent. A few microliters (usually 1 to 5 μL) are loaded in the pipette tip and the arm automatically goes to the desired extraction zone (DBS). The arm is then lowered to an appropriate distance from the target spot, and part of the extraction solvent is dispensed on to the sample surface to form a static liquid micro-junction between the end of the pipette tip and the surface. Immediately thereafter, the solution is aspirated back into the tip and is finally sprayed through a nanospray nozzle for subsequent MS detection.
Kertesz and Van Berkel published an interesting paper on the feasibility of this concept [52]. Based on the NanoMate TriVersa operating in LESA mode, they performed quanti-tative analyses of pharmaceuticals from three different
surfaces—MALDI plates, thin tissue sections, and DBS. For the DBS, quantitative investigation was performed using sitamaquine in a 4-mm DBS using a mixture of ACN, MeOH, and an aqueous buffer as the extraction solvent. In this experiment, 4 μL was loaded in the pipette tip and 3 μL was dispensed on to the DBS samples before nanoESI–MS–MS detection; this led to a total run time of approximately 2 min per sample.
Quantitative performance was also investigated by the authors. in accordance with international guidelines, LOQ was set to 100 ng mL−1(<15% precision, <15% accuracy). An important bias (77%) and poor precision (98%) were observed at lower concentrations (10 ng mL−1) even though a deuterated internal standard was used. Quantitatively, on-line DBS or SSSP could reach an LOQ that was 100 times lower [39,44]. This can be explained by the use of dynamic extraction flow applied to the DBS compared with the static transfer that occurred in the LMJ delivered by the LESA pipette tip. Moreover, the lack of an LC setup to ensure focusing of the desorbed analytes contributes to limiting the sensitivity.
However, LMJ-SSP with the TriVersa NanoMate has two principal advantages compared with the Camag TLC–MS interface. First, it is a carryover-free approach because the pipette tip and nanospray nozzle are changed between each analysis, which means that no cleanup step is required. Second, the procedure is automated, which enables high-throughput analysis.
Although the Triversa NanoMate combines the advantages of a nanoESI source with direct extraction of a sampling surface, the cost of this system is 10 times higher than the instrument commercialized by Camag (Table1).
Desorption electrospray ionization and paper spray In this section, we will discuss two ambient ionization MS (AIMS) methods used for direct analysis of the DBS— desorption electrospray ionization (DESI) and paper spray (PS). The AIMS techniques enable ionization of untreated samples in an open environment [53]. No sample pretreat-ment is required and analysis is very fast with the time scale limited to the time needed to present the sample to the MS [54]. Because of these features, AIMS methods are particularly suitable for high-throughput analysis.
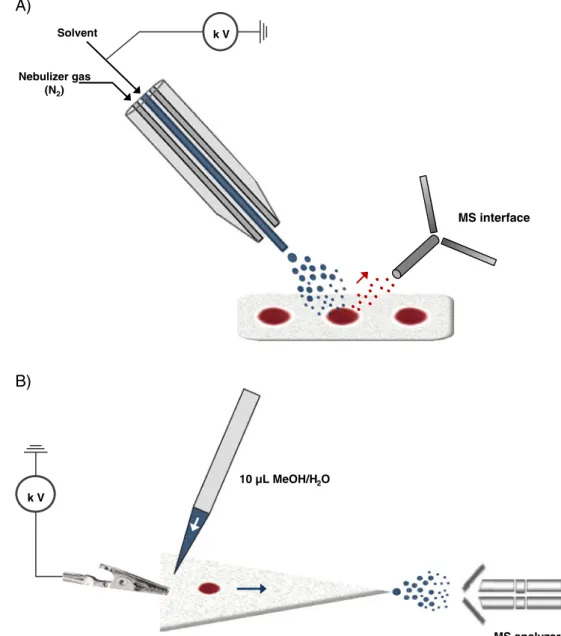
Among recent AIMS techniques, DESI developed by Cooks et al. in 2004 is regarded as the initial technique. Briefly, the main DESI mechanism can be describe as “droplet pick-up” [55] (Fig. 4A). In this process, ions are generated from the sampling surface by bombardment with charged micro-droplets through the atmosphere. The impact of the spray causes the formation of a microscopic layer of liquid on the sample surface, which results in dissolution of the analytes. This process is directly followed by desorption
by momentum transfer when additional droplets collide with the liquid layer and force the dissolved analytes into the gas phase as micron-sized droplets [56]. After their evaporation, which is assisted by a standard heated capillary extending from the MS inlet, the charged droplets produce free gas-phase ions when entering the MS interface.
Recently, Wiseman et al. experimented with DESI methodology for direct analysis of pharmaceutical com-pounds in DBS [57]. For this purpose, sitamaquine, terfenadine, and prazosin were chosen as probes and verapamil was used as the common internal standard. In these preliminary experiments, DBS were cut into strips and secured to a glass slide, and a commercial DESI source
(Prosolia Omni Spray 1D Ion Source) was coupled with an MS–MS instrument. Each DBS was therefore analyzed by scanning across the DBS surface at a rate of 200 μm s−1, which resulted in a peak 40 s wide on the ion chronogram. The solvent flow rate delivered by the sprayer was also investigated and was set at 15 μL min−1 as a good compromise between sensitivity and cross-contamination. Good signal intensity and stability were obtained when solvent extraction was performed with 80:20 ACN–H2O containing 0.1% formic acid.
Under these conditions, full validation was performed on sitamaquine in the concentration range from 10 to 10,000 ng mL−1. Unfortunately, accuracy and precision of the values for QC samples at 10 and 40 ng mL−1 were k V Solvent MS interface Nebulizer gas (N2) k V MS analyzer 10 µL MeOH/H2O
A)
B)
outside the pre-defined performance criteria (>15%). Thus, the quantitative performance of DESI was similar to that of LMJ-SSP using LESA (see the section “LMJ-SSP”). The authors also investigated the ion-suppression effect. They demonstrated that the concentration of IS added (between 500 and 2500 ng mL−1) led to suppression of the sitamaquine response by a factor of ten. This ion suppres-sion explains the quantification problems that arose at low concentration.
An alternative to DESI for direct DBS analysis is the PS approach. This technique enables ions to be generated from a liquid sample loaded on to a piece of filter paper by applying a high potential to the wet paper [54]. Indeed, the wet paper is conductive and the network of cellulose fibers forms microchannels for liquid transport. As shown in Fig.4B, the high potential applied between the base of the paper (previously cut into a triangular shape) and the MS inlet generates an electric field that induces charge accumulation at the apex of the paper triangle, which faces the MS inlet. Similar to ESI, Coulombic forces fracture the liquid to form charged droplets, which undergo desolvation and generate dry ions. On the basis of this mechanism, Liu et al. recently developed a method that enabled direct analysis of atenolol from a 0.4-μL DBS previously spotted on to filter paper [58]. Briefly, triangular paper (10 mm long and 5 mm wide at its base) containing the DBS sample was held by a copper clip in front of the MS inlet at a distance of 3 mm. Next, 10μL 1:1 MeOH–H2O was applied near the base of the paper triangle to wet the paper and extract the analytes, and a 4.5-kV potential was applied while the mass spectra was recorded in MRM mode. The results showed the LOD was 1 μg mL−1 for atenolol; no other quantitative aspects were investigated. As previously described, use of an organic solvent (MeOH in this instance) enabled the blood cells to remain on the filter paper, whereas dissolved molecules were carried to the paper tip and released in the spray.
Wang et al. showed the quantitative potential of this technique by quantifying imatinib in a 0.4-μL DBS in the concentration range 62.5 to 4000 ng mL−1, with labeled compound used as an internal standard [59]. Nevertheless, full validation of this process must still be completed to characterize the technique.
The AIMS methods, for example DESI and PS, are an interesting alternative for direct DBS analysis, because the procedure is relatively user-friendly and pretreatment-free. However, the very small blood volume spotted (0.4μL for PS) and the lack of LC columns results in relatively low sensitivity compared with other methods (Table1). Moreover, substantial ion suppression in the DESI approach limits quantitative performance.
Applications
Although plasma sampling is still the gold standard in pharmaceutical and clinical laboratories, DBS is becoming increasingly accepted in biomedical applications, particularly in pediatrics in the USA, where 95% of newborns are screened for inborn metabolic disorders [60,61]. As demonstrated by recent publications, this alternative sampling procedure has been successfully introduced for other applications, including clinical investigations, TDM programs, and epidemiological or surveillance studies [62]. Although these methods are mainly based on off-line extraction of filter paper, promotion
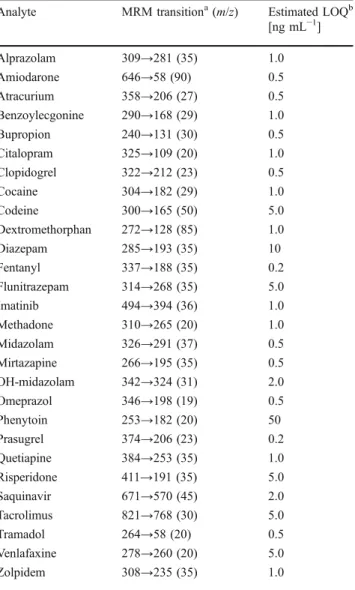
Table 2 Representative MRM transitions of pharmaceuticals and metabolites
Analyte MRM transitiona(m/z) Estimated LOQb [ng mL−1] Alprazolam 309→281 (35) 1.0 Amiodarone 646→58 (90) 0.5 Atracurium 358→206 (27) 0.5 Benzoylecgonine 290→168 (29) 1.0 Bupropion 240→131 (30) 0.5 Citalopram 325→109 (20) 1.0 Clopidogrel 322→212 (23) 0.5 Cocaine 304→182 (29) 1.0 Codeine 300→165 (50) 5.0 Dextromethorphan 272→128 (85) 1.0 Diazepam 285→193 (35) 10 Fentanyl 337→188 (35) 0.2 Flunitrazepam 314→268 (35) 5.0 Imatinib 494→394 (36) 1.0 Methadone 310→265 (20) 1.0 Midazolam 326→291 (37) 0.5 Mirtazapine 266→195 (35) 0.5 OH-midazolam 342→324 (31) 2.0 Omeprazol 346→198 (19) 0.5 Phenytoin 253→182 (20) 50 Prasugrel 374→206 (23) 0.2 Quetiapine 384→253 (35) 1.0 Risperidone 411→191 (35) 5.0 Saquinavir 671→570 (45) 2.0 Tacrolimus 821→768 (30) 5.0 Tramadol 264→58 (20) 0.5 Venlafaxine 278→260 (20) 5.0 Zolpidem 308→235 (35) 1.0 a
The collision energy (eV) is indicated in parentheses
bLimits of quantification (S/N>10) estimated for 5μL DBS samples
analyzed on a 5500 QTrap mass spectrometer in ESI mode. Extraction was performed by use of automated on-line DBS followed by RP-LC separation on a Kinetex C18column (2.1 mm×50 mm, 2.7μm i.d.)
of the novel techniques discussed in this review will ensure new opportunities in these fields. The next sections of this review will present a non-exhaustive list of applications for which direct and automated DBS analysis are suitable. General unknown and target screenings
In biomedical applications in which rapid and comprehensive analytical tools are required, for example in general unknown screening (GUS) and target screening (TS), direct DBS analysis may be an attractive solution because it combines a friendly sampling process with sensitive and selective MS–MS detection.
LC–MS–MS has, moreover, recently been applied to GUS and TS strategies [63]; the capacity of direct DBS analysis enabled simultaneous acquisition of different MS–MS experiments increasing the information obtained in a single run [64], and the development of novel bioinformatic tools that ensure complex data mining [65].
Among the different direct DBS techniques discussed above, on-line DBS and SSSP (i.e. the Camag interface) combined with LC separation capacity, seem to be
particularly convenient for identification of compounds in complex biomatrices. In our laboratory, we recently developed a TS strategy that enabled the identification and semi-quantification of 90 selected pharmaceuticals and metabolites by automated on-line DBS LC–MS–MS, with a run time of 10 min. Representative MRM transitions and the estimated LOQ are listed in Table 2 and the complete list is given in Electronic Supplementary Material TableS1. All of the compounds of interest were tested using automated on-line DBS with RP-LC separation before MS–MS detection in ESI mode.
Preclinical study
With regard to the recent implementation of the DBS sampling process in the pharmaceutical industry, it is apparent that DBS are becoming increasingly important in preclinical studies of drug metabolism and pharmacokinetics (DMPK) [66]. In the early stages, drug candidates are tested for ADME properties using small animal models, in which amounts of biological material are often restricted [16]. Thus, if a conventional sampling procedure is used (plasma), one
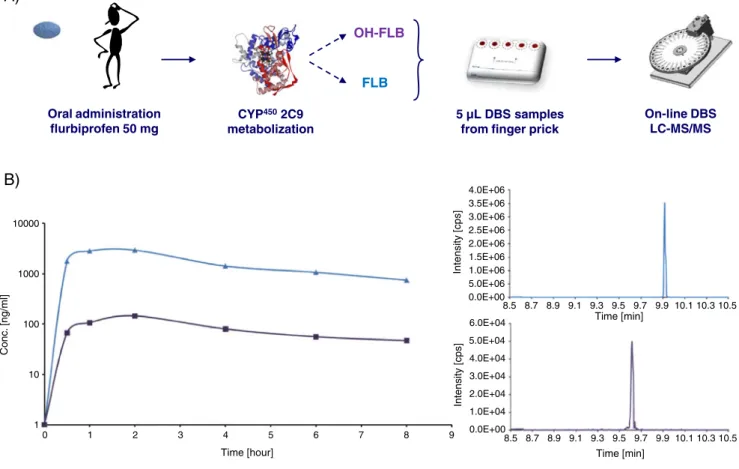
Oral administration flurbiprofen 50 mg
5 µL DBS samples from finger prick CYP4502C9 metabolization FLB OH-FLB On-line DBS LC-MS/MS
A)
B)
10000 4.0E+06 Intensity [cps] 3.5E+06 3.0E+06 2.5E+06 2.0E+06 1.5E+06 1.0E+06 5.0E+06 0.0E+00 6.0E+04 5.0E+04 4.0E+04 3.0E+04 2.0E+04 1.0E+04 0.0E+00 8.5 8.7 8.9 9.1 9.3 9.5 9.7 9.9 10.1 10.3 10.5 Time [min] 8.5 8.7 8.9 9.1 9.3 9.5 9.7 9.9 10.1 10.3 10.5 Time [min] Intensity [cps] Conc. [ng/ml] 1000 100 10 0 1 2 3 4 Time [hour] 5 6 7 8 9 1Fig. 5 Typical workflow of a clinical study performed with the DBS sampling process followed by on-line LC–MS–MS analysis (A). For this trial, 50 mg flurbiprofen was orally administered to human volunteers and DBS samples were collected over eight hours. Representative log
concentration–time profiles for flurbiprofen (triangles) and the OH-flurbiprofen metabolite (squares), and the associated MRM chromato-grams at two hours are presented (B)
animal must be sacrificed for each experiment or time-point in a kinetic study. With DBS sampling, multiple experiments or time-points can be performed on the same animal, leading to significant benefits in the 3Rs (reduction, refinement, and replacement) in animal use [67]. Moreover, direct DBS techniques now enable increased throughput of DBS analysis; this is particularly appropriate in the pharmaceutical industry, in which large numbers of drug candidates are tested. For example, Roche laboratories have successfully applied on-line DBS using SCAP technology to a study of the pharmacokinetic of oseltamivir on rats [43].
Even though very few papers have been published focusing on drug metabolism studies based on DBS [68], Thomas et al. demonstrated the possibility of highlighting phase I and II metabolites of buprenorphine in rats after intraperitoneal injection. In these experiments, buprenorphine, norbuprenor-phine, and their respective glucuronides were simultaneously monitored from 5-μL DBS samples [15].
Clinical study and therapeutic drug monitoring
If the ethical benefit of using DBS is clearly established for animal use in preclinical studies, this less invasive sampling mode can be easily applied to human clinical studies or
TDM investigations. As reviewed by Li and Tse, DBS–LC– MS–MS has been increasingly used in this area for analysis of a wide range of drug molecules, including antiretroviral, immunosuppressant, antiepileptic, or antimalarial drugs [19]. Moreover, Glaxo Smith Kline regards DBS sampling as the preferred sampling method for orally dosed compounds in Phase I clinical trials [69]. Although all the DBS methods discussed in this section are based on off-line extraction with subsequent LC–MS–MS analysis, direct strategies, discussed in this review, will certainly promote DBS analysis in clinical laboratories. For example, Roche has successfully applied the Camag TLC–MS interface to phase I determination of drug candidates in human DBS samples [44].
Furthermore, this kind of strategy may be of important benefit to clinical pharmacology in terms of ease of use for medical staff and patient comfort. On the basis of these considerations, an automated on-line DBS method for pharmacokinetic study of flurbiprofen and its main metabolite 4-hydroxyflurbiprofen in human volunteers was developed at the University Hospitals of Geneva to assess the activity of cytochrome P450 2C9 (Fig.5). The system was successfully tested on over 500 real samples, demonstrating the good competitiveness of the process compared with conventional plasma LC–MS–MS analysis [39].
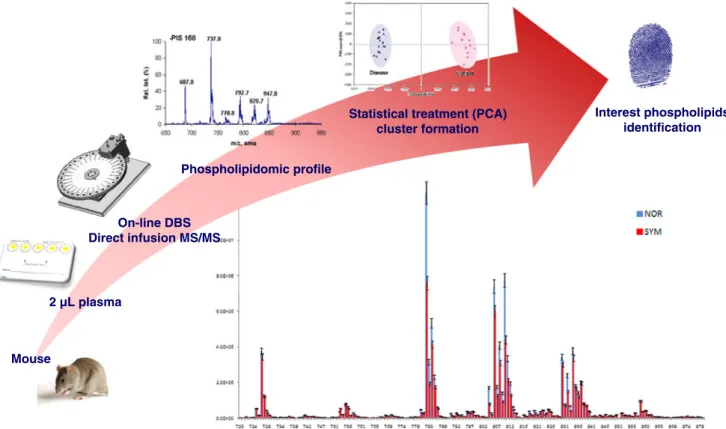
On-line DBS Direct infusion MS/MS
2 µL plasma
Statistical treatment (PCA) cluster formation
Interest phospholipids identification
Mouse
Phospholipidomic profile
Fig. 6 High-throughput phospholipidomic fingerprinting for evalua-tion of disease biomarkers. For this purpose, 2 μL mouse plasma previously spotted on filter paper was analyzed by MS–MS after direct infusion using an on-line DBS process. Multiple MS–MS
experiments (neutral loss and precursor ion scans) were acquired for simultaneous measurement of phospholipidic classes. Complex data mining was performed by use of statistical tools to ensure sample classification and to highlight the discriminated species
Identification of biomarkers
The discovery of novel biomarkers is of major importance for diagnosis of disease states, determination of prognosis, and therapeutic response monitoring [70]. Over the past decade, LC–MS–MS has become the key analytical technique in the investigation of biomarkers by proteomic and metabolomic approaches [71]. Regarding implementa-tion of DBS in LC–MS–MS workflow (as discussed previously), direct DBS analysis may be a novel means of supporting the different stages in the biomarker pipeline from discovery to the validation steps [72]. Preliminary tests have demonstrated the feasibility of the analyses of the enzymes and peptides spotted on filter paper using the paper spray process [58]. Furthermore, Thomas et al. developed an on-line DBS MS–MS strategy for high-throughput fingerprinting of phospholipidome in athero-sclerotic mice from 2 μL dried plasma that was desorbed directly into the MS instrument without pre-treatment or LC separation (Fig. 6) [40]. Based on multiple MS–MS experiments and data mining, this study has enabled sample classification between atherosclerotic and control mice and highlighted several species that were significantly up and down-regulated as a consequence of that pathology.
Conclusion
Over the past decade, DBS sampling has emerged as a powerful alternative approach for clinical and pharmaceutical analysis compared with the conventional venipuncture proce-dure. The filter paper affords numerous advantages that range from better shipment/storage logistics to a less invasive and more ethical procedure. However, the lack of automation, necessitating manual off-line extraction, could make this procedure unsuitable for routine laboratories. The recent developments highlighted in this review enable direct MS– MS analysis of DBS samples (with or without previous LC separation) and offer competitive solutions in terms of throughput and sensitivity compared with the plasma proce-dure. Furthermore, the marketing of automatic methods indicates that some direct DBS methods are now mature and can be easily implemented in analytical laboratories.
Conflict of interest/disclosure The authors declare no conflicts of interest regarding this manuscript.
References
1. McDade TW, Williams S, Snodgrass JJ (2007) What a drop can do: dried blood spots as a minimally invasive method for integrating biomarkers into population-based research. Demography 44:899–925
2. Mei JV, Alexander JR, Adam BW, Hannon WH (2001) Use of filter paper for the collection and analysis of human whole blood specimens. J Nutr 131:1631S–1636S
3. Lilian RR, Bhowan K, Sherman GG (2010) Early diagnosis of human immunodeficiency virus-1 infection in infants with the NucliSens EasyQ assay on dried blood spots. J Clin Virol 48:40–43 4. Leichtle AB, Ceglarek U, Witzigmann H, Gäbel G, Thiery J, Fiedler GM (2010) Potential of dried blood self-sampling for cyclosporine C2monitoring in transplant outpatients. J Transplant
2010:201918
5. Edelbroek PM, van der Heijden J, Stlok LML (2009) Dried blood spot methods in therapeutic drug monitoring: methods, assays, and pitfalls. Ther Drug Monit 31:327–336
6. Cheung CY, van der Heijden J, Hoogtanders K, Christiaans M, Liu YL, Chan YH, Choi KS, van de Plas A, Shek CC, Chau KF, Li CS, van Hooff J, Stolk L (2008) Dried blood spot measurement: application in tacrolimus monitoring using limited sampling strategy and abbreviated AUC estimation. Transpl Int 21:140–145 7. Déglon J, Lauer E, Thomas A, Mangin P, Staub C (2010) Use of the dried blood spot sampling process coupled with fast gas chromatography and negative-ion chemical ionization tandem mass spectrometry: application to fluoxetine, norfluoxetine, reboxetine, and paroxetine analysis. Anal Bioanal Chem 396:2523–2532
8. Bowen CL, Hemberger MD, Kehler JR, Evans CA (2010) Utility of dried blood spot sampling and storage for increased stability of photosensitive compounds. Bioanalysis 2:1823–1828
9. van der Heijden J, de Beer Y, Hoogtanders K, Christiaans M, de Jong GJ, Neef C, Stolk L (2009) Therapeutic drug monitoring of everolimus using the dried blood spot method in combination with liquid chromatography–mass spectrometry. J Pharm Biomed Anal 50:664–670
10. Guidelines for the shipment of dried blood spot specimens (1995) Center for Diseases Control and Prevention, Atlanta, GA. 11. Parker SP, Cubitt WD (1999) The use of the dried blood spot
sample in epidemiological studies. J Clin Pathol 55:633–639 12. Patel P, Mulla H, Tanna S, Pandya H (2010) Facilitating
pharmacokinetic studies in children: a new use of dried blood spots. Arch Dis Child 95:484–487
13. Suyagh MF, Iheagwaram G, Kole PL, Millership J, Collier P, Halliday H, McElnay JC (2010) Development and validation of a dried blood spot-HPLC assay for the determination of metronidazole in neonatal whole blood samples. Anal Bioanal Chem 397:687–693 14. Boy RG, Henseler J, Mattern R, Skopp G (2008) Determination of morphine and 6-acetylmorphine in blood with use of dried blood spots. Ther Drug Monit 30:733–739
15. Thomas A, Déglon J, Steimer T, Mangin P, Daali Y, Staub C (2010) On-line desorption of dried blood spots coupled to hydrophilic interaction/reversed-phase LC/MS–MS system for the simultaneous analysis of drugs and their polar metabolites. J Sep Sci 33:873–879
16. Beaudette P, Bateman KP (2004) Discovery stage pharmacokinetics using dried blood spots. J Chromatogr B 809:153–158
17. Damen CWN, Rosing H, Schellens JHM, Beijnen JH (2009) Application of dried blood spots combined with high-performance liquid chromatography coupled with electrospray ionisation tandem mass spectrometry for simultaneous quantification of vincristine and actinomycin-D. Anal Bioanal Chem 394:1171–1182
18. van Amsterdam P, Waldrop C (2010) The application of dried blood spot sampling in global clinical trials. Bioanalysis 2:1783–1786 19. Li W, Tse FLS (2010) Dried blood spot sampling in combination
with LC–MS–MS for quantitative analysis of small molecules. Biomed Chromatogr 24:49–65
20. Keevil BG (2011) The analysis of dried blood spot samples using liquid chromatography tandem mass spectrometry. J Clin Biochem 44:110–118
21. Guthrie R, Suzi A (1963) A simple phenylalanine method for detecting phenylketonuria in large populations of newborn infants. Pediatrics 32:338–343
22. Tran TN, de Vries PJ, Hoang LP, Phan GT, Le HQ, Tran BQ, Vo CM, Nguyen NV, Kager PA, Nagelkerke N, Groen J (2006) Enzyme-linked immunoassay for dengue virus IgM and IgG antibodies in serum and filter paper blood. Biomed Central Infect Dis 6:13–20
23. Hofmana L, Foleya TP, Henrya JJ, Naylora EW (2004) The use of filter paper-dried blood spots for thyroid-antibody screening in adults. J Lab Clin Med 144:307–312
24. Lewensohn-Fuchs I, Osterwall P, Forsgren M, Malm G (2003) Detection of herpes simplex virus DNA in dried blood spots making a retrospective diagnosis possible. J Clin Virol 26:39–48 25. Stevens W, Erasmus L, Moloi M, Taleng T, Sarang S (2008)
Performance of a novel human immunodeficiency virus (HIV) type 1 total nucleic acid-based real-time PCR Assay using whole blood and dried blood spots for diagnosis of HIV in infants. J Clin Micr 46:3941–3945
26. Langkamp M, Weber K, Ranke MB (2008) Human growth hormone measurement by means of a sensitive ELISA of whole blood spots on filter paper. Growth Horm IGF Res 18:526–532 27. McDade TW, Burhop J, Dohnal J (2004) High-sensitivity enzyme
immunoassay for C-reactive protein in dried blood spots. Clin Chem 50:652–654
28. Mwaba P, Cassol S, Pilon R, Chintu C, Janes M, Nunn A, Zumla (2003) A Use of dried whole blood spots to measure CD4+ lymphocyte counts in HIV-1-infected patients. Lancet 362:1459– 1460
29. Oliveira EJ, Watson DG, Morton NS (2002) A simple microanalyt-ical technique for the determination of paracetamol and its main metabolites in blood spots. J Pharm Biomed Anal 29:803–809 30. Al A, Cotton MM, Tettey JNA, Boyter AC (2007) Determination
of rifampicin in human plasma and blood spots by high performance liquid chromatography with UV detection: a potential method for therapeutic drug monitoring. J Pharm Biomed Anal 44:963–969
31. Ntale M, Mahindi M, Ogwal-Okeng JW, Gustafsson LL, Beck O (2007) A field-adapted HPLC method for determination of amodiaquine and its metabolite in whole blood dried on filter paper. J Chromatogr B 859:137–140
32. Thomas A, Lenglet S, Chaurand P. Déglon J, Mangin P, Mach F, Steffens S, Wolfender J-L, Staub C (2011) Thromb Haemost (in press).
33. Koal T, Burhenne H, Römling R, Svoboda M, Resch K, Kaever V (2005) Quantification of antiretroviral drugs in dried blood spot samples by means of liquid chromatography/tandem mass spectrometry. Rapid Commun Mass Spectrom 19:2995–3001 34. Zytkovicz TH, Fitzgerlad EF, Marsden D, Larson CA, Shih VE,
Johnson DM, Strauss AW, Comeau AM, Eaton RB, Grady GF (2001) Tandem mass spectrometric analysis for amino, organic, and fatty acid disorders in newborn dried blood spots: a two-year summary from the New England Newborn Screening Program. Clin Chem 47:1945–1955
35. la Marca G, Malvagia S, Filippi L, Fiorini P, Innocenti M, Luceri F, Pieraccini G, Moneti G, Francese S, Dani FR, Guerrini R (2008) Rapid assay of topiramate in dried blood spots by a new liquid chromatography–tandem mass spectrometric method. J Pharm Biomed Anal 48:1392–1396
36. Barfield M, Spooner N, Lad R, Parry S, Fowles S (2008) Application of dried blood spots combined with HPLC–MS–MS for the quantification of acetaminophen in toxicokinetic studies. J Chromatogr B 870:32–37
37. Kato K, Wanigatunga AA, Needham LL, Calafat AM (2009) Analysis of blood spots for polyfluoroalkyl chemicals. Anal Chim Acta 656:51–55
38. Déglon J, Thomas A, Cataldo A, Mangin P, Staub C (2009) On-line desorption of dried blood spot: a novel approach for the direct LC–MS analysis of micro-whole blood samples. J Pharm Biomed Anal 49:1034–1039
39. Déglon J, Thomas A, Daali Y, Lauer E, Samer C, Desmeules J, Dayer P, Mangin P, Staub C (2011) Automated system for on-line desorption of dried blood spots applied to LC/MS–MS pharma-cokinetic study of flurbiprofen and its metabolite. J Pharm Biomed Anal 54:359–367
40. Thomas A, Déglon J, Lenglet S, Mach F, Mangin P, Wolfender J-L, Steffens S, Staub C (2010) High-throughput phospholipidic finger-printing by online desorption of dried spots and quadrupole–linear ion trap mass spectrometry: evaluation of atherosclerosis biomarkers in mouse plasma. Anal Chem 82:6687–6694
41. Ooms B (2010) On-line DBS–SPE–MS–MS: Feasibility of a concept for rapid DBS analysis without punching. Oral presentation. Presented at EBF workshop connecting strategies on Dried Blood Spots, Brussels, Belgium.
42. Miller JH IV, Poston PA, Karnes HT (2011) Direct analysis of dried blood spots by in-line desorption combined with high-resolution chromatography and mass spectrometry for quantification of maple syrup urine disease biomarkers leucine and isoleucine. Anal Bioanal Chem 400:237–244
43. Heinig K, Wirz T, Bucheli F, Gajate-Perez A (2011) Determination of oseltamivir (Tamiflu®) and oseltamivir carboxylate in dried blood spots using offline or online extraction. Bioanalysis 3:421– 437
44. Heinig K, Wirz T, Gajate-Perez A (2010) Sensitive determination of a drug candidate in dried blood spots using a TLC–MS interface integrated into column-switching LC–MS–MS system. Bioanalysis 2:1873–1882
45. Van Berkel GJ, Kertesz V (2009) Application of a liquid extraction based sealing surface sampling probe for mass spectrometric analysis of dried blood spots and mouse whole-body thin tissue sections. Anal Chem 21:9146–9152
46. Luftmann H (2004) A simple device for the extraction of TLC spots: direct coupling with an electrospray mass spectrometer. Anal Bioanal Chem 378:964–968
47. Morlock G, Schwack W (2010) Coupling of planar chroma-tography to mass spectrometry. Trends Anal Chem 29:1157– 1171
48. Luftmann H, Aranda M, Morlock GE (2007) Automated interface for hyphenation of planar chromatography with mass spectrometry. Rapid Commun Mass Spectrom 21:3772–3776
49. Abu-Rabie P, Spooner N (2009) Direct quantitative bioanalysis of drugs in dried blood spot samples using thin-layer chromatography mass spectrometer interface. Anal Chem 24:10275–10284 50. Zimmer D, Sack S, Betschart B, Fankhauser C, Loppacher M
(2011) 59th ASMS conference on mass spectrometry and allied topics. J Am Soc Mass Spectrom 22(S1):162
51. Van Berkel GJ, Kertesz V, King RC (2009) High-throughput mode liquid microjunction surface sampling probe. Anal Chem 81:7096–7101
52. Kertesz V, Van Berkel GJ (2010) Fully automated liquid extraction-based surface sampling and ionization using a chip-based robotic nanoelectrospray platform. J Mass Spectrom 45:252–260
53. Harris GA, Nyadong L, Fernandez FM (2008) Recent develop-ments in ambient ionization techniques for analytical mass spectrometry. Analyst 133:1297–1301
54. Ifa DR, Wu C, Ouyang Z, Cooks RG (2010) Desorption electrospray ionization and other ambient ionization methods: current progress and preview. Analyst 135:669–681
55. Cooks RG, Ouyang Z, Takats Z, Wiseman JM (2006) Detection technologies. Ambient mass spectrometry. Science 311:1566– 1570
56. Costa AB, Cooks RG (2007) Simulation of atmospheric transport and droplet–thin film collisions in desorption electrospray ionization. Chem Commun 14:3915–3917
57. Wiseman JM, Evans CA, Bowen CL, Kennedy JH (2010) Direct analysis of dried blood spots utilizing desorption electrospray ionization (DESI) mass spectrometry. Analyst 135:720–725 58. Liu J, Wang H, Manicke NE, Lin J-M, Cooks RG, Ouyang Z
(2010) Development, characterization, and application of paper spray ionization. Anal Chem 82:2463–2471
59. Wang H, Liu J, Cooks RG, Ouyang Z (2010) Paper spray for direct analysis of complex mixtures using mass spectrometry. Angew Chem 49:877–880
60. Chace DH, Kalas TA, Naylor EW (2002) The application of tandem mass spectrometry to neonatal screening for inherited disorders of intermediary metabolism. Annu Rev Genomics Hum Genet 3:17–45
61. Wilcken B, Wiley V (2008) Newborn screening. Pathology 40:104–105 62. Corso G, D’Apolito O, Gelzo M, Paglia G, Dello Russo A (2010) A powerful couple in the future of clinical biochemistry: in situ analysis of dried blood spots by ambient mass spectrometry. Bioanalysis 2:1883–1891
63. Sturm S, Hammann F, Drewe J, Maurer HH, Scholer A (2010) An automated screening method for drugs and toxic compounds in human serum and urine using liquid chromatography–tandem mass spectrometry. J Chromatogr B 878:2726–2732
64. Decaestecker TN, Vande Casteele SR, Wallemacq PE, Van Peteghem CH, Defore DL, Van Bocxlaer JF (2004)
Information-dependent acquisition-mediated LC–MS–MS screening procedure with semiquantitative potential. Anal Chem 76:6365–6373 65. Mylonas R, Mauron Y, Masselot A, Binz P-A, Budin N, Fathi M,
Viette V, Hochstrasser DF, Lisacek F (2009) X-rank: a robust algorithm for small molecule identification using tandem mass spectrometry. Anal Chem 81:7604–7610
66. Wong P, Pham R, Bruenner BA, James CA (2010) Increasing efficiency for dried blood spot analysis: prospects for automation and simplified sample analysis. Bioanalysis 2:1787–1789 67. Spooner N, Lad R, Barfield M (2009) Dried blood spots as a
sample collection technique for the determination of pharmacoki-netics in clinical studies: considerations for the validation of a quantitative bioanalytical method. Anal Chem 81:1557–1563 68. Mauriala T, Chauret N, Oballa R, Nicoll-Griffith DA, Bateman KP
(2005) A strategy for identification of drug metabolites from dried blood spots using triple-quadrupole/linear ion trap hybrid mass spectrometry. Rapid Commun Mass Spectrom 19:1984–1992 69. Hill H (2009) Developing trends in bioanalysis. Bioanalysis
1:1359–1364
70. Anderson NL, Anderson NG (2002) The human plasma proteome: history, character, and diagnostic prospects. Mol Cell Proteomics 1:845–867
71. Anderson L (2005) Candidate-based proteomics in the search for biomarkers of cardiovascular disease. J Physiol 563:23–60 72. Surinova S, Schiess R, Hüttenhain R, Cerciello F, Wollscheid B,
Aebersold R (2011) On the development of plasma protein biomarkers. J Proteom Res 10:5–16