SCIENTIFIC ARTICLE
Chiasma crurale: intersection of the tibialis posterior
and flexor digitorum longus tendons above the ankle.
Magnetic resonance imaging
–anatomic correlation
in cadavers
Florian M. Buck&Ramon Gheno&Marcelo A. C. Nico& Parviz Haghighi&Debra J. Trudell&Donald Resnick
Received: 30 July 2009 / Revised: 2 October 2009 / Accepted: 5 October 2009 / Published online: 30 October 2009
# The Author(s) 2009. This article is published with open access at Springerlink.com
Abstract
Purpose To determine the precise anatomy and magnetic resonance (MR) imaging appearance of the chiasma crurale in cadavers, paying special attention to degenerative changes
Material and methods Twelve fresh human ankles were harvested from 11 nonembalmed cadavers (mean age at death 77 years) and used according to institutional guide-lines. MR imaging and MR tenography were used to investigate the anatomy of the chiasma crurale using proton density-weighted sequences. The gross anatomy of the chiasma crurale was evaluated and compared to the MR imaging findings. Histology was used to elucidate further the structure of the chiasma crurale.
Results Above the chiasma, five specimens had a small amount of fat tissue between the tibialis posterior and flexor digitorum longus tendon. In all specimens both tendons had a sheath below the chiasma but not above it. At the central
portion of the chiasma there was no soft tissue between the tendons, except in two specimens that showed an anatomic variant consisting of a thick septum connecting the tibial periosteum and the deep transverse fascia of the leg. In MR images, eight specimens showed what were believed to be degenerative changes in the tendons at the level of the chiasma. However, during gross inspection and histologic analysis of the specimens, there was no tendon degeneration visible.
Conclusion At the central portion of the chiasma, there is no tissue between the tibialis posterior and flexor digitorum longus tendons unless there is an anatomic variant. At the chiasma crurale, areas with irregular tendon surfaces are normal findings and are not associated with tendon degeneration (fraying).
Keywords Chiasma crurale .
Flexor digitorum longus tendon . Tibialis posterior tendon . Degeneration . Magnetic resonance imaging
Introduction
The term chiasma crurale designates the crossing of the posterior tibialis tendon (PTT) and flexor digitorum longus tendon (FDLT) at the posteromedial aspect of the lower leg. The tibialis posterior muscle originates lateral to the flexor digitorum longus muscle on the inner posterior borders of the tibia and fibula and in the interosseous membrane. The flexor digitorum longus muscle arises from the posterior surface of the tibia, immediately below the popliteal line and medial to the origin of the tibialis posterior muscle. Hence, above the chiasma crurale, the PTT is located lateral to the FDLT. At the level of the ankle joint, the FDLT is This investigation was supported by the Swiss National Science
Foundation and the Swiss Radiological Society.
F. M. Buck
:
R. Gheno:
M. A. C. Nico:
D. J. Trudell:
D. ResnickDepartment of Radiology, VA San Diego Medical Center, San Diego, CA, USA
P. Haghighi
Department of Pathology, VA San Diego Medical Center, San Diego, CA, USA
Present Address:
F. M. Buck (*)
Institut für Diagnostische Radiologie, Uniklinik Balgrist, Forchstrasse 340, 8008 Zurich, Switzerland
located lateral to the PTT. Both the PTT and FDLT migrate toward their respective distal locations: the PTT moves medially, while the FDLT moves laterally and posteriorly to assume a position lateral to the PTT [1,2].
Based on the documentation of clinical syndromes that arise at points of tendon intersection, such as the intersection of the tendons of the first and second dorsal extensor tendon compartments of the wrist (intersection syndrome of the forearm), tendons appear to be resistant to tensile forces and compression but are sensitive to friction [3–9]. Therefore, tendons are often protected by a tendon sheath or paratenon wherever increased friction might occur [10]. Without these protective tissues, or in diseases affecting these tissues, such as tenosynovitis, crossing tendons are prone to degeneration and tears [11].
Owing to the crossing of the PTT and FDLT, one would expect that the chiasma crurale might be a site of friction that potentially could lead to degenerative changes. Furthermore, at this location, these tendons often appear flattened in magnetic resonance (MR) images, with an irregular tendon surface that suggests degenerative fraying. To our knowl-edge, there have been only two previous investigations that have dealt with the chiasma crurale, neither of which provides a detailed description of its anatomy or degenera-tive changes [12,13]. Furthermore, in MR images, tissue is often visible between the two tendons, raising the possibility of a tendon sheath that, if present, might promote gliding movements of the two tendons and decrease the likelihood of tendon degeneration.
The aim of our study was to determine the precise anatomy and MR imaging appearance of the chiasma crurale in cadavers, paying special attention to the occurrence of degenerative changes.
Materials and methods
Cadaver and specimen preparation
Twelve fresh human ankles were harvested from 11 non-embalmed cadavers (four women, seven men; age range at death 47–90 years; mean age at death 77 years). The specimens were derived from lower legs cut through the middle of the calf and included the ankle joint and the entire foot. All specimens were immediately deep-frozen at−40°C (Forma Bio-Freezer; Forma Scientific, Marietta, OH, USA). Before undergoing MR imaging, the specimens were allowed to thaw for 24 h at room temperature.
MR imaging
MR Imaging was performed with a 1.5 T MR system (Signa; GE Healthcare Technologies, Milwaukee, WI,
USA). An eight-channel receive-only general-purpose flex coil (Flex coil small; Medical Advances, Milwaukee, WI, USA) was employed. The coil was wrapped around the distal lower leg, and the specimens were placed in a gantry in a position that was analogous to that of a supine patient whose foot was in a neutral position without plantar flexion or dorsiflexion.
Proton density-weighted (PDw) spin-echo sequences [repetition time (TR) 3,000 ms; echo time (TE) 30 ms; field of view (FOV) 10 cm×10 cm; matrix 512 pixels× 512 pixels; number of excitations (NEX) 4; slice thickness (th) 2 mm; interslice spacing (d) 0 mm; echo train length (ETL) 6; bandwidth (BW) ±25 kHz] were acquired without fat saturation in the transverse, sagittal, and coronal planes. Additionally, a T1-weighted (T1w) spin-echo sequence (TR 500 ms; TE 13 ms; FOV 10 cm × 10 cm; matrix 512 pixels×512 pixels; NEX 4; th 2 mm; d 0 mm; ETL 2; BW ±25 kHz) without fat suppression was acquired in the transverse plane.
MR tenography
With sonographic guidance, a fellowship-trained musculo-skeletal radiologist placed a 22-gauge (0.7 mm ×40.0 mm) needle directly through the skin from a postero-inferomedial approach between the PTT and FDLT, slightly distal to their crossing, with the needle advanced until it was located adjacent and parallel to the PTT. The position of the tip of the needle was verified by the linear dispersion of an initially injected small amount of contrast medium within the tendon sheath of the PTT. Subsequently, 6 ml of a solution of 1 mol/l gadopentetate dimeglumine (Magnevist; Bayer-Schering, Berlin, Germany) diluted in 250 ml of saline solution was injected.
MR imaging was then performed immediately, with the specimen positioned in exactly the same way as before tenography, and identical non-fat-suppressed PDw sequences were acquired as before tenography. Additionally, PDw fat-saturated spin-echo sequences (TR 3,000 ms; TE 30 ms; FOV 10 cm×10 cm; matrix 512 pixels×512 pixels; NEX 4; th 2 mm; d 0 mm; ETL 6; BW ±25 kHz) were acquired in the same transverse, sagittal, and coronal planes as before tenography.
Radiologic–anatomic correlation
Immediately after imaging, the specimens were frozen at −40°C for at least 2 days. All specimens were sliced with a band saw into 4 mm-thick pieces. One specimen was cut in the coronal plane, two specimens in the sagittal plane, and seven specimens in the transverse plane. Photographs and conventional radiographs of each slice were obtained. The anatomic slices and MR images were simultaneously
inter-preted in consensus by two fellowship-trained musculoskeletal radiologists.
The proximal limit of the chiasma crurale was defined from the proximal axial images as the most proximal level at which the distance between the two tendons was less than 1 mm. The center of the chiasma crurale was defined from the axial images as the level at which the FDLT was located directly posterior (in the same sagittal plane) to the PTT. The distal limit of the chiasma crurale was defined as the level of the ankle joint. The positions of the proximal limit and center of the chiasma crurale were measured with reference to the level of the ankle joint using a DICOM viewer (OsiriX, version 3.2.1, The OsiriX Foundation, Geneva, Switzerland). Further-more, the level at which the last muscle fibers were seen and
the most proximal level at which there was a tendon sheath around the tendons were determined and the distance between each of the levels and the ankle joint was measured.
In all specimens the anatomy was evaluated at the proximal limit, the center, and the distal limit of the chiasma. The cross-sectional areas of the PTT and FDLT were measured (OsiriX, version 3.2.1) and compared to each other. Both tendons of the chiasma were carefully inspected for degenerative changes. Superficial tendon irregularity was evaluated at the proximal limit and center of the chiasma crurale, and at the level of the ankle joint. Irregularity was rated from 1 to 3 on a continuous scale: 1, mild irregularity; 2, moderate irregularity; 3, severe irregularity. Partial or complete tendon tears were noted.
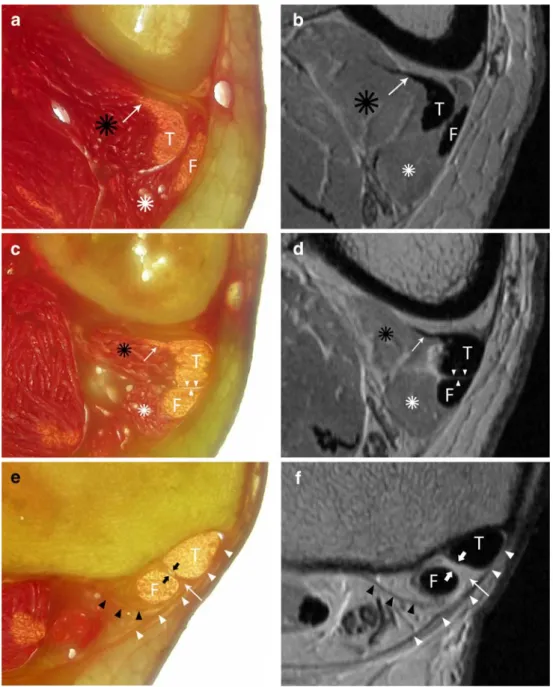
Fig. 1 Anatomy of the chiasma crurale on gross anatomy slices (a, c, e) and proton density-weighted MR images (b, d, f) at the proximal limit (a, b), center (c, d), and distal limit (e, f) of the chiasma crurale. At the proximal limit of the chiasma (a, b), the PTT (T) and FDLT (F) are accompanied by their very distal muscle fibers (black and white asterisks). The tail of the PTT (arrow) is related to the very distal musculotendinous junction. At the level of the center of the chiasma crurale (c,
d), the PTT (T) and FDLT (F)
are intimate and there is no tissue between them (arrowheads). The very distal muscle fibers (black and white asterisks) and the tail of the PTT (arrow) are also visible. At the distal limit of the chiasma cruris (e, f), the PTT (T) and FDLT (F) are spanned by the most distal part of the deep transverse fascia of the leg (white arrowheads) and surrounded by their tendon sheaths. Additionally, there are fine septa limiting the compart-ment of the FDLT posteriorly (black arrowheads) and separat-ing the two tendon compart-ments (thick arrows). The very distal part of the deep transverse fascia shows a triangular thick-ening between the PTT (T) and FDLT (F)
Changes in signal intensity in the substance of the tendon were noted as present or absent. The maximum width of fluid around the tendons was measured in the images that were acquired before tenography. Additionally, the soft tissues and muscle tissue about the chiasma crurale were investigated. All MR imaging findings were correlated with anatomic observations.
Histology
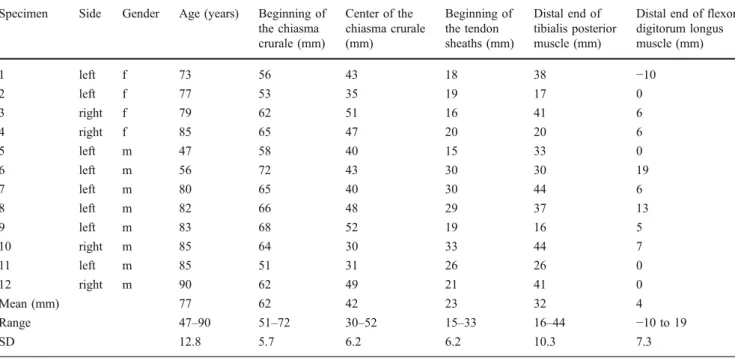
Five histological samples were obtained from the proximal limit, the center, and the distal limit of the chiasma. Additional samples were harvested whenever tissue was found between the two tendons. Immediately after removal, all samples were Table 1 Locations of the chiasma crurale, tendon sheaths, and most distal muscle fibers. Measurements are in millimeters above the level of the ankle joint. f female, m male, SD standard deviation
Specimen Side Gender Age (years) Beginning of
the chiasma crurale (mm) Center of the chiasma crurale (mm) Beginning of the tendon sheaths (mm) Distal end of tibialis posterior muscle (mm)
Distal end of flexor digitorum longus muscle (mm) 1 left f 73 56 43 18 38 −10 2 left f 77 53 35 19 17 0 3 right f 79 62 51 16 41 6 4 right f 85 65 47 20 20 6 5 left m 47 58 40 15 33 0 6 left m 56 72 43 30 30 19 7 left m 80 65 40 30 44 6 8 left m 82 66 48 29 37 13 9 left m 83 68 52 19 16 5 10 right m 85 64 30 33 44 7 11 left m 85 51 31 26 26 0 12 right m 90 62 49 21 41 0 Mean (mm) 77 62 42 23 32 4 Range 47–90 51–72 30–52 15–33 16–44 −10 to 19 SD 12.8 5.7 6.2 6.2 10.3 7.3
Table 2 Cross-sectional area of the tendons at different locations around the chiasma crurale. The proximal limit of the chiasma was defined as the most proximal level at which the distance between the two tendons was <1 mm. The center of the chiasma was defined as the level at which the flexor digitorum longus tendon (FDLT) was exactly posterior (in the same sagittal plane) to the tibialis posterior tendon (PTT). SD standard deviation
Specimen Proximal limit of the chiasma Center of the chiasma At ankle joint level
PTT (mm2) FDLT (mm2) PTT (mm2) FDLT (mm2) PTT (mm2) FDLT (mm2) 1 33.3 9.0 38.5 11.3 28.7 15.2 2 23.9 6.5 26.4 7.3 28.8 10.7 3 30.7 11.0 30.1 10.2 34.5 13.1 4 27.5 7.6 21.8 8.4 20.0 7.2 5 17.8 6.6 19.0 6.7 19.9 7.1 6 19.7 10.2 25.8 10.2 19.3 11.8 7 20.4 7.5 20.2 7.1 29.7 9.0 8 22.3 5.9 24.1 6.4 28.5 9.2 9 22.9 13.0 28.7 12.3 34.5 15.1 10 14.0 5.7 15.7 6.0 19.7 8.4 11 19.8 8.5 22.3 9.1 28.3 10.6 12 27.9 10.2 25.9 10.5 26.0 14.8 Mean (mm2) 23.4 8.5 24.9 8.8 26.5 11.0 Range (mm2) 14.0–33.3 5.7–13.0 15.7–38.5 6.0–12.3 19.3–34.5 7.1–15.2 SD (mm2) 5.6 2.3 5.9 2.1 5.6 3.0
Table 2 Cross-sectional area of the tendons at different locations around the chiasma crurale. The proximal limit of the chiasma was defined as the most proximal level at which the distance between the two tendons was <1 mm. The center of the chiasma was defined as the
level at which the flexor digitorum longus tendon (FDLT) was exactly posterior (in the same sagittal plane) to the tibialis posterior tendon (PTT). SD standard deviation
placed in buffered 10% formalin and stored in a refrigerator at 5°C. For histologic preparation, the samples were removed from the refrigerator and thoroughly washed in tap water. Then, they were embedded in paraffin, cut into 2–4 μm
sections in a transverse plane, and stained with hematoxylin and eosin (HE).
A senior pathologist performed all histologic examinations using a high-quality light microscope (Olympus BX41, Olympus Inc., Center Valley, PA, USA). On all slides, the tendon structure was assessed and degenerative changes in and around the tendons were sought. Special attention was paid to the presence of tissue located between the tendons and to the presence of a tendon sheath.
Results
At the chiasma crurale the FDLT crossed the PTT from the medial side proximally to the posterior aspect of the PTT, and to its lateral side distally (Fig.1). In axial images, with reference to 12 o’clock anteriorly and 3 o’clock medially, the FDLT was at the 4 o’clock position at the proximal limit of the chiasma, crossed the posterior aspect of PTT, and assumed a final distal position of 8 o’clock at the level of the ankle joint. These findings were identical in all specimens.
The proximal limit of the chiasma crurale was 62 mm (range 51–72 mm; standard deviation 6.2 mm) above the joint line of the ankle. The center of the chiasma crurale was 42 mm (range 30–52 mm; standard deviation 7.5 mm) above the ankle joint (Table 1). Given the intimate course of the PTT and FDLT over a relatively long distance of approximately 60 mm on average, the sagittal and coronal MR images were of limited use for the evaluation of the chiasma crurale. However, in the axial images, the anatomy was well visualized.
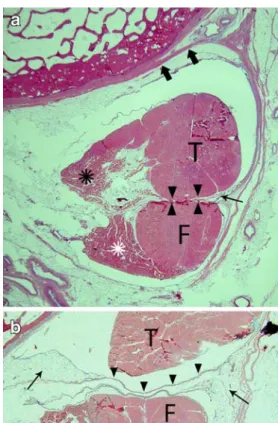
Both tendons showed a long myotendinous junction, with the tendons forming at the medial aspect of both muscle bellies. The most distal fibers of the tibialis Fig. 2 Histologic findings at the chiasma crurale on HE-stained
slices. a Axial slice at the level of the center of the chiasma crurale. Between the PTT (T) and FDLT (F), there is no tissue (arrowheads). The linear structures next to the tendons (arrow) are the artificially partly detached peritenon. The tendons are held in place by fine septa (thick arrows) that join the adjacent periosteum. b In another specimen slightly below the center of the chiasma crurale, the tendon sheaths are evident as fine linear structures (arrowheads) between the tendons with adjacent fat tissue (arrows). T PTT, F FDLT
Fig. 3 Irregular tendon surface in proton density-weighted MR images at the chiasma cruris. a Slightly above the center of the chiasma, the surfaces of the PTT (T) and FDLT (asterisk) are smooth (arrowheads). A tail of the PTT is evident (black arrow). b At the level of the center of the chiasma, there is slight irregularity of the tendons surface (arrowheads). Both tendons have tails (white and
black arrows), whereas the FDLT (asterisk) has the shape of a hood (white arrow). T, PTT. c In another specimen at the level of the center of the chiasma cruris, there is severe irregularity of the tendon surfaces (arrowheads) of the PTT (T) and FDLT (asterisk). Histology did not show tendon fraying in any of these specimens
posterior muscle were seen 32 mm (range 16–44 mm; standard deviation 10.3 mm) above the ankle joint, clearly extending distal to the center of the chiasma crurale, and, in two specimens, even to the level of the tendon sheath. The most distal fibers of the flexor digitorum longus muscle were seen 4 mm (range −10 mm to 19 mm; standard deviation 7.3 mm) above the ankle joint. They reached the level of the tendon sheath in all specimens. Each of these findings was visible in the axial MR images.
On average, the tendon sheaths began 23 mm above the ankle joint (range 15–22 mm; standard deviation 6.2 mm) and extended inferior to the center of the chiasma crurale in all specimens.
The profile of the tendons changed considerably, depending on the location, owing to the proximity and contact of the two tendons and to the myotendinous junction (Fig. 1). At the proximal limit of the chiasma crurale, the PTT demonstrated a round to elliptical shape, with the long diameter in the sagittal plane and with a comet-shaped slim anterolateral extension. This extension was formed by additional tendon slips from the very distal musculotendinous junction that joined the major tendon.
At the same level, the FDLT also showed an elliptical shape, with its long diameter in the sagittal plane. The mean cross-sectional areas at the proximal limit of the chiasma crurale were 23.4 mm2 (range 14.0–33.3 mm2; standard deviation 5.6 mm2) for the PTT, and 8.5 mm2(range 5.7– 13.0 mm2; standard deviation 2.3 mm2) for the FDLT (Table2). At the level of the center of the chiasma crurale, the PTT demonstrated a round to rectangular shape, with a
small ‘comet tail’ sometimes visible. At this level, the FDLT had a triangular shape, with its base sitting on the surface of the PTT. In three specimens, there was an additional small extension arising from the top of the triangle opposite the PTT, leading to a shape reminiscent of a hood. As in the PTT, this extension was built by additional tendon slips from the very distal musculotendinous junction that joined the major tendon.
The mean cross-sectional areas of the two tendons were 24.9 mm2 (range 15.7–38.5 mm2; standard deviation 5.9 mm2) for the PTT and 8.8 mm2(range 6.0–12.3 mm2; standard deviation 2.1 mm2) for the FDLT at this level. At the level of the ankle joint, both tendons showed an oval shape. The mean cross-sectional areas were 26.5 mm2 (range 19.3–34.5 mm2
; standard deviation 5.6 mm2) for the PTT and 11.0 mm2 (range 7.1–15.2 mm2; standard deviation 3.0 mm2) for the FDLT. All cross-sectional areas of the PTT and FDLT increased along their course in a proximal to distal direction. In MR images, the various tendon shapes were easily seen.
The anatomy above and below the center of the chiasma was considerably different. Above the center of the chiasma, there was only a fine layer of fat tissue between the tendons, which was seen in five specimens. This layer thinned distally and eventually vanished at a level clearly higher than that of the center of the chiasma. The tendon surface was shiny, regular and smooth in all specimens, and there was no evidence of superficial degenerative fraying of the tendon. The MR images also showed no tendon abnormalities at this level.
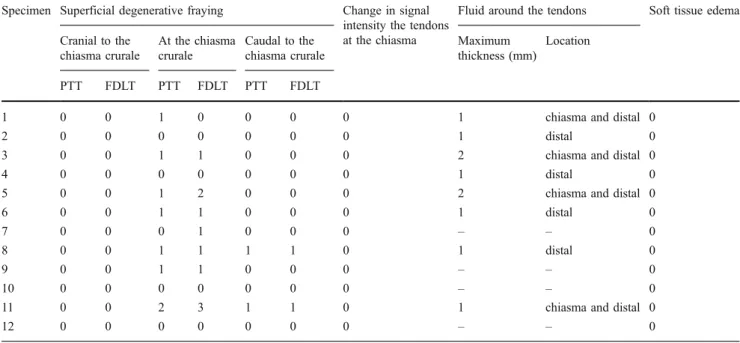
Table 3 Degenerative changes at the chiasma crurale as seen on MR imaging. Superficial tendon fraying:0 none, 1 mild, 2 moderate, 3 severe.
Changes in signal intensity in the tendons at the chiasma: 0 no, 1 yes. Soft tissue edema around the tendons: 0 no, 1 yes. PTT posterior tibialis tendon, FDLT flexor digitorum longus tendon
Specimen Superficial degenerative fraying Change in signal
intensity the tendons at the chiasma
Fluid around the tendons Soft tissue edema
Cranial to the chiasma crurale At the chiasma crurale Caudal to the chiasma crurale Maximum thickness (mm) Location PTT FDLT PTT FDLT PTT FDLT
1 0 0 1 0 0 0 0 1 chiasma and distal 0
2 0 0 0 0 0 0 0 1 distal 0
3 0 0 1 1 0 0 0 2 chiasma and distal 0
4 0 0 0 0 0 0 0 1 distal 0
5 0 0 1 2 0 0 0 2 chiasma and distal 0
6 0 0 1 1 0 0 0 1 distal 0
7 0 0 0 1 0 0 0 – – 0
8 0 0 1 1 1 1 0 1 distal 0
9 0 0 1 1 0 0 0 – – 0
10 0 0 0 0 0 0 0 – – 0
11 0 0 2 3 1 1 0 1 chiasma and distal 0
12 0 0 0 0 0 0 0 – – 0
Table 3 Degenerative changes at the chiasma crurale as seen on MR imaging. Superficial tendon fraying: 0 none, 1 mild, 2 moderate, 3 severe. Changes in signal intensity in the tendons at the chiasma: 0 no,
1 yes. Soft tissue edema around the tendons: 0 no, 1 yes. PTT posterior tibialis tendon, FDLT flexor digitorum longus tendon
At the center of the chiasma crurale, there was no tissue visible between the two tendons during gross anatomic inspection and histologic analysis (Figs. 1 and 2). Histo-logically, there was slight irregularity of the tendon surface in five cadavers (Fig. 2). However, the peritenon was always intact and there were no evident degenerative changes to the tendon fibers. Grossly, the tendons appeared shiny and smooth in all specimens. In MR images, in contrast to the histologic findings, the surface of both tendons was irregular and appeared to be frayed in the majority of the specimens (Fig.3, Table 3).
Below the center of the chiasma crurale, a separate sheath for each tendon was evident. Both tendon sheaths began at the same level above the ankle joint in all
specimens. Both tendons were spanned by the most distal part of the deep transverse fascia of the leg (deep layer of the fascia cruris) (Fig. 1). Subjacent to the deep transverse fascia, a fine septum reached to the periosteum of the tibia and separated the spaces for the PTT and FDLT tendons. Another fine septum arose from the periosteum at the posterior aspect of the distal tibia posterolateral to the FDLT, passed around the FDLT, and joined the deep transverse fascia of the leg (Fig.1). At this level, we found no degenerative changes anatomically or histologically or on analysis of the MR images.
In two specimens there was an additional thick septum between the tendons (Fig. 4). It arose from the deep transverse fascia of the leg, slightly below the center of the Fig. 4 Anatomic variant of a
thick septum between the tendons at the level of the center of the chiasma crurale. Anatomic slides (a, c, e) and corresponding proton density-weighted MR images (b, d, f) between the level of the center and distal limit of the chiasma. A thick septum (arrowheads) arising between the PTT and FDLT from the deep transverse fascia of the leg (a, b) courses between the PTT (T) and FDLT (F) and runs distally to join the periosteum of the posterior aspect of the distal tibia (e, f). In the most cranial sections (a, b) and middle sections (c, d), the very distal muscle fibers of the flexor digitorum longus are evident. Asterisks, very distal FDLT muscle fibers
chiasma crurale, and coursed distally between the PTT and FDLT, merging with the periosteum at the posterior aspect of the distal tibia.
In eight specimens there was fluid around both tendons in the images that were acquired before tenography (Table 3). These collections were more pronounced distal to the center of the chiasma crurale and were within the tendon sheath, but the fluid also extended to the center and proximal part of the chiasma crurale. Distally, the fluid was encountered to the level of the ankle joint space in all specimens. The presence of fluid around the tendons was not associated with any other pathologic changes. We found no partial or complete tendon tears and no alteration in signal intensity within the substance of the tendon. Further, no soft tissue edema was detected around the tendons, and the tendon sheath was never thicker than 1 mm. No connections between the two tendons were detected.
Discussion
The term chiasma crurale designates the acute-angled inter-section of the FDLT and the PTT at the posteromedial aspect of the distal lower leg. Owing to the long myotendinous junction, the intersection involves both the tendons and the most distal muscle fibers of the tibialis posterior and flexor digitorum longus. Additional tendon slips from the very distal musculotendinous junction that join the major tendon are easily recognized as extensions of the PTT and FDLT.
Analogous to the intersection syndrome of the forearm, where the tendons of the first (abductor pollicis longus and extensor pollicis brevis) and second (extensor carpi radialis longus and extensor carpi radialis brevis) dorsal extensor tendon compartments of the wrist intersect, we anticipated finding degenerative changes in the PTT and FDLT at the chiasma crurale. However, the intersection syndrome at the forearm is rare and is considered to be an overuse syndrome [3, 14–16]. Thus, we did not expect to find frank inflammation at the chiasma crurale, but rather some friction-related changes on the surfaces of the tendons, a finding that we often suggested upon analysis of clinical MR imaging examinations. Indeed, irregularity of the tendon surface in the center of the chiasma crurale was detected in MR images in approximately 80% of the specimens in this investigation. However, on histologic analysis, there was not one instance of superficial fraying of either the PTT or the FDLT, and the most superficial layer of the tendon (i.e., peritenon) was intact in all specimens. Additionally, there were no degenerative changes seen anatomically. Thus, we concluded that the irregularities of the tendon surface evident in MR images should be regarded as normal, as they do not reflect true degenerative changes.
Except for a small layer of fat, no tissue was found between the tendons in the majority of the specimens. However, in two specimens, an anatomic variant was detected, consisting of a thick septum coursing between the tendons and connecting the deep transverse fascia of the leg with the periosteum at the posterior aspect of the distal tibia. The number of specimens in this study was too small to allow us to determine the frequency of this finding, although the observed frequency was 16% in our cadavers. No other anatomic variants were found.
There was fluid around the PTT and FDLT in eight of our specimens. However, there were no tendon tears or other soft tissue abnormalities. This finding is consistent with those of Nazarian et al. [17] and Schweitzer et al. [18], who stated that fluid around these tendons can be a sign of tendon tears but can also occur without any pathologic change. The prevalence (80%) of fluid accumulations around the tendons was much higher than expected. In some of the specimens the fluid could also be a result of the freezing and thawing of the specimens and, therefore, not associated to any kind of abnormality.
Our study was limited by the small numbers of speci-mens and histological samples. All images of the specispeci-mens were acquired with the ankle joint in a neutral position. To the best of our knowledge, there has been no publication that dealt with positional changes of the PTT and FDLT at the chiasma crurale with plantar flexion and dorsiflexion of the ankle. Hence, it is not known whether the tendon surfaces having contact in the neutral position are the same in plantar flexion and dorsiflexion of the ankle, nor how the anatomy changes in these positions.
In conclusion, the anatomy of the chiasma crurale can be visualized in depth in axial MR images. There is no tissue between the PTT and FDLT, except for a small layer of fat, unless an anatomic variant is present. Despite the rationale that intersecting tendons are prone to excessive frictional forces, no pathologic findings of either the PTT or FDLT were found in our specimens, and changes on MR images that suggest tendon degeneration at the chiasma crurale might be misleading.
Open Access This article is distributed under the terms of the
Creative Commons Attribution Noncommercial License which per-mits any noncommercial use, distribution, and reproduction in any medium, provided the original author(s) and source are credited.
References
1. Sobotta J. In: Putz R, Pabst R, editors. Sobotta atlas of human anatomy. Philadelphia: Lippincott Williams & Wilkins; 2001. 2. Stoller DW. MRI, arthroscopy, and surgical anatomy of the joints.
3. Lee RP, Hatem SF, Recht MP. Extended MRI findings of
intersection syndrome. Skeletal Radiol. 2009;38:157–63.
4. Kainberger F, Mittermaier F, Seidl G, Parth E, Weinstabl R.
Imaging of tendons—adaptation, degeneration, rupture. Eur J
Radiol. 1997;25:209–22.
5. Clancy WG. Tendon trauma and overuse injuries. In: Leadbetter WB, Buckwalter JA, Gordon SL, editors. Sports-induced inflammation: clinical and basic science concepts. Park Ridge, IL: American Academy of Orthopedic Surgery; 1990. p. 103–21.
6. Lo IK, Burkhart SS. The etiology and assessment of subscapularis tendon tears: a case for subcoracoid impingement, the roller-wringer effect, and TUFF lesions of the subscapularis.
Arthros-copy. 2003;19:1142–50.
7. Pfahler M, Branner S, Refior HJ. The role of the bicipital groove in tendopathy of the long biceps tendon. J Shoulder Elbow Surg.
1999;8:419–24.
8. Zanetti M, Weishaupt D, Gerber C, Hodler J. Tendinopathy and rupture of the tendon of the long head of the biceps brachii muscle: evaluation with MR arthrography. AJR Am J Roentgenol.
1998;170:1557–61.
9. Pavlov H, Heneghan MA, Hersh A, Goldman AB, Vigorita V. The Haglund syndrome: initial and differential diagnosis. Radiology. 1982;144:83–8.
10. Lovell AGH, Tanner HH. Synovial membranes, with special reference to those related to the tendons of the foot and ankle. J Anat. 1988;42:414–23.
11. Glajchen N, Schweitzer M. MRI features in de Quervain’s
tenosynovitis of the wrist. Skeletal Radiol. 1996;25:63–5.
12. Schweitzer ME, Karasick D. MR imaging of disorders of the
posterior tibialis tendon. AJR Am J Roentgenol. 2000;175:627–
35.
13. Erickson SJ, Quinn SF, Kneeland JB, Smith JW, Johnson JE, Carrera GF, et al. MR imaging of the tarsal tunnel and related spaces: normal and abnormal findings with anatomic correlation. AJR Am J Roentgenol. 1990;155:323–8.
14. de Lima JE, Kim HJ, Albertotti F, Resnick D. Intersection syndrome: MR imaging with anatomic comparison of the distal
forearm. Skeletal Radiol. 2004;33:627–31.
15. Costa CR, Morrison WB, Carrino JA. MRI features of intersection syndrome of the forearm. AJR Am J Roentgenol.
2003;181:1245–9.
16. Tagliafico AS, Ameri P, Michaud J, Derchi LE, Sormani MP, Martinoli C. Wrist injuries in nonprofessional tennis players: relationships with different grips. Am J Sports Med. 2009;37:
760–7.
17. Nazarian LN, Rawool NM, Martin CE, Schweitzer ME. Synovial fluid in the hindfoot and ankle: detection of amount and distribution with US. Radiology. 1995;197:275–8.
18. Schweitzer ME, van Leersum M, Ehrlich SS, Wapner K. Fluid in normal and abnormal ankle joints: amount and distribution as seen on MR images. AJR Am J Roentgenol. 1994;162: 111–4.