HAL Id: tel-01128335
https://tel.archives-ouvertes.fr/tel-01128335
Submitted on 9 Mar 2015
HAL is a multi-disciplinary open access
archive for the deposit and dissemination of sci-entific research documents, whether they are pub-lished or not. The documents may come from teaching and research institutions in France or abroad, or from public or private research centers.
L’archive ouverte pluridisciplinaire HAL, est destinée au dépôt et à la diffusion de documents scientifiques de niveau recherche, publiés ou non, émanant des établissements d’enseignement et de recherche français ou étrangers, des laboratoires publics ou privés.
flooding : understanding social vulnerabilities and risks
Mae Brigitt Bernadel Villordon
To cite this version:
Mae Brigitt Bernadel Villordon. Community-based flood vulnerability index for urban flooding : understanding social vulnerabilities and risks. Other. Université Nice Sophia Antipolis, 2014. English. �NNT : 2014NICE4145�. �tel-01128335�
Community-Based Flood Vulnerability Index for Urban Flooding: Understanding Social Vulnerabilities and Risks
UNIVERSITE DE NICE-SOPHIA ANTIPOLIS
ECOLE DOCTORALE STIC
SCIENCES ET TECHNOLOGIES DE L’INFORMATION ET DE LA COMMUNICATION
T H E S E
pour l’obtention du grade de
Docteur en Sciences
de l’Université de Nice-Sophia Antipolis
Mention: Automatique, Traitement du Signal et des Images
présentée et soutenue parMae Brigitt Bernadel VILLORDON
Community-Based Flood Vulnerability Index for Urban Flooding:
Understanding Social Vulnerabilities and Risks
Thèse dirigée par Philippe GOURBESVILLE soutenue le 8 décembre 2014
Jury:
M. Manuel GOMEZ VALENTIN, Professeur UPC-Barcelone Rapporteur
M. Shie Yui LIONG, Professeur-Deputy Director of Tropical Marine Science Institute Rapporteur
M. Franco Siccardi, Professeur Université de Génes Examinateur
M. Philippe Audra, Professeur-Polytech Nice Sophia/Université Nice Sophia Antipolis Examinateur
Mme. Anny Cupo, Professeur-Polytech Nice Sophia/Université Nice Sophia Antipolis Examinateur
Community-Based Flood Vulnerability Index for Urban Flooding: Understanding Social Vulnerabilities and Risks
ACKNOWLEDGEMENTS
I am deeply thankful to God Almighty who has always been treating me so kind and so generous. For HIS unwavering love and blessings, I am grateful.
I extend my gratitude to the European Commission for Erasmus Mundus Mobility with Asia (EMMA Action 2) Lot 12: 2010-2362/001-001-EMA2 and to Silliman University to possibly carry out my PhD study here in Nice, France.
To Prof. Philippe Gourbesville whom I am also very grateful for the opportunity to work with him, for giving me space to do my studies, space to write and space to be. Forever, I will be grateful to you, thank you sir.
I am also thankful to Prof. Roy Olsen De Leon for his support and guidance in my studies, my colleagues Joan Tura and Prof. Michael Alcala for the data input and assisting me in my field work. Thank you to Rafael Vargas, Qiang Ma, Duong Vo, Mingxuan Du, Kim Lien and Jelena Batica who were kind and helpful enough to helped me improved my paper and for their cheerful company, thank you guys!
And to those wonderful people whom I have met during my stay in Europe, thank you for enriching my personal life. My time here has been a wonderful and beautiful journey. To mommy Ingrid M. Rosell thank you for the love and support. To all my dear friends back home, here and in other parts of the world, thank you for keeping me company through your letters, mails and postcards. Thank you.
Finally, I would like to express my deepest love and gratitude to my mother and sister for their constant love and support and the coming of my niece into this world is such a great joy and blessing. And to the greatest guru of all: life.
Community-Based Flood Vulnerability Index for Urban Flooding: Understanding Social Vulnerabilities and Risks
Sujet de thèse en Français: Index de vulnérabilité sanitaire pour les crues urbaines:
évaluation de la vulnérabilité sociale et des risques
Résumé en Français
Selon le World Risk Report publié par United Nations University Institute for Environment and Human Security, les Philippines occupent la troisème place mondiale pour l’exposition aux risques naturels. Un des risques majeurs est celui des inondatoons qui représente un défi pour la sécurité de sa population et le développement économique du pays. L’impact de ses inondations sur la santé publique des communautés en function deleur vulnérabilité sociale a été très peu étudié jusqu’à présent faute de données systématiques. Ce travail de recherceh se concentre sur ces aspect et propose une méthodologie pour évaluer la vulnérabilité sanitaire d’une population exposée à des inondations récurrentes. La methodologie est basée sur une évaluation de la connaissance, de l’attitude et des pratiques (KAP) des populations inondées et de leur résilience vis à vis de leur exposition à des pathogènes tels que E.coli, Leptospirosis and la dengue qui peuvent se développer à la suite d’un typhon. Des indicateurs communautaires ont été élaborés afin de caractériser les communautés. Ces indicateurs intègrent le profil socio-démographique, les conditions de logement, l'environnement physique ainsi que la gouvernance locale. Ces éléments sont importants pour évaluer le dégré de vulnérabilité sociale vis à vis du risque sanitaire afin de pouvoir ensuite intégrer ces éléments dans les outils de modélisation. Une investigation de terrain a été effectuée dans la ville de Dumaguete, Philippines, de mars 2013 à juillet 2013. Un total de 357 familles réparties dans 12 communautés ont été interrogés. L’analyse de ces données a permis de révéler une vulnérabilité synthétisée dans un indice (IVF) qui s’établi en moyenne à 39,34 %. Le secteur de Barangay Tabuc-tubig présente un indice de 53,39 % et s’avère le site le plus vulnérable. L’indice de vulnérabilité est basé sur 5 composants: hydroclimatique, social, économique, socio- comportementale et politico-administratif. Cette rapproche permet de caractériser l’état de vulnérabilité des communautés. Les résultats démontre que
Community-Based Flood Vulnerability Index for Urban Flooding: Understanding Social Vulnerabilities and Risks
l'indice de vulnérabilité reste faible malgré des indicateurs d'exposition élevées. Ce résultat peut s’expliquer par la résilience élevée des communautés dans leurs stratégies d'adaptation lors des inondations. Cette recherche a permis de démontrer que Dans ce travail de recherche, l'indice de vulnérabilité est lié aux variables intervenant dans la caractérisation de la résilience.
Community-Based Flood Vulnerability Index for Urban Flooding: Understanding Social Vulnerabilities and Risks
ABSTRACT
According to the World Risk Report released by the United Nations University Institute for Environment and Human Security, the Philippines is ranked third globally in terms of disaster risk. One of those disaster risks is flooding which poses a serious challenge to the development and the lives of the people. Public health risks and understanding social vulnerability are usually overlooked and undermined and only very little attention is given. Thus, this research work focuses on these aspects. This research was an exploratory step towards assessing vulnerability particularly to fluvial flooding. It was a rapid assessment of the Knowledge, Attitudes, and Practices (KAP) of the community people towards flood vulnerability and resilience and their exposure to microorganisms such as E.coli, Leptospirosis and the Dengue Fever mosquito which could pose an outbreak after a typhoon event. Appropriate community-based indicators were formulated and developed. Their socio-demographic profile, housing conditions, physical environment and governance were also included. These are important factors to be assessed in order to establish correlations and relationships in understanding social vulnerabilities and risks using local indicators which can be incorporated later in hydroinformatics. The survey was done from March 2013 to July 2013 to capture the dry and wet season for sampling. A total of 357 household respondents from the 12 communities and 30 respondents from the LGU and NGO were surveyed. Results of the study revealed an overall Flood Vulnerability Index (FVI) of 39.34%. Barangay Tabuc-tubig (53.39%) topping from all the 12 communities surveyed using the newly developed 36 community-based flood vulnerability indicators with its corresponding 5 major components namely; hydro-climatic, social, economic, socio-behavioral and the politico-administrative. This research also reveals the most vulnerable communities from each of those 5 major components surveyed. It is interesting to note that Flood Vulnerability Index remains low in spite that the exposure indicators are high. The low FVI can be attributed to the community’s high resilience in its coping and adaptation strategies. In this research work, the Flood Vulnerability Index is significantly sensitive to susceptibility and flood resilience variables.
Community-Based Flood Vulnerability Index for Urban Flooding: Understanding Social Vulnerabilities and Risks
TABLE OF CONTENTS
Acknowledgement ……….2
ABSTRACT ... 5
List of Figures ………..11
List of Tables ... 15
Nomenclature and Symbols………. 21
CHAPTER 1: CHAPTER 1 SUMMARY ... 24
introduction ... 25
1.1 Approaches and Frameworks for Community-Based Flood Vulnerability Index (FVI).. ... 27
1.2 Flood Vulnerability Factors ... 29
1.3 Identifying the Key Components and Indicators of the Developed Community-Based Flood Vulnerability Index (FVI) ... 30
1.4 Health Impact Assessment... 31
1.5 FLOOD RESILIENCE ADAPTATION STRATEGIES ASSESSMENT ... 33
1.6 BACKGROUND OF THE STUDY ... 33
1.6.1 Types and Causes of Flooding ... 35
1.6.2 Natural Disasters: Storm and Flood Record Worldwide and in the Philippines ... 42
1.6.3 The Natural Disaster’s Data in the Philippines from the 1900-2014 ... 46
1.6.4 On the Health Impact Assessment: Disease Surveillance in the Philippines on Diarrhoea, Leptospirosis and Dengue Fever ... 51
1.7 STATE OF THE ART AND NEEDED IMPROVEMENTS ... 57
1.7.1 The Bündnis Entwicklung Hilft (Alliance Development Works) and United Nations University Institute for Environment and Human Security (UNU-EHS) ... 57
Community-Based Flood Vulnerability Index for Urban Flooding: Understanding Social Vulnerabilities and Risks
1.7.3 A Flood Vulnerability Index for Coastal Cities and Its Use in Assessing
Climate Change Impacts ... 58
1.7.4 The 2012 Philippine Disaster Report ... 59
1.8 Situation in the Philippines ... 59
1.8.1 Needed Improvements ... 61
1.8.2 Significance for Developing of the Community-Based Vulnerability Index for Urban Flooding... 62
CHAPTER 2 CHAPTER SUMMARY ……….63
CONCEPTUALIZING FLOOD VULNERABILITY ... 64
2.1 Vulnerability to Floods ... 65
2.2 The Water Resource System ... 66
2.3 Vulnerability Frameworks ... 68
2.4 Global Risk and Vulnerability Indicators ... 71
2.4.1 Disaster Risk Index ... 71
2.4.2 World Risk Index ... 73
2.4.3 A Flood Vulnerability Index for Coastal Cities and Its Use in Assessing Climate Change Impacts ... 76
2.4.4 Existing Flood Vulnerability Index, Risk and Vulnerability Studies in the Philippines ... 77
2.5 The Hyogo Framework for Action (HFA) (2005-2015) of the United Nations ... 79
2.6 Flood Management and Flood Mitigation ... 80
2.6.1 Structural and Non-Structural Measures... 80
2.6.2 The Identified Emergency Evacuation Areas of Dumaguete City ... 88
2.6.3 The Incident Command System of Dumaguete City ... 89
Community-Based Flood Vulnerability Index for Urban Flooding: Understanding Social Vulnerabilities and Risks
2.6.5 General Monitoring and Evaluation Framework ... 91
CHAPTER 3 CHAPTER SUMMARY ……….93
The Development of Community-Based Flood Vulnerability Framework: Its Components and Indicators for Urban Flooding ... 94
3.1 The Theoretical Framework ... 95
3.2 Flood Vulnerability Factors ... 96
3.2.1 Exposure ... 97
3.2.2 Susceptibility (Before the floods: Awareness and Preparedness) (During the floods: Dealing and Coping) ... 97
3.2.3 Resilience (During: Handling and Coping) (After: Survive and Recuperate)… ... 97
3.3 Identifying the Key Components and Indicators of Community-Based Flood Vulnerability Index (FVI) ... 98
3.3.1 Hydro-Climatic Component ... 99
3.3.2 Social Component ... 100
3.3.3 Economic Component ... 100
3.3.4 Socio-Behavioral Component ... 100
3.3.5 Politico-Administrative Component ... 101
CHAPTER 4 CHAPTER SUMMARY ... 104
APPLICATION OF THE METHODOLOGY OF THE COMMUNITY-BASED FLOOD VULNERABILITY INDEX (FVI) FOR URBAN FLOODING:DATA COLLECTION AND TREATMENT ... 105
4.1 Community-Based Flood Vulnerability Index Methodology ... 105
4.2 Equation ... 107
4.3 Study Area ... 109
Community-Based Flood Vulnerability Index for Urban Flooding: Understanding Social Vulnerabilities and Risks
4.4 Community Profile ... 118 (1) Tabuc-tubig ... 118 (2) Junob ... 119 (3) Poblacion 1 (Tinago) ... 120 (4) Calindagan... 121 (5) Balugo ... 122 (6) Poblacion 2 (Lukewright) ... 123 (7) Poblacion 8 ... 124 (8) Cadawinonan ... 125 (9) Bagacay ... 126 (10) Taclobo ... 127 (11) Candau-ay ... 128 (12) Batinguel ... 129 4.5 Temporary Shelters ... 130
4.6 The Relocation Sites ... 131
4.7 The Situation of the Most Recent Flooding Event in 2011 ... 132
4.8 Methodology for Hydrological Data of Banica River ... 133
4.9 Health Impact Assessment Methodology ... 142
4.9.1 Sampling and Microbial Analyses ... 144
4.10 E.coli Exposure of the 12 Communities ... 150
Chapter 5 CHAPTER SUMMARY ... 161
RESULTS and DISCUSSIONS ... 162
5.1 Community Profile Results ... 163 5.2 DETAILED ANALYSIS: Building Scale for Poblacion 2 (Barangay Lukewright) 198
Community-Based Flood Vulnerability Index for Urban Flooding: Understanding Social Vulnerabilities and Risks
5.3 The Total E.coli counts (colony forming units or CFU’s) per 100ml Water Sample
during Dry and Wet Season from the Different Stations of the Banica River ... 213
5.4 The Overall Average E.coli counts per 100ml Water Sample during Dry and Wet Season from the Different Stations of the Banica River ... 215
5.5 Assessment on Flood Resilience Adaptation Strategies in Dumaguete City Solicited from the Household Respondents of the 12 Communities ... 219
5.6 The Overall Results for the Flood Vulnerability Index (FVI) of Dumaguete City ... 233
5.7 The OVERALL Result from Assessment on Flood Resilience Adaptation Strategies ... 243
5.8 The OVERALL counts of E.coli (CFU’s) per 100 mL water ... 244
sample from the 5 Stations ... 244
CHAPTER 6 ... 245
CONCLUSIONS and PERSPECTIVES ... 245
REFERENCES AND CITATIONS ………249
Appendix 1 English Household Survey Questionnaire………...253
Appendix 2 Visayan Household Survey Form Questionnaire ………..267
Appendix 3 Survey Form Questionnaire Local Government Units (LGU's) and Non-Governmental Organizations (NGO's) ………...279
Appendix 4 Respondents Profile ……… 285
Appendix 5 Flood Resilience Knowledge ……….. 345
Appendix 6 Environmental Microbial Health Risks: Knowledge ………... 408
Appendix 7 LGU's and NGO's Survey Results ………... 513
Appendix 8 Assessment on Flood Resilience and Health Program of the LGU's and NGO's ………...540
Community-Based Flood Vulnerability Index for Urban Flooding: Understanding Social Vulnerabilities and Risks
List of Figures
Figure 1-1: Community-Based Flood Vulnerability Framework: Based from SUST
Vulnerability Framework (Turner II et al. 2003) ... 27
Figure 1-2: Community-Based Flood Vulnerability Components and Indicators ... 28
Figure 1-3: Methodology Framework for Community-Based Flood Vulnerability Index for Urban Flooding ... 30
Figure 1-4: River Flood (Dumaguete City, Philippines) ... 37
Figure 1-5: Flash Flood (Dumaguete City, Philippines) ... 38
Figure 1-6: Urban Floods (Manila, Philippines) ... 39
Figure 1-7: Coastal Floods (Iligan City, Philippines) ... 40
Figure 1-8: Pluvial or Overland Floods ... 41
Figure 1-9: Number of Natural Disaster Reported 1900-2012 ... 43
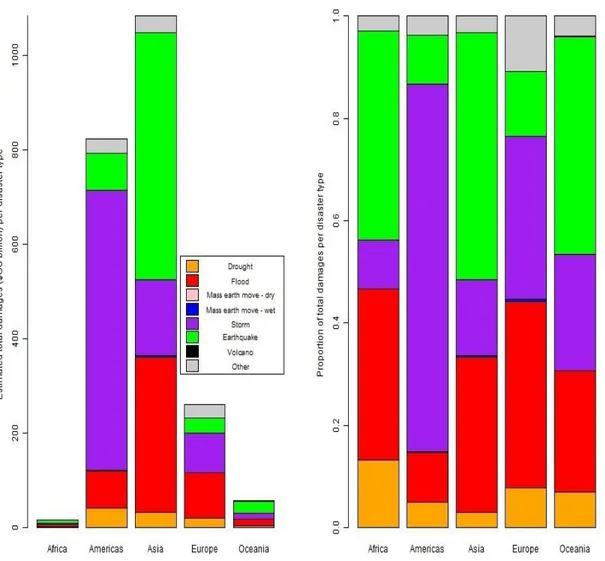
Figure 1-10: Total Damages ($US billion) Caused by Reported Natural Disasters 1900-2012 ... 44
Figure 1-11: Number of Occurrence of Flood Disaster by Country: 1974-2003 ... 45
Figure 1-12: Natural Disaster Occurrence Reported ... 47
Figure 1-13: Percentage of Reported People Killed by Disaster Type ... 48
Figure 1-14: Percentage of Reported People Affected by Disaster Type ... 48
Figure 1-15: Estimated Economic Damages Reported by Disaster Type (US$ X 1,000) ... 49
Figure 2-1:The Water Resource Systems (GRoWE, 2005) ... 66
Figure 2-2: a and b Water Resource System’s Sub-System and its Interactions (van Beek, 2005) ... 67
Figure 2-3:Link Between Subsystems and Components ... 68
Figure 2-4:SUST Vulnerability Framework. Full Framework (Turner II et.al. 2003) .... 69
Figure 2-5:SUST Vulnerability Framework Detailed Framework (Turner II et al. 2003) ... 70
Community-Based Flood Vulnerability Index for Urban Flooding: Understanding Social Vulnerabilities and Risks
Figure 2-7: Local Disaster Risk Reduction and Management Council (LDRRMC)
Structure ... 83
Figure 2-8: Small to Medium Isolated Emergencies/Disaster Situations ... 85
Figure 2-9: LDRRMO Service Command Team Leaders and Members ... 87
Figure 2-10: LDRRMO Organizational Structure (for Large Scale Emergency, incorporating ICS) ... 87
Figure 3-1: Community-Based Flood Vulnerability Components and Indicators ... 95
Figure 4-1 Methodology Framework for Community-Based Flood Vulnerability Index for Urban Flooding ... 105
Figure 4-2: Map of the Philippines and my Study Site ... 109
Figure 4-3: Flooding in Manila, Philippines ... 111
Figure 4-4: Boundary Map of Dumaguete City, Philippines ... 112
Figure 4-5: Elevation Map of Dumaguete City, Philippines ... 113
Figure 4-6: Banica and Okoy River Watershed Location Map ... 114
Figure 4-7: Existing General Land Use Map ... 117
Figure 4-8: Barangay Tabuc-tubig ... 118
Figure 4-9: Barangay Junob ... 119
Figure 4-10: Poblacion 1 (Barangay Tinago) ... 120
Figure 4-11: Barangay Calindagan ... 121
Figure 4-12: Barangay Balugo ... 122
Figure 4-13: Poblacion 2 (Barangay Lukewright) ... 123
Figure 4-14: Poblacion 8 ... 124
Figure 4-15: Barangay Cadawinonan ... 125
Figure 4-16: Barangay Bagacay ... 126
Figure 4-17: Barangay Taclobo ... 127
Figure 4-18: Barangay Candau-ay ... 128
Figure 4-19: Barangay Batinguel ... 129
Figure 4-20: Temporary Shelters in Barangay Junob ... 130
Figure 4-21: Temporary Shelters in Barangay Bagacay ... 130
Community-Based Flood Vulnerability Index for Urban Flooding: Understanding Social Vulnerabilities and Risks
Figure 4-23: Flash Flood in Dumaguete City, Philippines ... 132
Figure 4-24: The Daily Activities of the Community People in Relation to Banica River ... 132
Figure 4-25: Station 1 (S1): City Pound Bridge, Barangay Balugo ... 134
Figure 4-26: Station 2 (S2): Smokey Mountain Overflow, Barangay Balugo and Candau-ay ... 135
Figure 4-27: Station 3 (S3): Barangay Candau-ay and Cadawinonan ... 136
Figure 4-28: Station 4 (S4): Barangay Taclobo Overflow ... 137
Figure 4-29: Station 5 (S5) Colon Extension Overflow (Barangay Taclobo) ... 138
Figure 4-30: Station 6 (S6): Barangay Tabuc-tubig Bridge ... 139
Figure 4-31: Station 7 (S7): Barangay Calindagan Bridge ... 140
Figure 4-32: Station 8 (S8) Poblacion 1 (Tinago) Bridge ... 142
Figure 4-33: EMB plate (left) positive for E.coli (greenish metallic sheeen) and EMB plate (right) negative for E.coli colonies ... 145
Figure 4-34: Upstream (S1): City Pound Bridge, Barangay Balugo ... 146
Figure 4-35: Midstream 1 (S3): Barangay Candau-ay and Cadawinonan Overflow .... 147
Figure 4-36: Midstream 2 (S5): Colon Extension Overflow, Barangay Taclobo ... 148
Figure 4-37: Downstream 1 (S7): Barangay Tabuc-tubig Bridge ... 149
Figure 4-38: Downstream 2 (S8): Barangay Calindagan and Poblacion 1 ... 150
Figure 5-1: Hydro-Climatic Component of Flood Vulnerability Iindex of Poblacion 2 .. 198
Figure 5-2: Social Component of Flood Vulnerability Iindex of Poblacion 2 ... 200
Figure 5-3: Economic Components of Flood Vulnerability Iindex of Poblacion 2 ... 202
Figure 5-4: Socio-Behavioral Component of Flood Vulnerability Iindex on Flood Resilience of Poblacion 2 ... 204
Figure 5-5: Socio-Behavioral Component of Flood Vulnerability Index on the Exposure of Microorganisms (E.coli, Leptospirosis, and Dengue Fever Mosquito of Pobalcion 2 ... 206
Figure 5-6: Combined Socio-Behavioral Component of Flood Vulnerability Iindex on Flood Resilience and Microorganisms of Poblacion 2 ... 208
Community-Based Flood Vulnerability Index for Urban Flooding: Understanding Social Vulnerabilities and Risks
Figure 5-7: Politico-Administrative Component of Flood Vulnerability Iindex of Poblacion
2 ... 210
Figure 5-8: Hydro-Climatic Component on Flood Vulnerability Index ……… 233
Figure 5-9: Social Component on Flood Vulnerability Index ………235
Figure 5-10: Economic Component on Flood Vulnerability Index...……… 236
Figure 5-11: Socio-Behavioral Compnent on Flood Vulerability Index………... 237
Figure 5-12: Politico-Administrative Compnent on Flood Vulerability Index…………. 238
Figure 5-13: Overall Flood Vulnerability Index for the 12 Communities………. 240
Figure 5-14: The Flood Map of Dumaguete City, Philippines……….. 241
Community-Based Flood Vulnerability Index for Urban Flooding: Understanding Social Vulnerabilities and Risks
LIST OF TABLES
Table 1-1: Top 10 Natural Disasters in the Philippines for the period 1900-2014 (Killed)
... 46
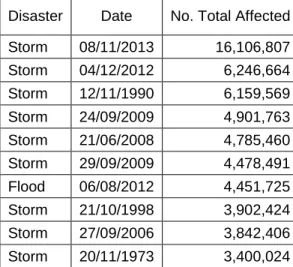
Table 1-2: Top 10 Natural Disasters in the Philippines for the period 1900-2014 (Affected) ... 46
Table 1-3: Average Disaster per Year Worldwide ... 47
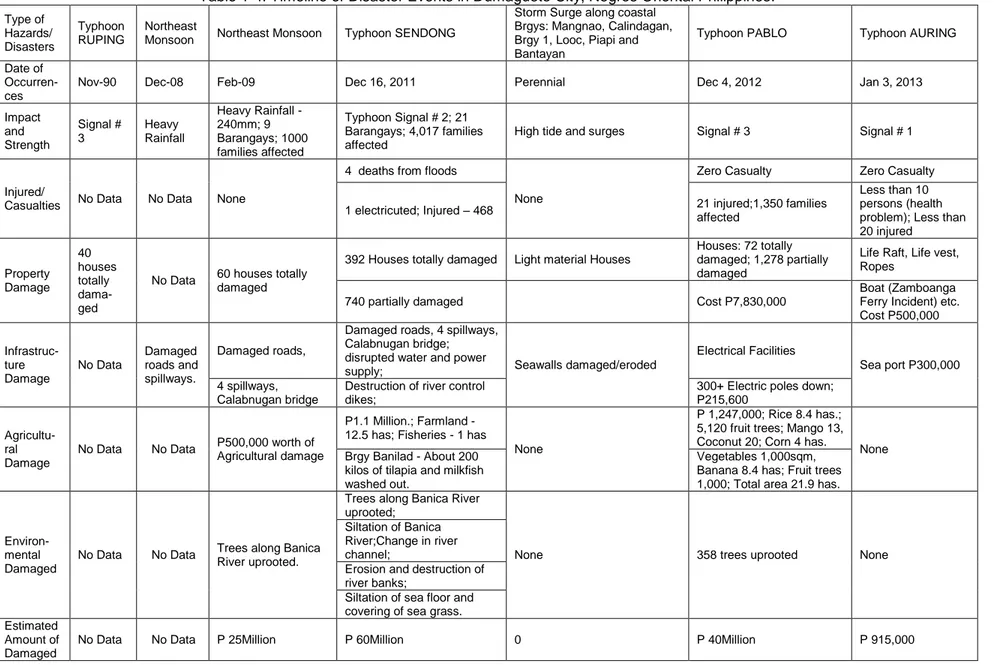
Table 1-4: Timeline of Disaster Events in Dumaguete City, Negros Oriental Philippines. ... 50
Table 1-5: Ten (10) Leading Causes of Child Mortality Among 1-4 Years Old. ... 54
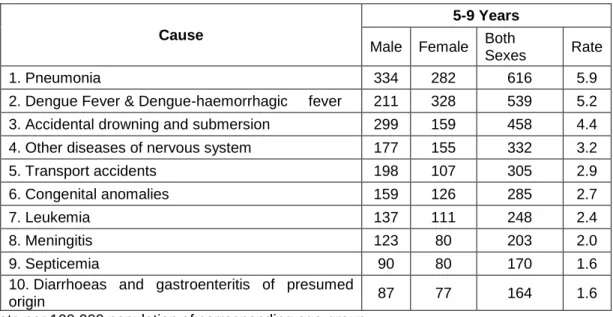
Table 1-6: Ten (10) Leading Causes of Child Mortality Among 5-9 Years Old. ... 54
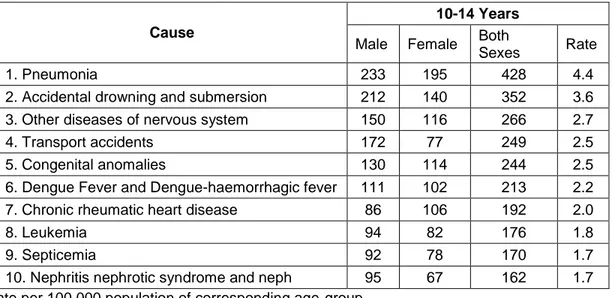
Table 1-7: Ten (10) Leading Causes of Child Mortality Among 10-14 Years Old. ... 55
Table 1-8: Top 10 Leading Causes of Morbidity in Dumaguete City in 2012 ... 56
Table 1-9: Top 10 Leading Causes of Morbidity in Dumaguete City in 2011 ... 56
Table 1-10: Top 10 Leading Causes of Morbidity in Dumaguete City in 2010 ... 57
Table 2-1: List of LDRRMC Members ... 84
Table 3-1: Relationship Between Components and Indicators ... 103
Table 4-1: Population Profile and the Suggested Sample Size (SS) ... 106
Table 4-2: Hydrological Data of Banica River for Station 1 (S1) ... 134
Table 4-3: Hydrological Data of Banica River for Station 2 (S2) ... 135
Table 4-4: Hydrological Data of Banica River for Station 3 (S3) ... 136
Table 4-5: Hydrological Data of Banica River for Station 4 (S4) ... 137
Table 4-6: Hydrological Data of Banica River for Station 5 (S5) ... 138
Table 4-7: Hydrological Data of Banica River for Station 6 (S6) ... 139
Table 4-8: Hydrological Data of Banica River for Station 7 (S7) ... 140
Table 4-9: Hydrological Data of Banica River for Station 8 (S8) ... 141
Table 4-10: E.coli counts during dry and wet season (March-July, 2013) Upstream: City Pound Bridge, Barangay Balugo ... 145
Table 4-11: E.coli counts during dry and wet season (March-July, 2013) Midstream 1: Barangay Candau-ay and Cadawinonan Overflow ... 146
Community-Based Flood Vulnerability Index for Urban Flooding: Understanding Social Vulnerabilities and Risks
Table 4-12: E.coli counts during dry and wet season (March-July, 2013) Midstream 2: Colon Extension Overflow, Barangay Taclobo ... 147 Table 4-13: E.coli counts during dry and wet season (March-July, 2013) Downstream 1: Tabuc-Tubig Bridge ... 148 Table 4-14: E.coli counts during dry and wet season (March-July, 2013) Downstream 2: Barangay Calindagan and Tinago ... 149 Table 4-15: E.coli Exposure in Banica River through swimming/bathing (Tabuc-tubig) ... 150 Table 4-16: E.coli Exposure in Banica River through swimming/bathing (Junob) ... 151 Table 4-17: E.coli Exposure in Banica River through swimming/bathing (Poblacion 1) ... 151 Table 4-18: E.coli Exposure in Banica River through swimming/bathing (Calindagan) 151 Table 4-19: E.coli Exposure in Banica River through swimming/bathing (Poblacion 2) ... 152 Table 4-20: E.coli Exposure in Banica River through swimming/bathing (Balugo) ... 152 Table 4-21: E.coli Exposure in Banica River through swimming/bathing (Poblacion 8) ... 152 Table 4-22: E.coli Exposure in Banica River through swimming/bathing (Cadawinonan) ... 153 Table 4-23: E.coli Exposure in Banica River through swimming/bathing (Bagacay) ... 153 Table 4-24: E.coli Exposure in Banica River through swimming/bathing (Taclobo) .... 154 Table 4-25: E.coli Exposure in Banica River through swimming/bathing (Candau-ay) 154 Table 4-26: E.coli Exposure in Banica River through swimming/bathing (Batinguel) .. 155 Table 4-27: E.coli Exposure in Banica River through immersing/washing of clothes (Tabuc-tubig) ... 155 Table 4-28: E.coli Exposure in Banica River through immersing/washing of clothes (Junob) ... 156 Table 4-29: E.coli Exposure in Banica River through immersing/washing of clothes (Poblacion 1) ... 156
Community-Based Flood Vulnerability Index for Urban Flooding: Understanding Social Vulnerabilities and Risks
Table 4-30: E.coli Exposure in Banica River through immersing/washing of clothes
(Calindagan) ... 156
Table 4-31: E.coli Exposure in Banica River through immersing/washing of clothes (Balugo) ... 157
Table 4-32: E.coli Exposure in Banica River through immersing/washing of clothes (Poblacion 2) ... 157
Table 4-33: E.coli Exposure in Banica River through immersing/washing of clothes (Poblacion 8) ... 157
Table 4-34: E.coli Exposure in Banica River through immersing/washing of clothes (Cadawinonan) ... 158
Table 4-35: E.coli Exposure in Banica River through immersing/washing of clothes (Bagacay) ... 158
Table 4-36: E.coli Exposure in Banica River through immersing/washing of clothes (Taclobo) ... 159
Table 4-37: E.coli Exposure in Banica River through immersing/washing of clothes (Candau-ay) ... 159
Table 4-38: E.coli Exposure in Banica River through immersing/washing of clothes (Batinguel) ... 160
Table 5-1: Barangay Tabuc-Tubig FVI ………... 161
Table 5-2: Barangay Junob FVI ... 168
Table 5-3: Poblacion 1 (Barangay Tinago) FVI ... 171
Table 5-4: Barangay Calindagan FVI ... 174
Table 5-5: Barangay Balugo FVI ... 178
Table 5-6: Poblacion 2 (Barangay Lukewright) FVI ... 181
Table 5-7: Poblacion 8 FVI ... 184
Table 5-8: Barangay Cadawinonan FVI ... 186
Table 5-9: Barangay Bagacay FVI ... 189
Table 5-10: Barangay Taclobo FVI ... 191
Table 5-11: Barangay Candau-ay FVI ... 194
Community-Based Flood Vulnerability Index for Urban Flooding: Understanding Social Vulnerabilities and Risks
Table 5-13: Hydro-Climatic Component of FIood Vulnerability Indexof Poblacion 2 .. 199
Table 5-14: Social Component of FIood Vulnerability Index of Poblacion 2 ... 201
Table 5-15: Economic Component of FIood Vulnerability Index of Poblacion 2 ... 203
Table 5-16: Socio-Behavioral Component of FIood Vulnerability Index on Flood Resilience of Poblacion 2 ... 205
Table 5-17: Socio-Behavioral Component of FIood Vulnerability Index on the Exposure of Microorganisms (E.coli, Leptospirosis, Dengue Fever Mosquito) of Poblacion 2 .... 207
Table 5-18: Combined Socio-Behavioral on Resilience and Exposure to Microorganisms of Poblacion 2 ... 209
Table 5-19: Politico-Administrative Component of FIood Vulnerability Index of Poblacion 2 ... 211
Table 5-20: Overall Flood Vulnerability Index for Poblacion 2 ... 212
Table 5-21: Total E.coli counts per 100mL for the month of March, 2013 ... 213
Table 5-22: Total E.coli counts per 100mL for the month of April, 2013 ... 213
Table 5-23: Total E.coli counts per 100mL for the month of May, 2013 ... 214
Table 5-24: Total E.coli counts per 100mL for the month of June, 2013 ... 214
Table 5-25: Total E.coli counts per 100mL for the month of July, 2013 ... 215
Table 5-26: The Overall Average E.coli counts per 100mL during dry and wet season for Upstream (Station 1) ... 215
Table 5-27: The Overall Average E.coli count per 100mL during dry and wet season for Midstream 1 (Station 2) ... 216
Table 5-28: The Overall Average E.coli counts per 100mL during dry and wet season for Midstream 2 (Station 5) ... 217
Table 5-29: The Overall Average E.coli counts per 100mL during dry and wet season for Downstream 1 (Station 7) ... 217
Table 5-30: The Overall Average counts per 100mL during dry and wet season for Downstream 2 (Station 8) ... 218
Table 5-31: Implementation and monitoring of the policies, plans and programs for the different natural calamities particularly typhoons and flooding events ... 219
Community-Based Flood Vulnerability Index for Urban Flooding: Understanding Social Vulnerabilities and Risks
Table 5-32: Transparency and trustworthiness of the LGU's in terms of the facilitation and distribution of the budget and donations for the affected population in the
community during calamity ... 220
Table 5-33: Livelihood and financial aid for the community people to help them recover again from such calamity ... 220
Table 5-34: Programmes and policies in saving and protecting the Banica River ... 221
Table 5-35: Cooperation of the community people including you (household respondents) in protecting the Banica River ... 222
Table 5-36: On the drainage systems ... 222
Table 5-37: On the dike systems ... 223
Table 5-38: On the bridge system ... 224
Table 5-39: On the community flood hazard maps ... 224
Table 5-40: The use of backhoe in cleaning the Banica river especially when normal flow is blocked ... 225
Table 5-41: Distribution of donations, goods and relief ... 225
Table 5-42: Distribution of brochures and the information drive that would increase knowledge on the negative impacts from typhoon and flooding events for the purposes of prevention and recovery ... 226
Table 5-43: On the flood warning systems ... 227
Table 5-44: Preparedness and flood drill activity in the community to increase resilience from typhoons and floods ... 227
Table 5-45: Response and preparedness of the DRRMC, PDRRMC, and other NGO volunteers during rescue events ... 228
Table 5-46: The basic emergency and relief services such as food, water, sanitation, transportation, communication, medical help, provisional repairs of damaged properties ... 229
Table 5-47: Operation clean-up affected places, giving of insurances, claims, financial aids, traumatic and psychological stress debriefings... 229
Table 5-48: Relocation sites provided by the LGU's to those who were affected from the last flooding and to those who live in the flood prone area ... 230
Community-Based Flood Vulnerability Index for Urban Flooding: Understanding Social Vulnerabilities and Risks
Table 5-49: Health programmes for diarrhoae and Leptospirosis such as medical help, information drive and among others so outbreaks can be prevented ... 231 Table 5-50: Different prevention and control programmes for Dengue Fever infection such as fogging, chemical/biological control, information drive brochures, lectures, clean-up ... 231 Table 5-51: Assessment on Flood Resilience Adaptation Strategies solicited from the Local Government Units (LGU's) and the Non-Governmental Organizations (NGO's) and from the Household Respondents ... 232 Table 5-52: Overall FVI and the FVI of the Five (5) Components ... 241 Table 5-53:Flood Vulnerability Index: Pearson Product Moment Correlation Matrix (r) ... 242 Table 5-54: The OVERALL Result from Assessment on Flood Resilience Adaptation Strategies solicited from the Local Government Units (LGU's) and from the Non-Governmental Organizations (NGO's) ... 243 Table 5-55: The OVERALL counts of E.coli (CFU's) per 100mL water sample from the five (5) Stations ... 244
Community-Based Flood Vulnerability Index for Urban Flooding: Understanding Social Vulnerabilities and Risks
Nomenclature and Symbols
The following nomenclature and symbols were used in this dissertation.
ABBREVIATIONS
AIS - Administrative and Institutional Subsystem ACDV’s - Accredited Community Disaster Volunteers AGE – Acute Gastrointestinal Enteritis
AMSL – Above Mean Sea Level
BDCC - Barangay Disaster Coordinating Council
BDRRMCs - Barangay Disaster Risk Reduction Management Committee BRW - Banica River Watershed
CaMReSC - Camp Management and Relief Service Command CDCC - City Disaster Coordinating Council
CCFVI – Coastal Cities Flood Vulnerability Index
CDRRMC - City Disaster Risk Reduction and Management Council CDRRMP - City Disaster Risk Reduction Management Plan
CFU’s – Colony Forming Units CHO - City Health Office
CRED – Centre for Research on the Epidemiology of Disasters
CSWDO - City Social Welfare office, Planning and Development Office DANA-SC - Damage Assessment and Needs Analysis Service Command DBM – Department of Budget and Management
DENR – Department of Environment and Natural Resources DILG – Department of Interior and Local Government
DIPECHO – Disaster Preparedness European Commission’s Humanitarian Aid Department
DOH - Department of Health DRI - Disaster Risk Index DRR - Disaster Risk Reduction
DRRMF - Disaster Risk Reduction and Management Fund EMB - Eosin-Methylene Blue agar
EMT - Emergency Management Team EPA – Environment Protection Agency EM-DAT – Emergency Events Data Base
EM-DAT: The OFDA/CRED International Disaster Database EWSC - Early Warning Service Command
FVI – Flood Vulnerability Index GDP - Gross Domestic Product
GIS - Geophysical Information System
GIZ - Deutsche Gesellschaft fur Internationale Zusammenarbeit GPS – Global Positioning System
Community-Based Flood Vulnerability Index for Urban Flooding: Understanding Social Vulnerabilities and Risks
HFA - Hyogo Framework for Action ICS - Incident Command System
IFRC - International Federation of Red Cross
IPCC - Intergovernmental Panel on Climate Change ISDR – International Strategy for Disaster Reduction KAP - Knowledge, Attitudes, and Practices
LDRRMC - Local Disaster Risk Reduction and Management Council of Dumaguete City LDRRMO - Local Disaster Risk Reduction and Management Office
LDRRMP - Local Disaster Risk Reduction and Management Plan LGU’s – Local Government Units
MHSC - Medical and Health Service Command MGB - Mines and Geosciences Bureau
MOA - Memorandum of Agreement
NDRRMC- National Disaster Risk Reduction and Management Council NIA –National Irrigation Administration
NGO’s – Non-Governmental Organizations
NOAA - National Oceanic and Atmospheric Administration OFDA – Office of Foreign Assistance
PAGASA – The Philippine Atmospheric, Geophysical and Astronomical Services PDRRM – Philippine Disaster Risk Reduction and Management
PDRRMC - Provincial Disaster Risk Reduction Management Council RA – Republic Act
RRSC - Response and Rescue Service Command SP –Sangguniang Panlalawigan
SUVFRU - Silliman Volunteer for Fire and Rescue Unit UNEP – United Nations Environmental Programme
UNESCO-IHE – United Nations Educational, Scientific and Cultural Organization-Institute for Water Education
UNDP – United Nations Development Program
UNISDR - United Nations Office for Disaster Risk Reduction
UNU-EHS - United Nations University Institute for Environment and Human Security WB – World Bank
Community-Based Flood Vulnerability Index for Urban Flooding: Understanding Social Vulnerabilities and Risks
SYMBOLS
AHDF – Attitude of Households on Dengue Fever AHEC – Attitude of Households on E.coli
AHFR – Attitude of Households on Flood Resilience AHL – Attitude of Households on Liptospirosis EA - Educational Attainment
FF - Frequency of Flooding FI –Family Income
FVIc - Flood Vulnerability Index Combined (Flood Resilience and Microorganisms) FVIfr – Flood Vulnerability Index for Flood Resilience
FVImqs - Flood Vulnerability Index for Microorganisms (E.coli, Liptospirosis, Dengue Fever)
G – Governance
HC – Housing Conditions HF – Height of Flooding HH – Households
HNE –Houses Not on Elevated area
HNIS – Houses with No access to Improved Sanitation HNIW - Houses with No access to Improved Water source
HPP – Health and Prevention of E.coli, Liptospirosis and Dengue Fever HRF – Houses Reached by Flood
KHDF – Knowledge of Households on Dengue Fever KHEC – Knowledge of Households on E.coli
KHFR – Knowledge of Households on Flood Resilience KHL – Knowledge of Households on Liptospirosis
LUMSD - Land Use Management and Structural Design NTY – Number of Typhoons per Year
ODAW - Open disposal of animal waste
PHDF – Practices of Households on Dengue Fever PHEC – Practices of Households on E.coli
PHFR - Practices of Households on Flood Resilience PHL – Practices of Households on Liptospirosis PI –Property Insurance
PRAI – Post-Risk Assessment and Integration PRV – Presence of Rats in the Vicinity
PWLV – Presence of Water-Logged areas in the Vicinity
RNRMP – River’s Natural Resources and Natural Features Management and Programme
RSP – Relocation Site Project
SCLP – Sustainable Community Livelihood Programme SN - Social Networks
SS – Sample Size
UVR - Unwillingness to vacate and be relocated WT - Water Treatment or Sterilization Practice
Community-Based Flood Vulnerability Index for Urban Flooding: Understanding Social Vulnerabilities and Risks
CHAPTER 1 INTRODUCTION
SUMMARY
Chapter 1 is an introductory chapter where it gives a brief description of what this entire research work is all about. For instance, how the development of this community-based flood vulnerability index was formulated and how different it is from other similar studies; the respondents whom the survey was solicited from; in what way this research work is done in a more detailed manner compared to the previous and similar studies and how it is improved. Furthermore, glimpses illustration of previous and existing approaches and frameworks for flood vulnerability studies along with the proposed community-based flood vulnerability index are also presented. The identified flood vulnerability factors, key components and indicators will also made mentioned in this chapter.
Apart from the surveys solicited for this developed community-based flood vulnerability index, a health impact assessment was also included in this research work and briefly presented here. Microbial hazards such as that of E.coli, Leptospirosis, and Dengue fever mosquito were identified and chosen as focus of the study. This particular environmental microbial hazard was characterized and noted. Exposure assessment and risk characterization were also considered and being made mention in this chapter. Alongside, flood resilience adaptation strategies assessment is also briefly presented. Much of this chapter reveals about historical records of natural disasters worldwide from 1900-2012 and of the Philippines that are of great importance in this research work. For the purpose of clarity, types and causes of floods were also clearly described and categorized. Reviews of relevant literature, reports, and surveillance data of focus and its impacts to human health are also presented.
Other similar studies on disaster risks, flood vulnerability and resilience index were also reviewed. The current situation in the Philippines in terms of disaster coordination and facilitation is also look into. Finally, the aim and purpose of this research work was laid down including the needed improvements and significance and its importance of why conducting this kind of research work are presented in the latter part of this chapter.
Community-Based Flood Vulnerability Index for Urban Flooding: Understanding Social Vulnerabilities and Risks
CHAPTER 1
INTRODUCTION
The development of community-based flood vulnerability index (FVI) for urban flooding through using local components and indicators is important in generating a localized-based flood vulnerability index that depicts a more realistic scenario of vulnerability and resilience indexes in a local, national and international setting. There have been a number of studies conducted in the past years that is similar to this but mostly revolves around national data or on a per country description but have neglected to include some of the important components which has theoretical and practical significance due to lack of relevant data from the community level. The gaps of knowledge for disaster risk, the lack of concerted actions from numerous players in the society during disaster recovery, and using community-based indicators is what this research work is trying to accomplish to address those gaps so we would have a thorough understanding why the community people are vulnerable or resilient in the first place.
Soliciting the responses from the individual household respondents themselves and the local government units (LGU’s) from each of the communities involved and including those who are in the city and provincial disaster coordinating council office and the volunteers from the non-governmental organizations (NGO’s) have been the sources of the actual community survey. It is very important to do an actual field survey so that a realistic scenario will be generated and projected.
This research work is done in a more detailed survey of which the improvement that this work has accomplished when it comes to addressing the socio-economic profile of the individual households, including their socio-behavioral approach in terms of the knowledge, attitudes, and practices towards flood vulnerability and resilience particularly on the items of hazards, risks, exposure, preparedness, response, recovery, coordination, and adaptation strategies. The socio-behavioral approach was conducted in a more detailed way by soliciting the community people’s Knowledge, Attitudes and Practices (KAP) particularly on flood preparedness and health impacts and it is measured in terms of their exposure to E.coli, Leptospirosis and Dengue Fever particularly on the nature of these organisms, their mode of transmission, prevention, signs and symptoms, how fatal, treatment, and the financial cost of treatment. The hydro-climatic and politico-administrative components were also studied in detailed. Measuring the KAP of the respondents from preparedness to recovery, and as well as the KAP on the exposures of the microorganisms in focus would give us a clue how community people perceived in these kinds of phenomenon which are translated into
Community-Based Flood Vulnerability Index for Urban Flooding: Understanding Social Vulnerabilities and Risks
their attitudes and practices before, during or after any catastrophic events such as typhoons and flooding.
There are five (5) flood vulnerability components and thirty-six (36) indicators that were developed in this work. Each of the indicators is belonging to a specific flood vulnerability component and to a particular flood vulnerability factors; namely exposure, susceptibility and resilience that would eventually produce community-based flood vulnerability index profile.
Apart from developing a community-based flood vulnerability index, this research work has also included a simple health impact assessment that is associated with the daily exposure of the community people in the river prior to, during and after flooding events. The health impact assessment includes microbial analysis through laboratory culture of E.coli from collected water samples from the river. The frequency of exposure and the possible amount of ingested contaminated water were also included. The KAP towards exposure to E.coli, Leptospirosis and Dengue fever mosquito completes the health impact assessment in this research work.
Moreover, this research work has also performed an assessment on the flood resilience adaptation strategy solicited from Local Government Units (LGU’s) and the Non-Governmental Organizations (NGO’s) and from the Household Respondents respectively to be able to have a holistic view and a comprehensive result of the different items that are significant in the overall understanding of social vulnerabilities and risks.
The approaches and frameworks of this community-based flood vulnerability index (FVI), health impact assessment and flood resilience adaptation strategy assessment will be thoroughly discussed in the succeeding chapters, in the meantime an overview of these approaches and frameworks will be presented below
Community-Based Flood Vulnerability Index for Urban Flooding: Understanding Social Vulnerabilities and Risks
1.1 Approaches and Frameworks for Community-Based Flood
Vulnerability Index (FVI)
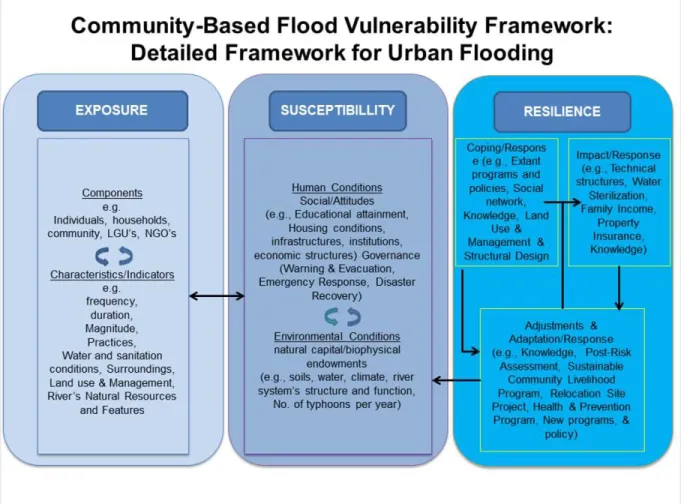
A system’s vulnerability to hazards consists of (i) linkages to the broader human and biophysical (environmental) conditions and processes operating on the coupled system in question; (ii) perturbations and stressors/stresses that emerge from this conditions and processes; and (iii) the coupled human – environment system of concern in which vulnerability resides, including exposure and responses (i.e. coping, impacts, adjustments, and adaptation). It is seen that changes in the resilience can affect the susceptibility of a system and if we are careless with our actions, it can alter the whole system in ways that make it difficult to recover.
Figure 1-1: Community-Based Flood Vulnerability Framework: Based from SUST Vulnerability Framework (Turner II et al. 2003)
Figure 1-1 depicts the proposed version of “working framework” which is based from Turner’s conceptual framework. The different components and indicators that were
Community-Based Flood Vulnerability Index for Urban Flooding: Understanding Social Vulnerabilities and Risks
used in this work are shown in the category (exposure, susceptibility, and resilience) to which it appropriately belonged to.
The theoretical framework is presented in the succeeding page along with its corresponding description and detailed discussions of the interplay of the different components and indicators in producing a community-based flood vulnerability index.
Figure 1-2: Community-Based Flood Vulnerability Components and Indicators
In this community-based flood vulnerability framework shown in figure 1-2, the researcher presented the relationship of the vulnerability components along with the three (3) vulnerability factors and its corresponding indicators on how it could influence vulnerability. The indicators are shown in a more detailed manner (see table 3.1) for the detailed description of the abbreviations used. A brief illustration is presented below while the detailed descriptions and discussions are found in the succeeding chapters.
Community-Based Flood Vulnerability Index for Urban Flooding: Understanding Social Vulnerabilities and Risks
1.2 Flood Vulnerability Factors
This section provides an overview of the selected components and indicators in the development and calculation of the Community-Based Flood Vulnerability Index (FVI) for Dumaguete City, Negros Oriental Philippines. This research work was done locally among the twelve communities of Dumaguete City and the researcher has based the analysis to the following components: Hydro-Climatic, Social, Economic, Socio-Behavioral and Politico-Administrative components which are general and relevant to the local level. The individual indicators of each of the components will be made mention below.
There are 3 important factors of vulnerability to consider all throughout the components which determine the vulnerability index. These factors are exposure, susceptibility and resilience. In addition, the concept of vulnerability will also be described below to facilitate a complete understanding of the interplay and influence of the indicators to the components and factors of vulnerability.
Vulnerability is considered as the extent of harm which can be expected under certain conditions of exposure, susceptibility, and resilience. More specifically in the case of floods, a system is susceptible to floods due to exposure in conjunction with its capacity/incapacity to be resilient, to cope, recover or adapt to the extent. Some of the exposed populations are protected from flooding by various structural and non-structural measures that are part of the resilience strategy. On the other hand, some of them have none, or only weak, flood defenses and the exposed populations are more often subject to flooding with the consequent disruption, economic loss and loss of life (Balica, S.F., Wright, N.G., and van der Meulen, F., 2012). In this research, vulnerability is the result of the interplay of the indicators in the exposure, susceptibility and resilience category. By dividing the FVI into different components, such as hydro-climatic, social, economic, socio-behavioral, and politico-administrative and linking them with the factors of vulnerability (exposure, susceptibility, resilience) can help identify the weak and strong points of a certain community in terms of flood vulnerability and in that way, it helps to propose strategies for improvement and identifies which one is a priority.
Community-Based Flood Vulnerability Index for Urban Flooding: Understanding Social Vulnerabilities and Risks
1.3 Identifying the Key Components and Indicators of the
Developed Community-Based Flood Vulnerability Index (FVI)
This part deals with the description of the components and its indicators as used on the local scale to capture the aspects of exposure, susceptibility, and resilience as well as their aggregation to the Community-Based Flood Vulnerability Index. In this research work the indicators vary, a totally different indicators used but were chosen based on the same concept developed by the WorldRiskIndex Report and the study of Balica et.al (2012) on the development of Flood Vulnerability Index for Coastal City.
This research work is trying to fill those categories suggested by those studies that were not included in the global scale, for instance, indicators such as housing conditions; disaster preparedness and early warning; social networks; property insurance; Knowledge, Attitude, Practices (KAP) of respondents on flood resilience; and exposure to microorganisms such as that of E.coli, Leptospirosis and Dengue fever mosquito; the different adaptation strategies such as integration of post-risk assessments; sustainable community livelihood; relocation site projects and health programs for the prevention against diarrhoea, leptospirosis and dengue fever which are facilitated by the LGU’s and as well as some NGO’s. Figure 1-3 below shows the five components of this proposed community-based flood vulnerability index in producing flood vulnerability indexes, maps and profiles.
Community-Based Flood Vulnerability Index for Urban Flooding: Understanding Social Vulnerabilities and Risks
These five components have been linked with the three factors of vulnerability as shown in Table 3.1 The relationship of these factors and components should increase the robustness of the developed Community-Based FVI as it was also observed in the study of Balica et al. (2012). These five components are; hydro-climatic, social, economic, socio-behavioral, and politico-administrative and along with the thirty-six (36) indicators that were used and examined in computing for the community-based flood vulnerability index (FVI) for Dumaguete City, Negros Oriental. By computing the FVI of the city, hotspots to flooding events with the corresponding strong and weak points will be identified and mapped. By doing so, this would serve as a tool to assist planners and policymakers in prioritising their areas of intervention and to provide useful information for awareness rising.
The development of this community-based FVI which is in the Philippines local context involved the interplay of factors within the water resource system in the event of flooding, a deductive approach was used to identify the best possible indicators based on the existing principles and conceptual framework (Chapter 2).
1.4 Health Impact Assessment
In a developing country like the Philippines and among others, outbreaks of certain diseases such as that of bacterial and viral in origin are common during and after a flooding event. Traumatic experiences are also observed during such events and to some extent exposure on a daily basis is also a common scenario. Their effects can be direct or indirect, immediate or long term. Health impact assessment is therefore important so as to address this issues which is usually have been overlooked. This research work has conducted a crude assessment on the presence of E.coli in the Banica river where the community people have the possibility of being exposed to.
Water samples were taken during dry and wet season for five (5) consecutive months. The frequencies of possible exposures were investigated including the activities that predisposed the respondents. The amount of ingested of contaminated water were also taking into account on a daily basis and during and after flooding events. The respondents were also asked if they have experienced diarrhoea, leptospirosis and dengue fever infection through memory recall. For Leptospirosis and Dengue fever cases, available health data from the city, provincial and national health agencies were solicited. Hydrological data such as uniform stream flow were also recorded to be able to be able to have a crude picture of the possible flow or stagnation of the organism in focus. Due to limited resources, a simple health impact assessment was done.
Community-Based Flood Vulnerability Index for Urban Flooding: Understanding Social Vulnerabilities and Risks
In conducting a health impact assessment the European Commission’s Directorate General on health and Consumer Affairs (SANCO) have formulated the following steps to harmonized risk assessment procedures and terminology. The four key steps are as follows (European Commission, 2000).
A. Hazard Identification B. Hazard Characterization C. Exposure Assessment D. Risk Characterization
As mentioned in the CORFU project (CORFU FP7 Collaborative Research on Flood Resilience in Urban Areas: Health Impacts Model, 2014), the second step, hazard characterization, is sometimes referred to as Dose-response assessment. Moreover, these four steps have previously been described by the US National Academy of Science’s earlier report on Risk Assessment for Federal Government ( National Academy of Sciences, 1983) and formed the US’s Environmental Protection Agency’s Risk Assessment and Management Paradigm. These four steps has been adopted and used but were conducted slightly different in this particular health impact assessment.
For hazard identification, E.coli, Leptospirosis and Dengue Fever cases were the chosen microorganisms to be assessed because of its common occurrence during and after flooding events. Usually, during and after flooding events cases of diarrhoea are in significant numbers. In some places, leptospirosis cases are also occurring. Dengue fever cases is also rampant during rainy or typhoon seasons. But, what is interesting to know is the people’s vulnerability or resilience in terms of their knowledge, attitude and practices towards these microorganisms. These items have been addressed and solicited from the questionnaires administered to the household respondents.
In doing the hazard characterization, a dose-response assessment was not conducted but instead, results from surveys from the household respondents that indicates their experienced of being sick from any of the focus microorganisms were noted and counted. Top 10 leading causes of morbidity in the city and the country were solicited to counter-check the incidences and occurrences of those diseases.
Exposure assessment was conducted through survey questionnaires. Household respondents were asked if any member in the family has been exposed to E.coli, leptospirosis and dengue fever mosquito. The frequency of exposure to the river and the amount of possible ingestion of the contaminated water were asked and recorded.
Community-Based Flood Vulnerability Index for Urban Flooding: Understanding Social Vulnerabilities and Risks
After gathering the relevant data from hazard identification, characterization and exposure, risk characterization is possible to be established. The level of risks and correlation to exposure in terms of the number of E.coli taken from the different sampling sites, and the number of diarrhoeal cases per community are mentioned in the results and discussion chapter. The step-by-step procedure and discussion is presented in the succeeding pages.
1.5 FLOOD RESILIENCE ADAPTATION STRATEGIES
ASSESSMENT
Assessment on flood resilience adaptation strategies were also solicited from Local Government Units (LGU’s) and the Non-Governmental Organizations (NGO’s) and from the Household Respondents respectively. Issues on governance, sustainable community livelihood, the rivers natural resource and natural features management, land use and management and structural design, risk knowledge-post risk integration, warning and evacuation, emergency response, and disaster recovery were assessed in detailed. It is very important to conduct such assessment to be able to pinpoint the strengths and weaknesses of the program the government has initiated. Having an understanding of the current situation, what needs emphasis and focus, improvements will be given attention. Participation from the different players in the society is important to be able to have a holistic view and a comprehensive result of the different items that are significant in the overall understanding of the social vulnerabilities and risks.
1. 6 BACKGROUND OF THE STUDY
According to the World Risk Report released by the United Nations University Institute for Environment and Human Security, the Philippines is ranked third globally in terms of disaster risk (United Nations University Institute for Environment and Human Security, 2011). Typhoon which usually followed by flooding in some areas is one of those disaster risk that is frequency occurring in the Philippines, twenty or more typhoons visits the country every year leaving devastations in many forms. It is a global phenomenon and due to climate change, this will continue. Urban fluvial flooding in particular caused havoc in many aspects in the society particularly to human health, infrastructure and the economy of the country. Moreover, it has become a usual scenario especially in underdeveloped and the developing countries. However, this phenomenon is also occurring in developed countries though less more frequent than those previous countries mentioned. Flooding poses a serious challenge to the economic development and the lives of the people particularly the residents of a rapidly
Community-Based Flood Vulnerability Index for Urban Flooding: Understanding Social Vulnerabilities and Risks
expanding towns and cities in developing countries. Its causes are shifting and their impacts are accelerating against the backdrop of increasing demographics, urbanization trends and climate change. The current and projected levels of flood impacts give urgency to the need to make flood risk management in urban settlement a high priority on the political and policy agenda. It is therefore important to conduct studies related to vulnerability and resilience at the community level so issues on health and disaster risks will be addressed appropriately.
Public health risk in urban fluvial flooding are usually been overlooked, undermined and only very little attention is given. In Dumaguete City alone, there was no study similar to this that was conducted. This would therefore hopefully serve as a baseline study. Faecal pollution of water particularly human faecal sources are the most relevant source of human illnesses globally especially during flooding event and rainy season. Exposure and ingestion of faecally-contaminated water and other routes of transmission are responsible for a variety of diseases such as diarrhoea, leptospirosis, and bites from dengue mosquitoes which demands special attention. Diarrhoeal and other waterborne diseases still rank among the leading causes of morbidity worldwide and in the Philippines. According to the World Health Organization (WHO), each year diarrhoea kills around 760,000 children under the age of five and is the second leading cause of death among that age group. Worldwide, there are nearly 1.7 billion cases of diarrhoeal disease every year ( WHO, 2013). In the surveillance report of 2013 by the Department of Health (DOH) in the Philippines, a total of 1,174 leptospirosis cases have been reported nationwide from January 1, 2013 to September 17, 2013. This is 78.74% lower compared to the same period last year (5,522), (DOH, 2013). A total of 117,658 dengue fever cases from January 1 to September 7, 2013 were reported nationwide. This is 5.25% lower compared to the same period last year’s (124, 173) cases and mostly coming from regions VI and IV-A, (DOH, 2013). Though the figures of the surveillance report in 2013 were lower than the previous years, yet these recent statistics is still very alarming. Given this high incidences of diarrhoea, leptospirosis, and dengue fever cases, it is therefore important to conduct studies that would provide better understanding how each households perceives, relates and employs their attitudes and practices towards personal hygiene and protection, and to environmental sanitation.
According to the 2012 Philippines Disaster Report, a total of 471 natural and human-induced disasters were reported in the Philippines in 2012 (CDRC, 2012). One thousand six hundred fifteen (1,615) people were killed, and more than 2.8 million families or 12 million people were affected, and caused over Php 39.9 billion in economic damages. In terms of frequency, flood topped the list with 143 reported incidents, or 30% of the total number of disaster events monitored in 2012. Given this
Community-Based Flood Vulnerability Index for Urban Flooding: Understanding Social Vulnerabilities and Risks
high-risk status of the Philippines to hazards in general, it is surprising to find that there were very few comprehensive place-specific vulnerability and resilience assessments performed at the local level in the Philippines which accounts on social vulnerability specifically on how the community people respond to these kind of phenomenon and to the impacts of global warming. Such kinds of studies and assessment should be conducted so such gaps will be addressed properly. This study was an exploratory step towards assessing flood vulnerability and resilience, a rapid assessment of the Knowledge, Attitudes, and Practices (KAP) of the community people towards flood resilience, exposures to the different microorganisms that have health concern during and after a typhoon or flooding event. Environmental sanitation, the hydro-climatic components, including their socio-demographic profile and governance were also included in this study. These are important factors to be assessed in order to established correlations and relationships in understanding social vulnerabilities and its indicators so it can be incorporated in hydroinformatics. Determining flood vulnerability index varies from one country to another. There is no single gold standard used worldwide. Measuring vulnerability and resilience is important, it mirrors how well are the people adapting to climate change and its impacts, how are the resilience programs implemented and facilitated by the local government units. Perhaps it is also important to note that gauging vulnerability may have a number of different reasons but understanding the context of people’s vulnerability to hazards and why they are vulnerable in the first place, seems to be more useful for making a difference in their lives.
1.6.1 Types and Causes of Flooding
Flood is usually due to several factors (Jha, A.K., et al., 2012). A combination of meteorological and hydrological such extreme precipitation and flows is one and human activity is another. Unplanned growth and development in floodplains or from the breach of a dam or the overtopping of an embankment may result to flooding when these structures failed to protect under extreme hydrological weather conditions. Among others are the influxes of people from rural areas to urban places that often settled in areas that are highly exposed to flooding. The lack of flood defense system, the improper implementation of land use and urban development that reduces the permeability of soil while increasing surface runoff coupled with poor drainage system, are one of the many reasons that increases the risk of flooding.
For the purpose of clarity, descriptions and categorizing of floods should be distinguished properly (Balica, S.F., Wright, N.G., and van der Meulen, F., 2012). As mentioned in their paper of which was based from the works of previous authors named as follows, a flood is “defined as a temporary condition of surface water be that be river,