HAL Id: hal-02043744
https://hal.archives-ouvertes.fr/hal-02043744
Submitted on 21 Feb 2021
HAL is a multi-disciplinary open access
archive for the deposit and dissemination of sci-entific research documents, whether they are pub-lished or not. The documents may come from teaching and research institutions in France or abroad, or from public or private research centers.
L’archive ouverte pluridisciplinaire HAL, est destinée au dépôt et à la diffusion de documents scientifiques de niveau recherche, publiés ou non, émanant des établissements d’enseignement et de recherche français ou étrangers, des laboratoires publics ou privés.
U–Th–REE–Hf bearing phases in Mediterranean Sea
sediments: Implications for isotope systematics in the
ocean
Sandra Marchandise, Eric Robin, Sophie Ayrault, Matthieu Roy-Barman
To cite this version:
Sandra Marchandise, Eric Robin, Sophie Ayrault, Matthieu Roy-Barman. U–Th–REE–Hf bearing phases in Mediterranean Sea sediments: Implications for isotope systematics in the ocean. Geochimica et Cosmochimica Acta, Elsevier, 2014, 131, pp.47-61. �10.1016/j.gca.2014.01.017�. �hal-02043744�
1
U-Th-REE-Hf bearing phases in Mediterranean Sea sediments:
implications for isotope systematics in the ocean.
S. Marchandise (1), E. Robin (1, 2), S. Ayrault (1), M. Roy-Barman (1)*.
(1) Laboratoire des Sciences du Climat et de l'Environnement (IPSL/LSCE CNRS-CEA-UVSQ, UMR 8212), 91198 Gif-sur-Yvette Cedex, France
(2) CEA-Grenoble, INAC/SP2M/LEMMA, 17 rue des martyrs, 38054 Grenoble cedex 9, France
*corresponding author: Tel: (33)1-69-82-35-66; Fax: (33)1-69-82-35-68; E-mail address:
Matthieu.Roy-Barman@lsce.ipsl.fr
Version accepted for publication in Geochimica Cosmochimica Acta http://www.sciencedirect.com/science/article/pii/S0016703714000490
2 Abstract
The abundance, size and composition of micron-size U-Th-REE-Hf rich phases of marine clayey silt sediments from the Western Mediterranean sea were determined using an automated scanning electron microscope equipped with an energy dispersive spectrometer. The minerals found in the sediment were monazite, allanite, florencite, xenotime and zircon. The size distribution and chemical composition of each phase were used to determine their contribution to the total content of the sediment in U, Th, REE, Y, Zr and Hf. Zircon accounts for most of the Zr and Hf of the sample. Xenotime and zircon account for most Y and HREE of the sample. However, the high Y-HREE-U-Th content of the zircons analyzed in this study (possibly due to xenotime overgrowth on zircon surface and alteration processes) contrasts with previous works and cannot be extended to any type of zircons. By contrast, only a small fraction (≈ 20-30%) of U, Th and LREE (such as Nd) are carried by U-Th-REE-Hf rich minerals (monazite mostly). It reflects the higher alterability of U-Th and LREE bearing phases compared to zircon and xenotime and implies that most U-Th and LREE are present in other phases at lower concentrations (possibly clays, organic matter or Fe-Mn oxides). The different size distributions of the different carriers can contribute to U-Th and LREE/HREE fractionation observed during the transport of these elements. Due to its very high physical and chemical resistance, zircon appears to be the main Hf carrier even in fine grained "zircon free type" sediments. By storing Lu and possibly releasing extremely radiogenic Hf, xenotime has an unforeseen role in the Lu-Hf systematics in marine sediment.
3 1. Introduction
Marine particles and sediments play a key role in the global cycles of chemical elements in the ocean. Chemical elements such as thorium (Th), uranium (U), rare earth elements (REE) and hafnium (Hf), as well as their isotopes, are used to study marine particles and sources, evolution and interactions with seawater. U and Th isotope series are used to determaine th sinking velocity of marine particles and to determine the age of marine sediments (Henderson and Anderson, 2003). The progressive change in the geochemical properties of the fifteen REE allows their relative abundance (REE “patterns”) to be used as a signature of their origin (Zhang et al. 2008). Among REE, neodymium (Nd) has a specific isotopic signature because 143Nd is produced by radioactive decay of 147Sm (samarium) which has a half-life of1.06×1011 y. Hence, the 143Nd/144Nd ratio is a powerful source tracer (Lacan and Jeandel, 2005). Hf has also a specific isotopic signature, because 176Hf is produced by radioactive decay of 176Lu which has a half-life of 3.71×10¹⁰ y. Lutetium (Lu) is a REE. Hence, the 176Hf/177Hf ratio has the potential to provide information complementary to Nd isotopic signatures (Rickli et al., 2010).
Unfortunately the lack of precise knowledge on the lithogenic and authigenic phases carrying these elements limits the understanding of the chemical processes controlling their behavior in marine particles and sediments. In continental igneous rocks such as granites, ~70-90% of U, Th, REE and Hf are locked in U-Th-REE-Hf rich “accessory” minerals such as monazite, zircon, allanite, xenotime and apatite (Bea, 1996). Until now, no inventory on the contribution of these accessory minerals had been reported in deep sea sediments. The systematic identification and analysis of these micron-size phases in very fine grained sediments require the analysis of thousands of grains, a very tedious task that cannot be achieved manually.
4 In this work, we used a scanning electron microscope equipped with an automated counting and analysis system (Robin et al., 2003) to determine the nature, composition, abundance and size distribution of the U-Th-REE-Hf rich minerals in marine sediments. We have obtained the first inventory of these minerals in deep sea sediments and evaluate their contributions to the bulk concentration of U, Th, REE and Hf in the sediments. We focused on sediments from the DYFAMED (DYnamique des Flux Atmosphériques en MEDiterranée) station in the Ligurian Sea where an unexpected variability of the U/Th ratio in the material collected by sediment trap had been observed (Roy-Barman et al., 2009). Dissolved Th and Nd budgets in the western Mediterranean Sea also suggest a significant release of these elements by lithogenic phases (Henry et al., 1994; Roy-Barman et al., 2002). Determining which fraction of U, Th and REE are locked in refractory minerals should provide valuable information on the impact of mineral sorting on the trace element content of sediments (Marmolejo-Rodriguez et al., 2008) and on the fraction of these elements which is available for dissolution in seawater (Firdaus et al., 2012).
2. Material and methods 2.1. Site and sample description
The DYFAMED site is located in the Ligurian Sea (43°24.61’N, 7°51.68’E, in the north-western sector of the Mediterranean Sea), ~50 km off the coast of continental France (Fig. 1). The DYFAMED site is located at the end of the Var sedimentary system. The Var river drains various lithologies ranging from sedimentary rocks to granites (Fig. EA1 in Electronic appendix and Féraud et al., 2009). At the end of the Var sedimentary system, the Var canyon has a narrow shelf and steep continental slope. During intense flooding and major incidents, this topography favors sediment gravity flows (Migeon et al., 2006). However, the water column is often assumed to be (at least partly) isolated from direct coastal river inputs
5 by the presence of the ligurian current (Schmidt and Reyss, 1996). The sedimentation in the water column is usually dominated by biogenic particles produced in the surface water, significant aeolian deposits of Saharan dusts and continuous inputs of anthropogenic aerosol from European countries (Guieu et al., 1997; Guerzoni et al., 1999). However most of the DYFAMED sediments come from the Var sedimentary system, because the sediment accumulation rate exceeds by an order of magnitude the pelagic flux measured by sediment traps (Miquel et al., 2011).
Surface sediments were collected at a depth of 2350 m in September 1994 (core KT43-4, see Gehlen et al., 1997). The first two slices of the core were 0.5 cm thick and then at 1 cm thickness down to a depth of 5 cm. Sediments were composed mostly of clayey-silts with some very thin sandy laminae diluted within finer sediments (Martín et al., 2009). The sedimentation rate at DYFAMED is estimated to be 0.40 ± 0.01 mm.y-1 (Martín et al., 2009) so that the samples studied are less than ~130 years old.
2.2. Bulk sediment analysis
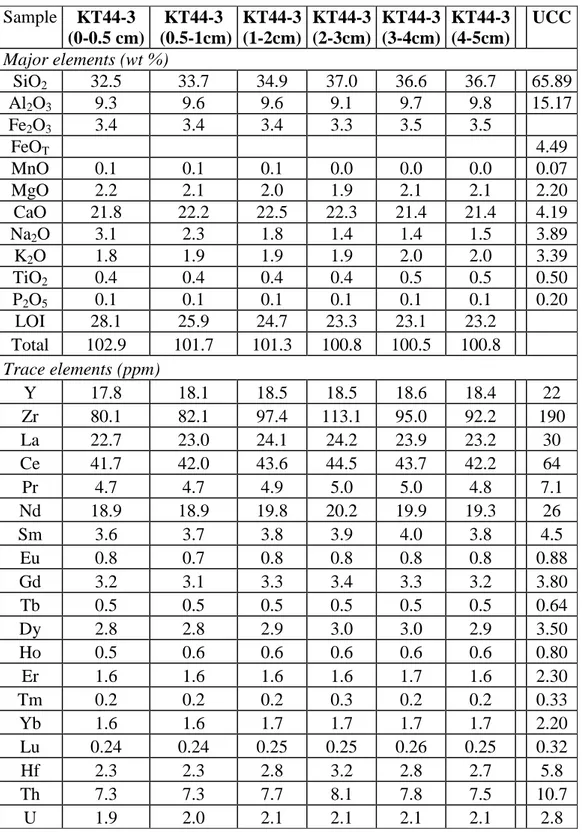
Samples of about 1 g of freeze-dried sediment were taken from depths of 0-0.5 cm, 0.5-1, 1-2, 2-3, 3-4 and 4-5 cm. They were ground and homogenized in an agate mortar. They were analyzed for major and trace elements in routine analyses in the SARM - CRPG - CNRS à Vandoeuvre lès Nancy - France (more details are available in Carignan et al., 2001 and in Table EA1 in the electronic appendix). During this process an aliquot (300 mg) of sample is fused in Pt crucible along with 900 mg of ultra-pure LiBO2 at 980 ◦C in an automatic tunnel
oven. This step is crucial, because it ensures a complete dissolution of the refractory minerals such as zircon.
6
2.3. U-Th-REE-Hf rich mineral grain counting and analysis 2.3.1. Sample preparation
All samples, bulks and separated phases, were prepared following the procedure described by Robin et al., (2003). One or more aliquots of 100-200 µg powdered bulk sediment were dispersed in ethanol using an ultra-sonic bath and filtered on a Nucleopore filter (porosity: 1 µm; surface of filtration: 200 mm2). The filters were then mounted on a carbon sample holder and coated with carbon for Scanning Electron Microscope/Energy Dispersive Spectrometer (SEM/EDS) analyses.
Additional steps described below were implemented on sediment aliquots in order to concentrate large and/or dense particles (Fig. EA2 in the electronic appendix):
- The U-Th-REE-Hf rich minerals have high densities (> 3.0 g/cm3), so that they can be concentrated by heavy liquid separation. A few mg of powdered sediments were added to diiodomethane (density = 3.3 g/cm3) blend with acetone to obtain a density of 3.0 g/cm3. Heavy mineral grains were concentrated by centrifugation in the “sink” while the major phases (carbonates, silicates and organic matter) remained mostly in the “float”. Heavy mineral concentrates were then recovered and prepared for SEM/EDS analyses as described above.
- Large size fractions (≥ 5 µm and ≥ 25 µm) were obtained by sieving about 70 mg of powdered sediment on a 25 µm sieve. Both size fractions (below and above 25 µm) were then recovered on a 5 µm nucleopore filter and prepared for SEM/EDS analyses as described above.
2.3.2. Cumulative size distribution of U-Th-REE-Hf rich mineral grains
The cumulative size distribution of U-Th-REE-Hf rich mineral grains was determined by counting and sorting particles larger than 0.5 µm by size and composition. A JEOL 840
7 Scanning Electron Microscope (SEM) was used. X-ray micro-analyses were achieved using electron-induced X-Ray Emission (µXRE) at 15 kV and 1 nA current. Multi-element spectra were obtained using an Energy Dispersive Spectrometer (EDS) equipped with a high purity germanium and digital pulse processing detector (HPGe) supplied by Princeton Gamma Tech (PGT). The resolution is 125 eV at 10,000 counts per second for the Mn Kα-line. All multi-element spectra obtained from the SEM/EDS-ACC system at 15kV were compared to a series of pure reference spectra acquired in the same operating conditions. X-ray absorption and fluorescence effects were corrected using the ZAF program supplied by PGT.
Automated Chemical Classification (ACC) system
The SEM/EDS assemblage is equipped with an Automated Chemical Classification (ACC) system. The ACC system works as follows (Robin et al. 2003):
- An image was first recorded from the backscattered electron beam. Typical image resolution is 1024 × 1024 pixels and magnification ×1000, parameters well suitable for the detection of particles ranging from 0.5 µm up to 30 µm. The image was then digitized, filtered and a threshold was applied, using the back-scattered electron detector, to remove the most abundant particles- calcareous, siliceous and clay rich minerals from the image of a reference sample. A total of about 300 images per sample randomly dispersed over the filter were acquired.
- In the first step, the location and shape parameters of the detected particles were determined and stored. The particle size was then defined by its area-equivalent diameter (AED), that is the diameter of a circle having equivalent area to that of the particle (AED = [4A/π]1/2 with A the measured particle area). The AED provides an average value of the particle diameter and was used to determine the particle size and mass distributions. Particle counting and size measurements are sensitive to variations of the electron beam
8 intensity, particularly for small size particles. Therefore, the stability of the electron beam was controlled with a laboratory standard composed of DYFAMED sediment mixed with Mn-rich synthetic crystals. Since all U-Th-REE-Hf rich minerals are denser than Mn-rich synthetic mineral, the latter was affected first by a decrease of the electron beam. The abundance and size distribution of the Mn-rich synthetic crystals in the reference sample were measured before and after each sample analysis. Sample analyses were considered accurate when measurements are within 2σ error bars of the reference values.
- In the second step, an X-ray spectrum was acquired during 5 seconds using the HPGe detector attached to the SEM. This was done for particles with AED > 0.5 µm, the minimum particle size required for X-ray spectrum acquisition at 15 kV. U-Th-REE-Hf rich mineral grains were identified from U-Mα, Th-M, La-L, Ce-L, Y-L and Zr-L lines. Typical detection limit of these elements in a 5 seconds spectrum is ~0.5 wt%. Mineral grains were then sorted using P-KLa-L and Ce-L lines for monazite; P-K, Al-K, La-L and Ce-L lines for florencite; Al-K, Si-K, Ca-K, La-L and Ce-L lines for allanite; P-K and Y-L lines for xenotime; Si-K, and Zr-L lines for zircon; P-K and Ca-K lines for apatite. Using this technique, several hundred particles were counted and sorted by size and composition in a few hours.
2.3.3. Abundance and mean mass of U-Th-REE-Hf rich mineral grains
These results were used to determine Ccumul(x), the cumulative size distribution of each
type of mineral grains. Ccumul(x) is the number of grains per g of sediment with an AED
larger than x. Ccumul(0) is the total number of grain (of a given mineral) per g of sediment.
For each type of mineral grains, Ccumul(x) is modeled by the sum of two exponential functions
9
Ccumul(x)max) are computed taking into account the error bars on the measured particle size
distribution.
The numerical abundance of mineral grains > 0.5 µm, i.e., the number of particles per µg (grain/µg), is given by:
S
m S
CnumberCcumul(0.5µm) (1) Where S is the ratio of the filtered surface (200 mm2) to the analyzed surface (typically a few percents of the filtered surface) and ms the mass of filtered sediment (µg).
The mass abundance (µg/g) is given by:
number mineral
mass M C
C (2)
Where Mmineral is the mean mass (pg) of particles > 0.5 µm. It is expressed as a function
of the cumulative size distribution of mineral grains according to the following equation:
5 . 0 number cumul mineral ) ( ) ( C x C d x V M (3)With ρ = the mean density of mineral grains and V(x)(4 3)(x 2)3the volume of the individual crystals expressed as a function of the AED (x in µm).
Two differential mass distributions, dMmineral(x)min and dMmineral(x)max are then calculated
from the minimum and maximum differential size distributions, dCcumul(x)min and
dCcumul(x)max. The mean mass of mineral grains Mmineral is obtained by integrating Eq.(3) over
both differential mass distributions and by averaging Mmineral(x)min and Mmineral(x)max.
2.3.4. Chemical composition of U-Th-REE-Hf rich mineral grains
In order to improve the precision on elemental abundances compared to the grain counting step (section 1.3.2), multi-element spectra were acquired during 200 seconds at 15
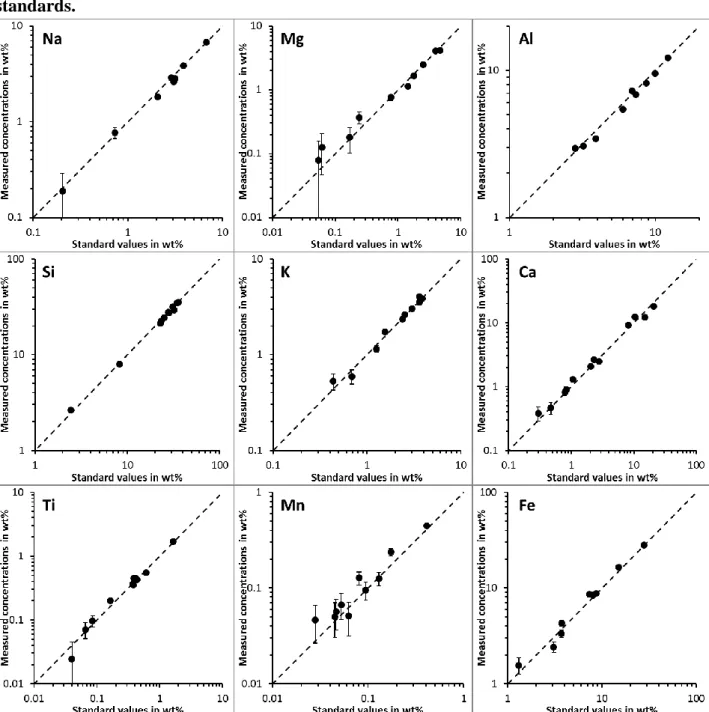
10 kV and 10,000 counts per second (beam diameter: 1 m) for mineral grains previously identified with the SEM/EDS-ACC system. This enabled quantitative analyses of major and minor elements simultaneously. Detection limits range from less than 0.1 wt% to 0.4 wt%, depending on the intensity and the energy of the measured element, as well as potential interferences (e.g., experimental detection limit are ~0.15 wt% for U and ~0.1 wt% for Th). Similar results are obtained on zircons comparing LA-ICPMS and SEM for REE (Halel et al., 2004). Comparable detection limits are reported for other REE-rich minerals (Sjöqvist et al., 2013). To demonstrate the capability of SEM/EDS to determine concentration at levels < 1%, we analyzed a set of USGS and IAEA certified standards by SEM/EDS (Fig. EA3a in the electronic appendix). Analyses were done on pressed powder pellets with a primary electron beam defocussed over a surface of 1mm*1mm. The concentrations measured by SEM/EDS agree within analytical uncertainties with certified values, including for elements at concentrations <1 wt% (K, Ca Mg, Mn and Ti). The calibration even holds for Mg, Mn and Ti that are present at concentration < 0.1 wt%. We did not measure the U, Th or REE concentrations of these standard materials because they are too low to be detected by SEM/EDS.
A few analyses were performed at 30 kV and 30,000 counts per second for 1600 seconds. This enabled the detection of high energy Sr, Y and Zr K lines as well as Hf, Th and U L lines and an improved detection limit.
Quantitative analyses are performed on grain mounts, not on polished sections. This may result in two types of analytical artifacts. 1) X-ray absorption and fluorescence effects on irregular-shaped grains are difficult to constrain. This may affect their correction and hence the estimation of the mineral elemental abundances. 2) Only the outermost part of the mineral
11 grain is analyzed, which may not reflect the composition of the whole grain. These analytical artifacts become significant only for crystals larger than 1-2 µm, which is close to the maximum penetration depth of the electron beam at 15 kV.
The impact of the “grain effects” on the data accuracy has been previously quantified on spinel by analyzing polished and unpolished grains up to a few microns (Robin and Molina, 2006). The lack of systematic compositional differences between both types of grains indicates that unpolished grain analysis provides reliable results.
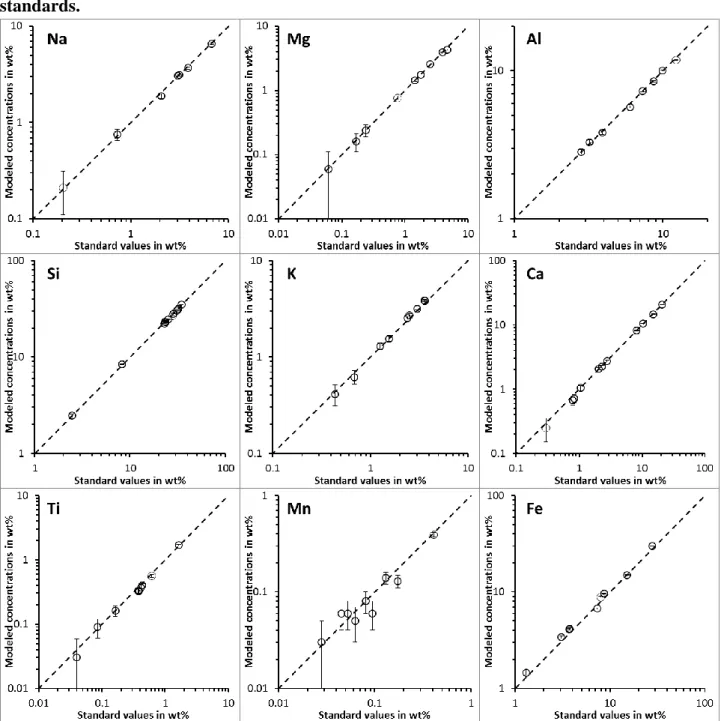
The “grain effect” for the analysis of single zircon grains can be modelled with the DTSA-II Monte Carlo model provided by the NIST (Ritchie, 2010). The model simulates the spectrum recorded by the EDS detector during the SEM analysis and it calculates the concentration of elements with the program used on our SEM/EDS system. There is no statistical difference between the “true” concentrations prescribed to the model and the concentration obtained with the modelled EDS spectrum of grains of different sizes (Fig. EA4 in the electronic appendix). The average value obtained with modelled analysis of grains is similar to the modelled concentration of a large polished zircon. To demonstrate the validity of this modelling approach, we compare modelled concentrations of the analysis of the certified standards previously analyzed (for real) by SEM/EDS (Fig. EA3b). Modelled and measured concentrations are statistically identical including for elements with concentration <0.1 wt%.
2.3.5. Contribution of U-Th-REE-Hf rich minerals to the bulk sediment composition
The fractional contribution of each U-Th-REE-Hf rich mineral to the bulk sediment concentrations is calculated from the abundance and mean mass of grains > 0.5 µm, according to the following equation (Robin et al., 2003):
12
total mass C C
C
fE E (4)
With fE the fractional contribution of a given mineral to the total concentration of
element E (wt%); CE the average concentration of element E (wt%) of a given mineral; Ctotal
the total concentration of element E (wt% or µg/g); Cmass the mass abundance of mineral
grains > 0.5 µm (µg/g).
The average concentration CE was determined in two ways: firstly by calculating the
mean of the individual concentrations and secondly by calculating the mean when grain concentrations are weighted by mass. The first method returns an average concentration dominated by the small grains that are far more numerous than the large ones. By contrast, the second method reflects the contribution of the larger grains. Clearly both methods will give the same results if all grains have equivalent concentrations. Otherwise, an average value is calculated separately for small and large grains.
3. Results
3.1. Composition of DYFAMED sediments
The composition of the DYFAMED sediments are given in electronic appendix (Tab. EA1). These sediments are a mixture of mainly detrital material, carbonates and sea salts. The large loss on ignition is due to the presence in each sample of about 40% of CaCO3 and of a
smaller proportion of sea salt, organic matter and water bound to clay minerals (Heiri et al., 2001, Barillé-Boyer et al., 2003). The organic matter content of the samples presented here was not measured, but it does not exceed ~2% of the total in DYFAMED sediments (Martín et al., 2009). The sediment heterogeneity can be estimated by the range of composition determined on the different layers sampled within the sediment core. Thus, in the following, we will propagate the variability of the sediment composition contribution of minerals to the
13 tracer concentration in the bulk sediment. Not surprisingly, Hf and Zr concentrations have the largest variability.
The Hf, Zr, REE, U and Th concentrations compare well with concentrations measured in carbonate-rich fine grained sediments from the Angola and Cape Basins in the South Atlantic Ocean (Bayon et al, 2009). Compared to Upper Continental Crust (UCC, Taylor and McLennan 1995), the REE pattern is relatively flat (La/Yb ≈ crustal ratio) with however a slight enrichment of the middle REE. The U/Th (U/Th ≈ 0.266) ratio is close to the crustal ratio (U/Th ≈ 0.261). In contrast, the Lu/Hf ratio of DYFAMED sediments (Lu/Hf ≈ 0.78-0.10) is higher than the crustal ratio (Lu/Hf = 0.55). The high Lu/Hf ratio and the Hf and Zr depletion compared to UCC (Fig. 2a) indicate that a large fraction of the zircons are missing and were most likely lost due to grain sorting during transport.
3.2. Composition of U-Th-REE-Hf rich minerals
The SEM/EDS-ACC system has identified five major carriers of U, Th and REE in DYFAMED sediments: zircon, xenotime, monazite, allanite and florencite. Apatite and Ti oxides (rutile), which are known as potential U-Th-LREE carriers (Laenen et al., 1997; Chu et al., 2009), are quite abundant in all investigated samples but U, Th and REE remain below detection limit, with the exception of one apatite grain showing detectable concentrations (> 0.5 wt%) of La, Ce, U and Th. Th-rich silicate (thorite) as well as U and Th oxides (uraninite, thorianite) were not detected. A total of 300 zircons, 41 xenotimes, 148 monazites, 67 allanites and 356 florencites were analyzed (Tab. 1). UCC normalized elemental abundances (Fig. 2b-f) are generally consistent with compositions previously reported for the same mineral phases in granite (Bea, 1996) and sandstones (Rasmussen et al., 1998).
Some REE were below the detection limit (e.g., LREE and Lu in zircon or HREE in monazite, allanite and florencite). Others were measured with a large uncertainty (e.g., Lu in
14 xenotime). In order to constrain the contribution of these “missing” REE to the global budget, we assumed that for each accessory mineral in the sediment, the REE profile has the same slope than the average profile of the same mineral in granites (Bea, 1996, see also Fig. 2) or in sandstone for florencite (Rasmussen et al., 1998). For example, we estimated the concentration of Lu in zircon as follow:
Lu estimated for DYFAMED zircon = Yb measured in DYFAMED zircon * (Lu/Yb)zircon in granite (5)
Numerical values of estimated elements are given in electronic appendix (Tab. EA2). These calculated concentrations are represented by empty circles on figure 2b to 2f.
Zircon (ZrSiO4)
Zircon is the most ubiquitous accessory mineral in granitoids showing a broad range of composition (Bea, 1996). At DYFAMED, zircon contains in average about 2 wt% Y and 1.3 wt% Hf with a small amount of REE (REE < 2 wt%), U and Th (0.2-0.5 wt%). The average REE concentration of the DYFAMED zircons is in the higher compositional range of granitoid zircons (Fig. 2b). HREE are enriched compared to LREE that remain below detection limit (< 0.1 wt%). Small zircons (< 5 µm) have significantly higher U and Th concentrations (U = 0.43 ± 0.09 wt% and Th = 0.48 ± 0.15 wt%) than large zircons (U = 0.20 ± 0.12 and Th = 0.27 ± 0.17 wt%), with a mean concentration for all grains of 0.38 ± 0.18 and 0.31 ± 0.13 wt% respectively. However, as stated in the analytical methods, EDS analysis reflects the composition of the grain surface (first µm) and not that of the whole grain. Whether the outer part only or the whole grains are depleted in U-Th is thus questionable. Note that compositional zoning which is common in zircon (Hoskin and Schaltegger, 2003) could account for the observed differences between small and large grains. Hereafter, we assume that zircons > 5 µm in diameter have lower U-Th concentrations than those < 5 µm. U and Th concentrations vary widely from one grain to another, not necessarily in the same
15 proportions, leading to a wide range of U/Th ratios (0.1 to > 3). However, in both size ranges, the average ratios are roughly equivalent, with a mean value for all grains of ≈ 0.8 ± 0.5. For grains with very low Th content, the uncertainty on the U/Th ratio is very large. A more accurate value of 0.95 ± 0.08 is obtained by considering only those grains having better than 30% precision on the U/Th ratio (≈ 20% of total grains analyzed). We note that only considering data with measurable Th content may lead to a bias of the if Th-rich and Th poor zircons have distinct U/Th ratios.
Xenotime (YPO4)
Xenotime composition at DYFAMED is in the range of compositions of granitoid xenotime (Fig. 2c), showing the same enrichment of HREE relative to LREE (REE ≈ 18 wt%; La/Yb ≈ 0.1 or 7×10⁻³
times the crustal ratio) and the same range of Zr, U, and Th concentrations. As for zircon, U and Th concentrations vary widely among the population of grains but no significant variation is observed with the particle size. On the average, U and Th concentrations are comparable to those measured for zircon (0.23 ± 0.08 and 0.44 ± 0.10 wt%, respectively) with a similar or even slightly higher U/Th ratio (≈ 2 ± 1 for all grains and 1.48 ± 0.15 for ≈ 20% of them, i.e., those whose precision on the U/Th ratio is better than 30%). Lu was not measured precisely. Therefore, in the following, we calculate the Lu concentration by using equation 5, the measured Yb concentration and the average Lu/Yb ratio given by Bea (1996). Using the Lu/Yb ratio of xenotimes analysed in granites, we assume that there was no fractionation between Lu and Yb during transport and weathering.
Monazite (REEPO4)
Monazite composition at DYFAMED is within the range of compositions of granitoid monazite with the exception of U and Th whose concentrations are significantly lower (Fig.
16 2d). No variation is observed with the particle size. Monazite has the highest concentrations of REE (REE ≈ 50 wt%) of all investigated carriers and strong enrichments of LREE relative to HREE. Its REE normalized pattern is flat with LREE concentrations equals to ≈ 3000 times the crustal concentration. Monazite has a distinctly higher Th content (2.47 ± 0.08 wt%) compared to the other phases and an U content (0.46 ± 0.13 wt%) similar to zircon and xenotime. The mean U/Th ratio is well constrained with a value of 0.19 ± 0.06 for all grains measured.
Allanite (Ca, REE)2(Al, Fe3+)3Si3O12(OH))
Allanite composition is within the range of compositions of granitoid allanite with the exception of Th whose concentration is distinctly lower (Fig. 2e). No variation is observed with the particle size. Allanite is the second most important REE carrier after monazite (REE ≈ 15 wt%). It is enriched in LREE relative to HREE with a flat LREE normalized pattern. Most of the grains (40-75 %) have U and Th content below the detection limit (average of 0.12 ± 0.09 wt% and 0.06 ± 0.05 wt%, respectively). As a consequence, the U/Th ratio is poorly constrained (≈ 2 ± 2 for all grains and ≈ 1.0 ± 0.8 with grains (≈ 10% of them) having U/Th ratio measured with an uncertainty better than 100%).
Florencite ((REE)Al3(PO4)2(OH)6)
Florencite is a minor, but ubiquitous, diagenetic mineral previously reported in marine sandstones (Rasmussen et al., 1998). Its composition at DYFAMED is similar to the composition of florencite in sandstones, with the exception of U and Th whose concentrations are distinctly higher (Fig. 2f). No variation is observed with the particle size. REE concentrations are comparable to those of allanite (REE ≈ 20 wt%) although with a distinctly higher enrichment of LREE over HREE. Sr and Ca are present as minor substitutes
17 of REE. Most of the grains (≈ 80%) have detectable Th concentrations (0.45 ± 0.11 wt%) but U remains close to the detection limit (0.15 ± 0.12 wt%). This results in a low and poorly constrained U/Th ratio of 0.34 ± 0.27 for all grains (0.33 ± 0.13 for ≈ 10% of them, i.e., those whose precision on the U/Th ratio is better than 50%).
3.3. Size distribution and mean mass of U-Th-REE-Hf rich crystals
Bulk samples, sieved and filtered size fractions as well as heavy mineral concentrates were used to define a typical cumulative size distribution for each type of mineral grains (Fig. 3). These samples allow characterizing different size fractions:
- Grain counting on bulk sample provide the absolute abundance and size distribution of the smallest grains (< 3 µm), which are far more numerous. Larger grains are too rare to have a significant probability to be detected in bulk samples.
- Grain counting on sieved and filtered size fractions (> 5 µm and > 25 µm) constrains the abundance of large grains. If no large grain is detected, it provides an upper limit to their abundance. Due to their scarcity and to the difficulty to achieve quantitative filtration/sieving on fine sediments, the size distribution of large particles remains poorly constrained by this method.
- Heavy mineral concentrates obtained by density separation provide strong constraints on the size distribution. This is best illustrated by comparing florencite and allanite. For these 2 minerals, no grain larger than 3 µm was detected on bulk counting and no grain larger than 5 µm was obtained by filtration for both minerals. In contrast, dense mineral countings reveals the occurrence of allanite grains as large as 15 µm, whereas no florencite grain larger than 5 µm was detected. Dense mineral counting support that there is a continuous size distribution between the small and the largest grains. However, the yield of the heavy liquid separation is unknown and so does not provide an absolute cumulative
18 size distribution. In addition, for particles < 2 µm, the slope of cumulative size distribution of the mineral concentrate is not as steep as the slope of cumulative size distribution of the bulk sample. This is because the density separation yield decreases rapidly for particles < 2.5 µm. Above 2.5 µm, the slopes of the 2 distributions become similar, indicating a constant yield of the mineral separation. Therefore, the cumulative size distribution of the heavy mineral concentrate was adjusted to obtain a good fitting between 3 µm and the largest filtered size fraction available.
The mean mass of each type of mineral grains (expressed in pg or 10-12 g), as well as the numerical and mass abundances of each type of mineral grains, are given in Table 2. No systematic variation of the particle abundance was observed between 0 and 5 cm in the sediment core (Fig. EA5 in the electronic appendix). Therefore, abundances reported here are average values of all analyzed samples.
Florencite is numerically the most abundant phase in the bulk sediment (5.3 ± 0.6 grain/µg) followed by zircon (2.9 ± 0.4 grain/µg) and monazite (1.1 ± 0.2 grain/µg). Allanite is relatively scarce (0.46 ± 0.07 grain/µg) and xenotime is particularly rare (0.13 ± 0.02 grain/µg). Even though florencite is one of the most numerically abundant phases, it has the lowest abundance in term of mass (17 ± 3 µg/g) since it appears as very small grains (< 5 µm in diameter) of low mean mass (3.2 ± 0.7 pg) which account for > 90% of the total mass. Monazite, allanite, and xenotime have higher mass abundances (25-31 µg/g), despite lower numerical abundances, because the size distributions extend to larger grains (> 5 µm), which are much more massive (mean mass ranging from 28 to 211 pg) than the small ones thus contributing largely to the total mass (70-95% of total contribution). Zircon is by far the most abundant phase in term of mass (166 ± 62 µg/g), due to a high numerical abundance of zircon
19 grains and to a high proportion of large grains in the 5-35 µm size range (the mass of a 24 µm zircon is of 23000 pg!).
For all the minerals mentioned above, we found grains in the 0.25-0.5 m range. These very small grains were not included in the cumulative size distribution, because their
detection is semi-quantitative. However, it stresses that accessory phases do occur as sub-micron grains.
3.4. Contribution of the U-Th-REE-Hf rich phases in DYFAMED sediments
The fractional contribution of each U-Th-REE-Hf rich mineral to the total concentrations of U, Th, REE and Hf in the bulk sediments is calculated using equation (4). These contributions vary strongly from an element to the other (Tab. 2, Fig. 4).
Zircon can account for the total budget of Zr (79 ± 32%) and Hf (78 ± 34%) in DYFAMED sediments. Due to its very low alterability, zircon is expected to be probably the only phase containing Zr in the sediment indeed (Poitrasson et al., 2002). Therefore, the high contribution of zircon to the Zr content supports the validity of the method proposed here to estimate the size and mass distributions of the minerals.
The high contribution of zircon and xenotime to the Y, HREE content of DYFAMED sediments are similar to those obtained in granites (Bea, 1996). These two minerals explain a large fraction of Y (73 ± 27%) and HREE. As a consequence of their REE patterns (Fig. 2), the contribution of zircon and xenotime increases from Gd to Lu (Fig. 4), explaining more than 80% of the total amount in sediments from Er to Lu (90 ± 37% for Lu).
20 By contrast, only a small fraction of the total U, Th and LREE is carried by the analyzed phases in DYFAMED (Tab. 2) while monazite and allanite contain always more than 50% and up to 90 % of the total LREE and Th in granites. Together with zircon, they also carry most of the U in granites.
In DYFAMED, zircon and xenotime account for only a few percent of the total Th (respectively 6.3 ± 5.5% and 0.8 ± 0.7%) and U (respectively 19 ± 16% and 6.0 ± 4.5%). Monazite only explained ≈ 7% of U, ≈ 10% of Th and ≈ 15% of LREE. Allanite contributes to ≈ 3-5% of the LREE and is a minor carrier for U and Th. Florencite also contains a small fraction of LREE, U and Th.
4. Discussion
4.1. Impact of weathering on U-Th-REE-Hf-rich phases
The detrital fraction of the DYFAMED sediments is made of Var River particles (and of Saharan dusts to a lesser extent) that are produced by erosion of a large variety of rocks (magmatic, metamorphic and sedimentary). Accessory U-Th-REE-Hf rich phases are considered to be very resistant to alteration (Morton and Hallsworth, 1999; Poitrasson et al., 2002; Moreno et al., 2006). However, U-Th-REE-Hf rich phases of granites can be substantially transformed during hydrothermal (Hecht and Cuney, 2000; Papoulis et al., 2004), metamorphic (Rasmussen and Muhling, 2009) and pedologic (Braun et al., 1998) processes. The comparison of the contribution of each mineral to the total trace element content of granites (crustal rocks) and marine sediments (end product of erosion) provides an integrated view of the weathering effect on these accessory minerals.
The very low alterability of zircon and xenotime can be deduced from their very high contribution (around 100%) to the Zr, Hf and Y inventories in both granites and marine
21 sediments and the similar levels of U, Th and HREE in zircons and xenotimes from DYFAMED sediments and magmatic rocks (Bea., 1996). It must be noted that the U, Th and HREE concentrations in zircons from the present study is on the high side of the values reported by Bea (1996) and much higher than the concentrations measured in large (~100 m) zircons by LA-MC-ICPMS or SIMS for U-Th-Pb dating or Lu-Hf studies (Yang et al., 2009), including zircons from the Argentera crystalline massif that is the likely source of zircons deposited at DYFAMED. High U-Th concentration in zircon can be due to their disequilibrium crystallization during the rise and final emplacement of the magma (Wang et al., 2011) and to zircon alteration (Žáček et al., 2006). As large zircons from the Argentera massif have generaly a low U and Th content, we speculate that small (~1 m) zircons are more prone and sensitive to alteration leading to their enrichment in U-Th. The case of HREE will be discussed in section 4.3..
In contrast, monazite and allanite contain most of U-Th-LREE in granites, but the contribution of these minerals to the total content of U, Th and LREE in marine sediments is rather low (~ 30%). The LREE contents of monazite and allanite normalized to the continental crust are identical in DYFAMED sediments and in granites, whereas the U and Th content of monazite and allanite normalized to the continental crust are depleted in DYFAMED compared to granites (Fig 2b). The low U and Th content of sedimentary monazite and allanite could be due to the preferential leaching of these elements with a possible enhancement of the alteration by metamictization, or just be related to the nature of the primary unaltered material only. Florencite, an alteration product of monazite in soils (Braun et al., 1998), is present in the DYFAMED sediments. It contains less than 5% of the LREE, U and Th of the sediment, so it cannot account for the “missing” U, Th and LREE that are not on monazite and allanite.
22 In granites, thorium silicates (thorite and huttonite, ThSiO4) contain ~10-40 % of the
total Th and uraninite (or more complex U minerals) can also be major U carrier. They were not detected in the DYFAMED sediments suggesting that they are completely lost during weathering. In the case of U, a preferential loss of large zircons during transport can also contribute to the low contribution of accessory minerals in the sediment (see section 4.2.) The loss of monazite and the uptake by other phases of the released elements can be illustrated by the good agreement between the bulk sediment and a mixture of the contribution of all the U-Th-REE-Hf rich phases with 165 µg/g of extra monazite in the detrital fraction (Fig. 5). The budget of all the trace elements is balanced except for U and Th (≈ 60% each element missing) that might have been carried by thorianite, thorite and uraninite in the pristine magmatic rock. Uraninite is not stable under oxic conditions (Finch and Ewing, 1992). While Th is known to be a relatively immobile element, thorite may be destabilized by metamictization (Berger et al., 2009) and organic ligands can induce thorite and thorianite solubility (Braun et al., 1998).
The question of the nature of the phase(s) bearing the 60-80% of Th, U and LREE not located in U-Th-REE-Hf rich phases remains. U, Th and LREE may be present at low concentrations in other phases. Apatite and Ti oxides are abundant in DYFAMED sediment, but in these minerals, U, Th or REE were below detection limit. To put an upper bound on the contribution of these phases, we assumed that all phosphorus (P) in the sample was in apatite (4000 µg/g of apatite) and all titanium (Ti) was in rutile (3000 µg/g). Using an average Th concentration of 50 µg/g in apatite (Laenen et al., 1997; Chu et al., 2009) and a few µg/g in rutile, we obtain only a contribution of 2% of the total Th. Similar conclusions are obtained for U. As for Nd, apatite REE patterns and concentrations vary strongly depending on the origin of the mineral (lithogenic or authigenic). However, apatite can contribute to up to 20%
23 of the LREE but never balanced totally the budget. Therefore, U, Th and LREE must be present at low concentrations in other phases such as clay mineral, Mn or Fe oxides, or organic matter (Tachikawa et al., 2013).
4.2. Implication for U/Th/REE behavior in sediments
The different size distribution of U and Th bearing minerals could explain the U/Th fractionation observed in the marine particles collected in the DYFAMED sediment traps compared to UCC (Roy-Barman et al., 2009). U is significantly carried by large zircons and xenotimes with high U/Th ratios, whereas Th is carried by smaller phases such as monazite, florencite (and possibly clays, Fe oxides…) with a lower U/Th ratio. Grain sorting during the transport of dust by wind or of particles by currents will tend to remove preferentially the phases with high U/Th ratios, producing sediments with U/Th ratios lower than the average continental crust.
The present study confirms that the lack of correlation between Zr-Hf and Th-LREE often observed in riverine and marine sediments (McLennan et al., 1990; Bouchez et al., 2011) is due to the relatively small fraction of Th and LREE associated to large accessory minerals, whereas Zr and Hf are carried by zircon. Previous studies suggested that the HREE budget in shales is controlled by both zircon and an undetermined refractory phase (McLennan et al., 1980; Gromet et al., 1984). Here, we clearly identify this phase as xenotime. Fractionation between LREE and HREE resulting from grain sorting during sediment transport could alter the REE pattern. Preferential loss of large zircons and xenotimes would decrease the LREE/HREE ratio of the fine sediments.
Until now, it was not clear if Th and LREE were carried by small abraded accessory grain or if they were redistributed on other phases such as clay or organic matter (Patchett et al., 1984). Here, we clearly demonstrate that small accessory minerals contain only a small
24 fraction of the sediment Th and LREE, implying that the remaining fraction must have been chemically redistributed on other phases. More generally, there seems difficult to define a single “best” lithogenic tracer (Chase and Anderson, 2004; Luo and Ku, 2004), as each of them will have particular carriers with particular size distribution.
Dissolution of lithogenic elements occurs in the Mediterranean Sea, most likely at its margins (Henry et al., 1994; Roy-Barman et al., 2002; Tachikawa et al., 2004). Together with the enhanced scavenging of insoluble elements at ocean margin, it leads to “boundary exchange”, a process still poorly understood (Lacan and Jeandel, 2005; Roy-Barman, 2009). We show that only a limited fraction (20%, Tab. 2) of Th and Nd are locked in very insoluble accessory minerals such as zircon and monazite. This is a very different situation compared to Hf (see section 3.5). It has been suggested that phosphate precipitates control the REE solubility in seawater (Byrne and Kim, 1993). While phosphate minerals (monazite, florencite or apatite) are present in the DYFAMED sediments, they contain only a small fraction of the LREE present in the bulk sediment.
4.3. Implication for Lu-Hf systematics
Hf and Nd isotopic compositions of most terrestrial rocks display a broad correlation, called the “terrestrial array” because the Lu-Hf and Sm-Nd isotopic systems behave similarly during magmatic processes within the Earth’s lithosphere (Vervoort et al., 1999). Surprisingly, seawater and Fe-Mn nodules also plot on a well-defined correlation, but with a clear offset towards radiogenic Hf signature compared to the terrestrial array (Patchett et al., 1984; Albarede et al., 1998; Rickli et al., 2010). This offset is explained by incongruent erosion of the continental crust. Zircons have high Hf concentration but low Lu concentration. Because zircons are highly resistant to physical and chemical erosion, they store large
25 quantities of unradiogenic Hf, while other phases with higher Lu/Hf ratios are more readily dissolved and deliver more radiogenic Hf to the ocean (Bayon et al., 2006). Ultimately, zircons are thought to be deposited in coarse sediments (sands) plotting on a “zircon-bearing sediment array” with slightly less radiogenic Hf signature than the terrestrial array. Sands have low Lu/Hf ratios (< 0.65) and generally high Hf contents (> 5 µg/g). Finer sediments (“muds”) are depleted in zircon and Hf and plot along a “zircon free sediment” array that is intermediate between the seawater and the terrestrial arrays. Muds have high Lu/Hf ratio (> 0.65) and generally low Hf content (< 5 µg/g). While zircons are known to be concentrated in sands, their presence/absence in marine muds had not been directly checked until now and no other potential carrier has been identified for Zr and Hf in muds.
Here, the low Hf content (≈ 2.3-3.2 µg/g) in the bulk sample, comparable to values reported by Bayon et al. 2009, for fine grained sediments of the Angola and Cape basins and high Lu/Hf ratio (Lu/Hf = 0.10) of DYFAMED sediments place them clearly in the “zircon-free” fine grained sediments represented by the distal turbiditic muds of the Congo and Angola basins (Bayon et al., 2009). Nevertheless, at least 47% of (if not all) the Zr content of DYFAMED sediment is due to zircons of different sizes (see section 3.1). Even the fine grain fraction contains sub-micron to micron size zircons (Fig. 3) as suggested previously (Pettke et al., 2002; Rickli et al., 2010). It suggests that the so called “zircon-free” sediments are rather “zircon-depleted” by differential loss of the largest zircons (Fig. 2a), but that the remaining Zr and Hf is still significantly carried by small zircons. This would imply a low solubility Hf even in the fine sediments.
Lu was not measured precisely in zircons but we can estimate its concentration to 0.06 ± 0.02% based on the Yb content of DYFAMED zircons and the average Lu/Yb ratio of zircons determined by Bea (1996) (equation 5). It yields an average 176Lu/177Hf ratio of ~0.00648 in zircons, which is one order of magnitude higher than the signature of global
26 fluvial zircons measured using LA-ICP-MS (averaged at ~0.00056 e.g., Chen et al., 2011) or bulk analysis of zircon collected in placer deposit of the Rhone River that erodes similar lithology than the Var River (Garçon et al., 2011). Saharan zircons have an average higher
176
Lu/177Hf ratio (~ 0.0016, Avigad et al, 2012) but still below our average value.
The reason for these high HREE concentrations is unclear. Zircons can contain xenotime inclusions (Barbey et al, 1995) or in solid solution (Förster, 2006) and xenotime overgrowth on zircons are common (Drost et al., 2013). Zircons and zircon-xenotime intermediates containing up to 0.2-0.4% of Lu have been described (Bea, 1996, Hoshino et al., 2012). One possibility could be that SEM analyses highlight the presence of HREE-rich xenotime overgrowth on micron-size zircons (the electron penetration depth is of the order of 1-2 m), whereas laser ablation analysis (used for Lu-Hf systematics in zircons) samples mostly the core of large polished zircons. The occurrence of xenotime overgrowth is supported by the high Y content (≈ 2 wt%) of the zircons analyzed in the present study compared to Bea (1996). If it is due to xenotime overgrowth, the 2 wt% of Y should be associated to 1 wt% of Phosphorus (P). The presence of P in zircon could not be confirmed, because there is a major interference of Zr on P with the SEM/EDS method. Nevertheless, we note that the Yb/Y ratio in zircons (Yb/Y = 0.14 ± 0.5) is not significantly different from the the Yb/Y ratio in xenotimes (Yb/Y = 0.86 ± 0.04). It supports the idea that the high HREE content of microns size-zircons are due to xenotime overgrowths. In any case, the high contribution of zircons to the Lu budget is not a general features applicable to other locations or to large zircons.
An important finding is that a large fraction of Lu (based on the Yb content to obtain a better precision, see result section) in the sediment is carried by xenotime (51 ± 26%, Tab. 2). Xenotime is a well-known Lu-rich and Hf-poor phase (Bea, 1996; Scherer et al., 2001), but
27 until now it had not been considered as a significant Lu and radiogenic Hf carrier in marine sediments (Bayon et al., 2006, 2009). The uncertainty on the total Lu budget leaves open the possibility that some Lu may be present in other phases such as Fe oxides or apatite (Bayon et al., 2006, 2009). Nevertheless, since xenotime is considered as a rather insoluble accessory mineral, it could act as a “trap” for radiogenic Hf.
28 Conclusion
By the systematic determination of their size distributions and compositions, we have established the first quantitative inventory of the contribution of accessory U-Th-REE-Hf rich phases to the total content of U, Th, REE and Hf in deep sea sediments. Using an automated SEM, we were able to analyze very small grains (our primary goal) but with a somewhat high detection limit. Further developments will be necessary to fully characterize minute accessory minerals. Although the association between Zr, Hf and zircon is well established in crustal rocks, Lu-Hf systematics in the ocean somewhat challenged this view with putative “zircon-free” sediments. The present study shows that zircon remains a significant (if not the only) Zr-Hf carrier in fine deep sea sediments because it occurs as very fine grains. Similarly, xenotime is a well-known HREE-rich mineral, but until now its role as a major Lu carrier had not been taken into account in the Lu-Hf budgets of marine sediments. By contrast, only a limited fraction of U, Th and LREE is stored in accessory minerals due to the easier alteration of monazite and allanite compared to zircon and xenotime. The remaining LREE seems to be stored in phases with “monazite like” REE pattern, suggesting that only a limited Sm/Nd fractionation occurs within the sediment. By establishing the role of heavy minerals in U-Th-REE-Hf budgets in marine sediments, this work is a step towards the determination of all (lithogenic and authigenic) U-Th-REE-Hf carriers in marine sediments and marine particles.
29 Acknowledgment
We thank L. Guidi for providing the DYFAMED sedimentsamples. We thank I. Lefèvre for her technical support. We thank the two anonymous reviewers for their critical and detailed comments on the manuscript that significantly improved the paper. We also wish to thank Martin Frank for stimulating discussions on the Lu-Hf systematics in zircons. This study was funded by the CYcles Bioge´ochimiques-Environment-Ressources French research program (CYBER– INSU) and by Institut Pierre Simon Laplace to MRB. SM acknowledges Ecole Doctorale d’Environnement d’Ile de France for her PhD scholarship. This is LSCE contribution number 5238.
30 Figure caption
Fig. 1: Sample location.
Fig. 2: Elemental compositions normalized to UCC. a) Range of composition of DYFAMED bulk sediments; b-f) U-Th-REE-Hf rich minerals. Numbers of analyzed grains are given in parentheses. For elements below detection limit in a mineral, we assumed that the REE profile of this mineral in the sediment has the same slope than the profile of the same mineral in granites (Bea, 1996). We then used the concentration of the most abundant REE to extrapolate the concentration of least abundant REE (see text for details). These estimated concentrations are represented by empty circles. Extreme enrichment compared to the UCC are obtained for some REE when they are major elements of the accessory minerals. UCC data are from Taylor and McLennan 1995. The grey areas represent the range observed in similar minerals analyzed in granitoids (zircon, monazite, allanite and xenotime from Bea, 1996) and sandstones (Florencite from Rasmussen, 1996).
Fig. 3: Cumulative size distributions of U-Th-REE-Hf rich minerals. Concentrations are reported with 1σ error bars. When no grains were found in the large fractions, an upper limit, indicated by the arrowed tick mark, was set by considering the concentration obtained if one grain had been found in the filtered sample.
Fig. 4: Average contribution of U-Th-REE-Hf rich minerals to the sediment. For each element, the total percentage of contribution of all accessory minerals to the sediment content is calculated (Tab. 2). When some REE were below detection limit in a mineral, its contribution was estimated using the closest measured REE and the REE patterns obtained in
31 the literature (See electronic appendix A2). The error bar represents the uncertainty on the total contribution of accessory minerals and it includes the uncertainty on the bulk sample composition.
Fig. 5: Contribution of U-Th-REE-Hf rich minerals to the sediment normalized to UCC. The curve with open symbols corresponds to the spidergram of the bulk sediment normalized to the UCC. The curve with black symbols “contribution of U-Th-REE-Hf-rich minerals” is calculated by summing the contribution (normalized to UCC) of all accessory minerals to the trace element content of the bulk sample (see Tab. 2). The curve with grey symbols “contribution of U-Th-REE-Hf-rich minerals + 165 g/g of monazite” is obtained by adding the contribution of 165 g of monazite per g of sample to the contribution calculated for the previous curve.
32 References
Albarede, F., Simonetti, A., Vervoort, J.D., Blichert-Toft, J., Abouchami, W., 1998. A Hf-Nd isotopic correlation in ferromanganese nodules. Geophysical Research Letters 25, 3895– 3898.
Avigad, D., Gerdes, A., Morag, N. and Bechstädt, T., 2012. Coupled U–Pb–Hf of detrital zircons of Cambrian sandstones from Morocco and Sardinia: Implications for
provenance and Precambrian crustal evolution of North Africa Gondwana Research 21, 690–703.
Barillé-Boyer, A.-L., L. Barillé, H. Massé, D. Razet, and M. Héral (2003), Correction for particulate organic matter as estimated by loss on ignition in estuarine ecosystems, Estuarine Coastal Shelf Sci., 58, 147– 153.
Bayon, G., Burton, K.W., Soulet, G., Vigier, N., Dennielou, B., Etoubleau, J., Ponzevera, E., German, C.R., Nesbitt, R.W., 2009. Hf and Nd isotopes in marine sediments: Constraints on global silicate weathering. Earth and Planetary Science Letters 277, 318-326.
Bayon, G., Vigier, N., Burton, K.W., Jean Carignan, A.B., Etoubleau, J., Chu, N.-C., 2006. The control of weathering processes on riverine and seawater hafnium isotope ratios. Geology 34, 433-436.
Bea, F., 1996. Residence of REE, Y, Th and U in Granites and Crustal Protoliths; Implications for the Chemistry of Crustal Melts. Journal of Petrology 37, 521-552. Berger, A., Gnos, E., Janots, E., Fernandez, A., Giese, J., 2008. Formation and composition of
rhabdophane, bastnäsite and hydrated thorium minerals during alteration: Implications for geochronology and low-temperature processes. Chemical Geology 254, 238 – 248. Bouchez, J., Gaillardet, J., France-Lanord, C., Maurice, L., Dutra-Maia, P., 2011. Grain size
control of river suspended sediment geochemistry: Clues from Amazon River depth profiles. Geochemistry Geophysics Geosystems 12, 1-24.
Braun, J.J., Viers, J., Dupré, B., Polve, M., Ndam, J., Muller, J.P., 1998. Solid/liquid REE fractionation in the lateritic system of Goyoum, East Cameroon: The implication for the present dynamics of the soil covers of the humid tropical regions. Geochimica et
Cosmochimica Acta 62, 273–299.
Byrne, R.H., Kim, K.-H., 1993. Rare earth precipitation and coprecipitation behavior: The limiting role of PO43-on dissolved rare earth concentrations in seawater. Geochimica et Cosmochimica Acta 57, 519–526.
Carignan J, Hild P, Mevelle G, Morel J, Yeghicheyan D. (2001) Routine Analyses of Trace Elements in Geological Samples using Flow Injection and Low Pressure On-Line Liquid Chromatopgraphy Coupled to ICP-MS: A study of Geochemical Reference Materials BR, DR-N, AN-G and GH. Geostand Newsl 25,187–198.
33 Chase, Z., Anderson, R.F., 2004. Comment on “On the importance of opal, carbonate, and
lithogenic clays in scavenging and fractionating 230Th, 231Pa and 10Be in the ocean” by S. Luo and T.-L. Ku. Earth and Planetary Science Letters 220, 213-222.
Chen, T.-Y., Ling, H.-F., Frank, M., Zhao, K.-D., Jiang, S.-Y., 2011. Zircon effect alone insufficient to generate seawater Nd-Hf isotope relationships. Geochemistry Geophysics Geosystems 12, 1-9.
Chu, M.-F., Wang, K.-L., Griffin, W.L., Chung, S.-L., O’Reilly, S.Y., Pearson, N.J., Iizuka, Y., 2009. Apatite Composition: Tracing Petrogenetic Processes in Transhimalayan Granitoids. Journal of Petrology 50, 1829-1855.
Drost, K., Wirth, R., Košler, J. Jørgensen, H.F. and Ntaflos, T., 2013. Chemical and structural relations of epitaxial xenotime and zircon substratum in sedimentary and hydrothermal environments: a TEM study. Contrib. Mineral. Petrol.165, 737-756.
Féraud, G., Potot, C., Fabretti, J.-F., Guglielmi, Y., Fiquet, M., Barci, V., Maria P.-C., 2009. Trace elements as geochemical markers for surface waters and groundwaters of the Var River catchment (Alpes Maritimes, France). Comptes-Rendus Chimie. 12, 922-932. Firdaus, M.L., Minami, T., Norisuye, K., Sohrin, Y., 2011. Strong elemental fractionation of
Zr–Hf and Nb–Ta across the Pacific Ocean. Nat. Geosci. 4, 227–230.
Finch, R.J., Ewing, R.C., 1992. The corrosion of uraninite under oxidizing conditions. J. Nucl. Mater. 190, 133–156.
van de Flierdt, T., Goldstein, S.L., Hemming, S.R., Roy, M., Frank, M., Halliday, A.N., 2007. Global neodymium–hafnium isotope systematics — revisited. Earth and Planetary Science Letters 259, 432-441.
Förster HJ (2006) Composition and origin of intermediate solid solutions in the system thorite–xenotime–zircon–coffinite. Lithos 88: 35–55
Garçon, M., Chauvel, C., Bureau, S., 2011. Beach placer, a proxy for the average Nd and Hf isotopic composition of a continental area. Chemical Geology 287, 182-192.
Gehlen, M., Rabouille, C., Ezat, U., Guidi-Guilvard, L.D., 1997. Drastic changes in deep-sea sediment porewater composition induced by episodic input of organic matter. Limnology and Oceanography 42, 980–986.
Gromet, L.P., Dymek, R.F., Haskin, L.A., Korotev, R.L., 1984. The “North American shale composite”: Its compilation, major and trace element characteristics. Geochimica et Cosmochimica Acta 48, 2469-2482.
Guerzoni, S., Chester, R., Dulac, F., Herut, B., Loÿe-Pilot, M.-D., Measures, C., Migon, C., Molinaroli, E., Moulin, C., Rossini, P., Saydam, C., Soudine, A., Ziveri, P., 1999. The role of atmospheric deposition in the biogeochemistry of the Mediterranean Sea. Progress In Oceanography 44, 147-190.
34 Guieu, C., Chester, R., Nimmo, M., Martin, J.-M., Guerzoni, S., Nicolas, E., Mateu, J., Keyse,
S., 1997. Atmospheric input of dissolved and particulate metals to the northwestern Mediterranean. Deep Sea Research Part II: Topical Studies in Oceanography 44, 655– 674.
Hecht, L., Cuney, M., 2000. Hydrothermal alteration of monazite in the Precambrian crystalline basement of the Athabasca Basin (Saskatchewan, Canada): Implications for the formation of unconformity-related uranium deposits. Mineralium Deposita 35, 791– 795.
Heiri, O., Lotter, A.F., Lemcke, G. (2001). Loss-on-ignition as a method for estimating organic and carbonate content in sediments: reproducibility and comparability of results. Journal of Paleolimnology 25, 101-110.
Helal A.I., Zahran N.F., Mohamed R.A., Mohsen H.T., Becker J.S., Kobzev A.P., Hashad A.H., 2002. Trace elements analyses of zircon sample by integration of the LA-ICP-MS, EDS and RBS methods, Int. J. Mass Spectrom. 221, 139–146.
Henderson, G.M., Anderson, R.F., 2003. The U-series Toolbox for Paleoceanography, in: Bourdon, B., Henderson, G.M., Lundstrom, C.C., Turner, S.P. (Eds.), Uranium-series Geochemistry. Reviews in Mineralogy and Geochemistry, pp. 493-531.
Henry, F., Jeandel, C., Dupré, B., Minster, J.-F., 1994. Particulate and dissolved Nd in the western Mediterranean Sea: sources, fate and budget. Marine chemistry 45, 283–305. Hermann, J., 2002. Allanite: thorium and light rare earth element carrier in subducted crust.
Chemical Geology 192, 289 - 306.
Hoshino, M., Watanabe, Y., Sanematsu, K., Kon, Y. and Shimizu, M., 2012. Characteristics of zircon suitable for REE extraction. Int. Journ. Min. Process. 102-103, 130–135. Hoskin, P.W.O., Schaltegger, U., 2003. The Composition of Zircon and Igneous and
Metamorphic Petrogenesis. Reviews in Mineralogy and Geochemistry 53, 27-62. Lacan, F., Jeandel, C., 2005. Neodymium isotopes as a new tool for quantifying exchange
fluxes at the continent–ocean interface. Earth and Planetary Science Letters 232, 245-257.
Laenen, B., Hertogen, J., Vandenberghe, N., 1997. The variation of the trace-element content of fossil biogenic apatite through eustatic sea-level cycles. Palaeogeography,
Palaeoclimatology, Palaeoecology 132, 325–342.
Luo, S., Ku, T.-L., 2004. On the importance of opal, carbonate, and lithogenic clays in scavenging and fractionating 230Th, 231Pa and 10Be in the ocean. Earth and Planetary Science Letters 220, 201-211.
Martín, J., Sanchez-Cabeza, J.A., Eriksson, M., Levy, I., Miquel, J.-C., 2009. Recent accumulation of trace metals in sediments at the DYFAMED site (Northwestern Mediterranean Sea). Marine pollution bulletin 59, 146-53.
35 McLennan, S.M., Nance, W.B., Taylor, S.R., 1980. Rare earth element-thorium correlations
in sedimentary rocks, and the composition of the continental crust. Geochimica et Cosmochimica Acta 44, 1833-1839.
McLennan, S.M., Taylor, S.R., McCulloch, M.T., Maynard, J.B., 1990. Geochemical and Nd-Sr isotopic composition of deep sea turbidites: Crustal evolution and plate tectonic associations. Geochimica et Cosmochimica Acta 54, 2015-2050.
Marmolejo-Rodriguez, A.J., Caetano, M., Prego, R, Vale, C. 2008. Thorium accumulation in the sedimentary environment of the Vigo Ria (NW Iberian Peninsula). Journal of Environmental Radioactivity 99, 1631–1635.
Migeon, S., Mulder, T., Savoye, B., Sage, F., 2006. The Var turbidite system (Ligurian Sea, northwestern Mediterranean)—morphology, sediment supply, construction of turbidite levee and sediment waves: implications for hydrocarbon reservoirs. Geo-Marine Letters 26, 361-371.
Miquel, J. C., Martin, J., Gasser, B., Rodriguez-y-Baena, A., Toubal, T., and Fowler, S. W. , 2011. Dynamics of particle flux and carbon export in the northwestern Mediterranean Sea: a two decade time-series study at the DYFAMED site, Prog. Oceanogr., 91, 461– 481.
Moreno, T., Querol, X., Castillo, S., Alastuey, A., Cuevas, E., Herrmann, L., Mounkaila, M., Elvira, J., Gibbons, W., 2006. Geochemical variations in aeolian mineral particles from the Sahara-Sahel Dust Corridor. Chemosphere 65, 261-70.
Morton, A.C., Hallsworth, C.R., 1999. Processes controlling the composition of heavy mineral assemblages in sandstones. Sedimentary Geology 124, 3-29.
Papoulis, D., Tsolis-Katagas, P., Katagas, C., 2004. Monazite alteration mechanisms and depletion measurements in kaolins. Applied Clay Science 24, 271-285.
Patchett, P., White, W., Feldmann, H., Kielinczuk, S., Hofmann, A., 1984. Hafnium/rare earth element fractionation in the sedimentary system and crustal recycling into the Earth’s mantle. Earth and Planetary Science Letters 69, 365–378.
Pettke, T., Lee, D., Halliday, A., 2002. Radiogenic Hf isotopic compositions of continental eolian dust from Asia, its variability and its implications for seawater Hf. Earth and Planetary Science 202, 453-464.
Poitrasson, F., Hanchar, J.M., Schaltegger, U., 2002. The current state and future of accessory mineral research. Geology 191, 3 - 24.
Rasmussen, B., 1996. Early diagenetic REE-phosphate minerals (florencite, gorceixite, crandallite, and xenotime) in marine sandstones: a major sink for oceanic phosphorus. American Journal of Science 296, 601–632.
Rasmussen, B., Buick, R., Taylor, W.R., 1998. Removal of oceanic REE by authigenic precipitation of phosphatic minerals. Earth and Planetary Science Letters 164, 135-149.
36 Rasmussen, B., Muhling, J.R., 2009. Reactions destroying detrital monazite in
greenschist-facies sandstones from the Witwatersrand basin, South Africa. Chemical Geology 264, 311-327.
Rickli, J., Frank, M., Baker, A.R., Aciego, S., de Souza, G., Georg, R.B., Halliday, A.N., 2010. Hafnium and neodymium isotopes in surface waters of the eastern Atlantic Ocean: Implications for sources and inputs of trace metals to the ocean. Geochimica et
Cosmochimica Acta 74, 540-557.
Ritchie, N.W.M., 2010. Using DTSA-II to Simulate and Interpret Energy Dispersive Spectra from Particles. Microsc. Microanal. 16, 248–258.
Robin E. and Molina, 2006. Chronostratigraphy, composition, and origin of Ni-rich spinel from the Late Eocene Fuente Caldera section in Spain: one impact or more. Meteor Planet Sci 41, 1231–1248
Robin, E., Rabouille, C., Martinez, G., Lefevre, I., Reyss, J.-L., Van Beek, P., Jeandel, C., 2003. Direct barite determination using SEM/EDS-ACC system: implication for constraining barium carriers and barite preservation in marine sediments. Marine Chemistry 82, 289–306.
Roy-Barman, M., 2009. Modelling the effect of boundary scavenging on Thorium and Protactinium profiles in the ocean. Biogeosciences 6, 3091-3107.
Roy-Barman, M., Coppola, L., Souhaut, M., 2002. Thorium isotopes in the western Mediterranean Sea: an insight into the marine particle dynamics. Earth and Planetary Science Letters 196, 161-174.
Roy-Barman, M., Lemaître, C., Ayrault, S., Jeandel, C., Souhaut, M., Miquel, J.-C., 2009. The influence of particle composition on Thorium scavenging in the Mediterranean Sea. Earth and Planetary Science Letters 286, 526-534.
Rubatto, D., Schaltegger, U., Lombardo, B., Colombo, F., Compagnoni, R., 2001. Complex Paleozoic magmatic and metamorphic evolution in the Argentera massif (Western Alps), resolved with U-Pb dating. Schweizerische mineralogische und petrographische
Mitteilungen 81, 213-228.
Scherer, E., Munker, C., Mezger, K., 2001. Calibration of the lutetium-hafnium clock. Science (New York, N.Y.) 293, 683-7.
Schmidt, S., Reyss, J.-L., 1996. Radium as internal tracer of Mediterranean Outflow Water. Journal of geophysical research 101, 3589–3596.
Sholkovitz, E.R., Elderfield, H., Szymczak, R., Casey, K., 1999. Island weathering: river sources of rare earth elements to the Western Pacific Ocean. Marine Chemistry 68, 39-57.