HAL Id: hal-02326609
https://hal.archives-ouvertes.fr/hal-02326609
Submitted on 31 Oct 2019
HAL is a multi-disciplinary open access archive for the deposit and dissemination of sci-entific research documents, whether they are pub-lished or not. The documents may come from teaching and research institutions in France or abroad, or from public or private research centers.
L’archive ouverte pluridisciplinaire HAL, est destinée au dépôt et à la diffusion de documents scientifiques de niveau recherche, publiés ou non, émanant des établissements d’enseignement et de recherche français ou étrangers, des laboratoires publics ou privés.
Deposition process of Si–B–C ceramics from
CH3SiCl3/BCl3/H2 precursor
Jérôme Berjonneau, Georges Chollon, Francis Langlais
To cite this version:
Jérôme Berjonneau, Georges Chollon, Francis Langlais. Deposition process of Si–B–C ceramics from CH3SiCl3/BCl3/H2 precursor. Thin Solid Films, Elsevier, 2008, 516 (10), pp.2848-2857. �10.1016/j.tsf.2007.05.038�. �hal-02326609�
Available at: https://doi.org/10.1016/j.tsf.2007.05.038
DEPOSITION PROCESS OF Si-B-C CERAMICS FROM MTS/BCl3/H2 PRECURSOR
J. Berjonneau, G. Chollon*, F. Langlais
Laboratoire des Composites Thermostructuraux, UMR 5801 (CNRS-SNECMA-CEA-UB1), Université Bordeaux 1, 3 allée de La Boétie, 33600 Pessac, France
ABSTRACT
Si-B-C coatings have been prepared by chemical vapour deposition (CVD) from
CH3SiCl3/BCl3/H2 precursor mixtures at low temperature (800-1050°C) and reduced pressures (2, 5,
12 kPa). The kinetics (including apparent activation energy and reaction orders) related to the deposition process were determined within the regime controlled by chemical reactions. A wide range of coatings, prepared in various CVD conditions, were characterized in terms of morphology (scanning electron microscopy), structure (transmission electron microscopy, Raman spectroscopy) and elemental composition (Auger electron spectroscopy). On the basis of an in-situ gas phase analysis by Fourier transform infrared spectroscopy and in agreement with a previous study on the
B-C system, the HBCl2 species was identified as an effective precursor of the boron element.
HxSiCl(4-x), SiCl4 and CH4, derived from MTS, were also shown to be involved in the homogeneous
and the heterogeneous reactions generating silicon and carbon in the coating. A correlation between the various experimental approaches has supported a discussion on the chemical steps involved in the deposition process.
Key words: Si-B-C Ceramics; Carbides; Chemical vapour deposition (CVD); Kinetics; Gas phase
analysis; Structural properties; Chemical composition; Growth mechanism
1 INTRODUCTION
Multilayered Si-B-C matrices have been developed to improve the high temperature durability of SiC-based ceramic matrix composites (CMC’s) [1-3]. The corrosion resistance of Si-B-C ceramics is indeed related to the composition of the borosilicate glass produced by oxidation and is therefore directly controlled by the B/Si atomic ratio in the starting material. Si-B-C ceramics can be deposited within fibrous preforms by chemical vapour infiltration (CVI), using for instance
BCl3-MTS-H2 as the gas precursor mixture (MTS is for methyltrichlorosilane, CH3SiCl3). The CVI
process requires a hot-wall reactor operating at low temperature and reduced pressure, in order to promote the mass transfer with respect to chemical reaction rates [4]. Except for the work of Goujard et al., very few studies on the chemical vapour deposition (CVD) in the Si-B-C-H system have been carried out in such conditions [1-3, 5-7]. These authors proposed a dual thermodynamic/experimental approach with the aim of developing oxidation protective outer-coating for CMC’s [2, 5-6]. However, only limited kinetic data and basic knowledge on the chemical reactions involved in the CVI process have been reported yet.
For the CVD from the BCl3-MTS-H2 system, the composition of the initial gas mixture is
generally defined by the two parameters =xH2/xMTS and =xMTS/xBCl3 (where xi are the initial mole
numbers). In their thermodynamic study of the heterogeneous equilibrium, Goujard et al.
investigated the influence of a wide variation of both the and parameters on the composition of
the solid. These authors evidenced a specific domain (10<<40; 0.6<<8) yielding desirable phase
compositions in terms of oxidation resistance (SiC+BxC with x4, or SiC+B4C+C). This domain
was particularly explored during the experimental CVD study (Fig. 1). When the CVD conditions were close to the thermodynamic equilibrium, i.e., within the mass transfer regime (high temperature and low total flow rate), the coatings displayed a poor homogeneity in thickness and composition along the substrate. A better uniformity of the coatings was obtained when the kinetics
was controlled by chemical reactions. This was achieved by decreasing the temperature (T927°C),
increasing the flow rate and when 1, i.e., for coatings with boron-rich compositions.
The CVI process is more demanding than standard CVD in terms of optimization of the experimental parameters. It indeed requires an effective mass transfer of the reactants through the porous preform and sufficiently low chemical reaction rates. The experimental temperature and pressure ranges explored by Goujard et al. [6] or Golda and Gallois [7] are still relatively high for an homogeneous CVI of Si-B-C ceramics (e.g., P=40 and 33 kPa, respectively). Furthermore, the data obtained by these authors are incomplete to satisfactorily characterize the kinetic laws of the
CVD growth rate (the activation energies and the reaction partial orders, particularly, were not determined) and the homogeneous reactions involved in the process.
With a view to better control the CVI process of Si-B-C matrices and to collect data for a future overall modelling, an investigation of the various chemical mechanisms is proposed in the present contribution, through three complementary experimental routes: (i) the kinetic data measurement, (ii) the in situ Fourier transform infrared (FTIR) spectroscopy gas phase analysis and (iii) the chemical and structural characterization of the coatings. A correlation between the different results and those from other authors (particularly the thermodynamic approach from Goujard et al.) is also proposed.
2 EXPERIMENTAL
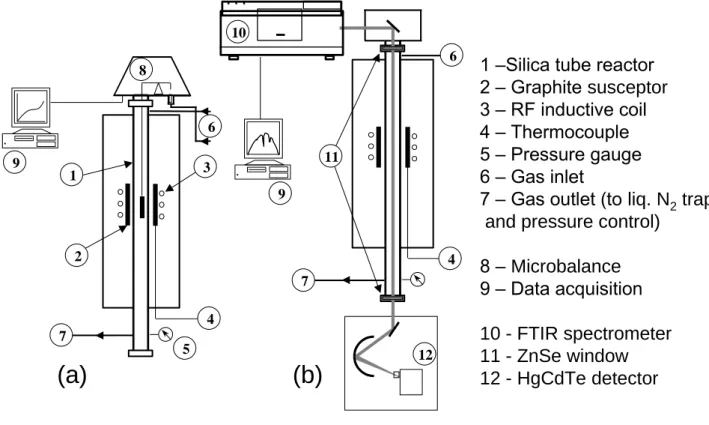
The CVD coatings were deposited on dense and polished graphite cylindrical substrates (10x10mm) in a low pressure hot-wall reactor (Fig. 2). The deposition chamber was a vertical silica tube heated by radio-frequency induction. The reactor was equipped with systems controlling accurately the temperature T, the total pressure P (with a motorized valve coupled with a Baratron
pressure gauge, both from MKS) and the various flow rates Qi (mass flow meters from Brooks
Instruments), for various gases of the precursor mixture (BCl3 99.5 mol% and H2 99.9995 mol%,
from Air Liquide and MTS 99 mol%, from Fluka; HCl 99 mol%, from Air Liquide, being added to the mixture in a few cases).
Two alternative arrangements of the CVD system were employed. In the case of the kinetic study, the top of the reactor was connected to a high sensitivity microbalance (Setaram) to which the specimen was hung, allowing the acquisition of the weight gain at a given position in the hot
zone of the reactor (Fig. 2a). The deposition rate (in g.cm-2.s-1) was determined under stable T, P
and Qi conditions and only within the steady state (when the surface of the coating remains constant
versus time).
In the gas phase analysis configuration, a FTIR spectrometer (Nicolet 550) was coupled to the CVD reactor (Fig. 2b). The in situ detection of the reactants, intermediates and product species and a semi-quantitative analysis of the gaseous mixture were performed in the transmission mode. The incident IR beam went axially through the reactor before reaching the HgCdTe detector. Two ZnSe windows were set up and a constant nitrogen flow was maintained outside the reactor in order to avoid any absorption along the beam path. An annular porous carbon substrate with a high specific area and allowing the IR beam to go through, was in some cases added in the hot zone, to more specifically assess the influence of the heterogeneous reactions on the gas phase composition.
The homogeneity and the average chemical composition of the coatings were characterized by recording in-depth Auger electron spectroscopy concentration profiles (VG Microlab 310-F). The Si, B and C concentrations were obtained using sensitivity factors determined from the analysis of
B4C and SiC standards. Each specimen (including standards) was sputtered out with Ar+ (a
thickness of about 300 nm) during the analysis, to ensure the in-depth concentration homogeneity. The morphology of their free surface and fractured cross-section was observed by field emission gun scanning electron microscopy (FEG-SEM, Hitachi S-4500). X-ray diffraction (XRD, Siemens
D5000, Cu-K=0.1542 nm), Raman microspectroscopy (Horriba-Jobin Yvon, Labram HR,
He-Ne=632.8 nm) and transmission electron microscopy (TEM, Philips, CM30SP) were used to identify
crystalline phases in the coatings.
The experimental conditions were chosen close to those compatible with the CVI process: (i) the total pressures analysed were P= 2, 5, 12 kPa, (ii) the temperature T ranged from 750 to 1050°C, (iii) the total flow rate Q from 50 to 500 sccm and (iv) the initial gas phase composition included a
low MTS/BCl3 ratio (0.31), to obtain boron-rich Si-B-C coatings and a large excess of
hydrogen (1220), to promote the reduction of BCl3 (Fig. 1).
3 RESULTS
3-1 Kinetic study
3-1-1 Influence of the total flow rate
The influence of the total flow rate (Q) on the deposition rate (R) was investigated in a first step, in order to evidence the various kinetic regimes encountered. The deposition rate is plotted in Fig. 3a-3c as a function of the total flow rate, for the three total pressures (2, 5 and 12 kPa), at a temperature of 900°C and either for four (at P=2 and 12 kPa) or six (at P=5 kPa) initial compositions of the gas phase (Fig. 1).
At the intermediate pressure of 5 kPa, R is only very little influenced by the flow rate, indicating that the kinetic process is mainly controlled by the chemical reactions (Fig. 3b). The
influence of the gas phase composition parameters (, ) is particularly obvious at this pressure.
The increase of (corresponding to an increase of the H2 content in the gas mixture) results in a
decrease of the deposition rate owing to a dilution of the reactants in hydrogen. The increase of the
deposition rate with shows an inhibition effect of BCl3, as already reported for the CVD of the
B-C system (from the BB-Cl3-CH4-H2 precursor) [8] and/or an activation of the kinetics due to MTS.
At P=2 kPa, the kinetic process is apparently also controlled by the chemical reactions, except
for =20 and Q>300 sccm, where the deposition rate is strongly increased (Fig. 3a). In such
zone and the partial pressure of MTS are both low and therefore strongly reduce the decomposition of MTS. The coating obtained in such condition could be expected to be enriched in boron, while the kinetics might be controlled by the mass transfer.
At the highest investigated pressure (P=12 kPa) and for =20, the deposition rate is only little
influenced by the total flow rate (Fig. 3c). The kinetic process is in this case also likely controlled
by chemical reactions. For =12, the deposition rate varies much more significantly with total flow
rate. R increases with Q when Q<150 sccm, stabilizes when Q150 sccm and finally decreases for
Q>150 sccm. This behaviour suggests that the kinetic process is controlled by a mass transfer regime for low total flow rates, whereas it is chemically controlled beyond Q=150 sccm. The decrease of the deposition rate observed for the high total flow rates might be related to a decrease of the residence time of the gas phase in the hot zone, reducing the decomposition of MTS and the reactivity of the gas phase.
3-1-2 Influence of temperature
The influence of the temperature on the deposition rate is reported in Arrhenius plots for the three total pressures investigated (2, 5 and 12 kPa) and either for two (at P=2 and 5 kPa) or three (at 12 kPa) different initial compositions of the gas phase (Fig. 4a-4c).
At P=2 kPa, a linear behaviour of lnR versus 1/T is observed for both compositions of the gas phase (Fig. 4a), indicative of a regime controlled by chemical reactions and characterized by two
relatively close apparent activation energies Ea of about 170 and 200 kJmol-1 (Table 1). These
similar Ea values suggest a similar deposition mechanism for both conditions. From the composition
=20; =0.3 to =12; =1, the deposition rate however slightly increases, revealing an activation
effect due to MTS and/or an inhibition effect due to BCl3, in agreement with the previous study of
the influence of the total flow rate (Fig. 3a).
At P=5 kPa, the thermal behaviour of the deposition rate is much more complex (Fig. 4b). Three distinct kinetic regimes can be evidenced. At high temperatures, the low thermal activation of the deposition rate shows that the kinetics are at least partly controlled by mass transfer. For intermediate temperatures (900<T<1000°C), linear behaviours are observed in the Arrhenius plot,
with relatively high apparent activation energies (Table 1). These high Ea values (Ea280 kJmol-1)
confirm that the kinetics are controlled by chemical reactions within this temperature range. For lower temperatures (T<900°C), linear behaviours are also observed but with lower activation
energies (Ea180 kJmol-1, Table 1), suggesting a transition in the chemical mechanisms controlling
the deposition process.
At P=12 kPa, the influence of the temperature on the deposition rate is approximately the same as that reported at 5 kPa (Fig. 4c), with similar activation energies (Table 1). Within the
temperature range 850<T<1000°C, the difference observed between the deposition rates measured
for =12; =1; Q=175 sccm and for the other conditions, is in agreement with the previous results
concerning the influence of the total flow rate (Fig. 3c).
The activation energies measured at intermediate temperatures (850<T<1000°C) are
particularly high (Ea280 kJmol-1), i.e., significantly beyond those for the CVD of the Si-C system
from MTS-H2 precursor (Ea190 kJmol-1, [9]). This is no longer true for lower temperatures
(750<T<900°C) where the activation energy is much lower and the deposition rate respectively higher, than those for the Si-C system (R being almost negligible in the latter case). Such a transition between two chemical processes, characterized by an increase of the activation energy with temperature, suggests a competition between two parallel deposition routes, the fastest prevailing over the second one. The lower thermal activation route is predominant at low temperature (T<900°C), whereas the high activation route prevails at intermediate temperatures (850<T<1000°C). Furthermore, an increase of the deposition rate with the MTS content strongly suggests an enrichment of the coating in silicon as the temperature increases (T>900°C).
3-1-3 Apparent reaction orders
The conditions of the kinetic regimes controlled by chemical reactions being established (from both the R=f(Q) and lnR=f(1/T) curves), the apparent reaction orders with respect to the
initial gaseous species (BCl3, MTS, H2) and one of the products (HCl), can be determined within
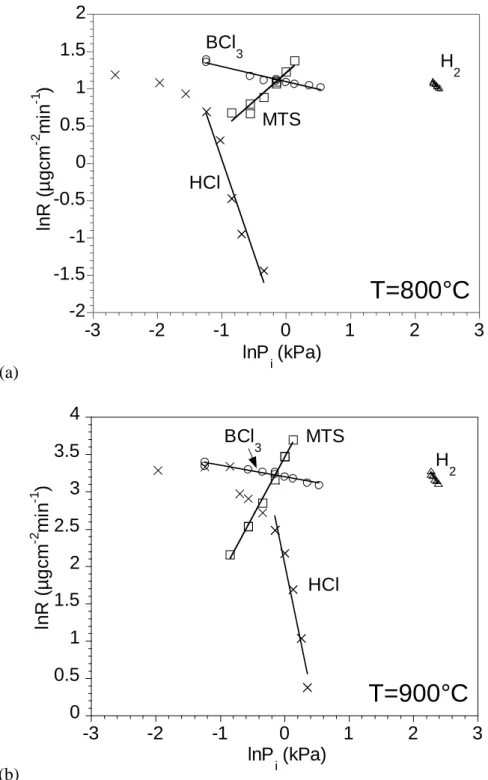
these regimes, by varying a single partial pressure while keeping the others constant. For the reaction order with respect to HCl, this specie was gradually added to the initial gas mixture. The variations of the initial composition during the experiments were limited to a range inducing only small deviations of the total pressure around 12 kPa (11.1-12.9 kPa). This study has been carried out at 800 and 900°C, i.e., within the two distinct kinetic regimes (characterized by two different activation energies) evidenced above (Fig. 5).
The reaction orders with respect to H2, MTS and BCl3 are respectively nH2=–0.80.1,
nMTS=0.80.1 and nBCl3=–0.20.02 at 800°C (Fig. 5a) and nH2=–1.30.2, nMTS=1.60.05 and
nBCl3=–0.150.02 at 900°C (Fig. 5b). The negative nBCl3 value might be related to an inhibition
effect due to the HCl species produced by the homogeneous decomposition of BCl3, as already
reported for the CVD of the B-C system [8]. This is confirmed by the highly negative value of nHCl
found at high HCl partial pressures (respectively -2.50.5 at 800°C and -4.20.5 at 900°C) (Fig.
5a-5b). The high positive MTS-reaction order confirms the strong influence of the MTS partial
pressure on the deposition rate. Similarly to the activation energy, nMTS increases with the
temperature. As already suggested by the Ea transition, this phenomenon indicates a change in the
composition of the coating (likely an increase of the silicon and carbon concentrations). The
strongly negative nH2 value (which shows the inhibiting effect of H2) may appear unexpected when
compared with the very close to zero values obtained for the CVD of the B-C [8] and Si-C systems [9].
3-2 Characterization of the deposit
3-2-1 Chemical analyses
A wide range of coatings was prepared in various CVD conditions (T, P, Q, , ) for the
chemical and structural analyses. The gas precursor compositions selected were the same as those investigated for the kinetic study. The temperature and the total gas flow rate were chosen within the kinetic domains controlled by chemical reactions. The average atomic concentrations of the various coatings are presented in Fig. 6 as a function of the temperature, for the three different
pressures 2, 5 and 12 kPa and for two gas phase compositions =12; =1 (Fig. 6a) and =20; =0.3
(Fig. 6b).
For all the conditions, the Si/C atomic ratio is surprisingly low considering that both elements
arise equally from the same precursor species (MTS: SiCl3CH3). For all coatings, the silicon
concentration ranges from CSi=0.5 to 18 at.%, the carbon content ranges from CC=23 to 42 at.% and
the boron content remains relatively high (from CB=40 to 75 at.%).
The silicon concentration increases both when the temperature increases and when the initial
composition of the gas phase varies from =20; =0.3 to =12; =1 (i.e., when both the MTS and
H2 contents increase and the BCl3 content decreases) (Fig. 6a-6b). The variations of the boron and
carbon contents with temperature are more complex, with a maximum of boron and a minimum of carbon around 900°C.
The coating is enriched in carbon and silicon when increases (i.e. when the MTS and H2
contents increase and the BCl3 content decreases). This result is in agreement with the
thermodynamic study of Goujard et al., which predicted an increase of the proportion of the SiC
phase and a decrease of BxC.
A clear correlation can be established between the thermal variations of the chemical
composition of the coatings and the deposition rate. Both the maximum of CB (respectively the
minimum of CC) observed at about 900°C and the increase of CSi with the temperature (especially
beyond 900°C) can be related to the kinetic transitions previously observed in terms of activation energy and MTS-reaction order (Fig. 4b-4c). This transition in the composition of the coating probably results from a change in the chemical reaction route involved in the deposition process, as already supported by the kinetic study.
3-2-2 Morphological and structural analyses
The morphology of the fractured coatings is homogeneous and amorphous-like for the coatings processed at low temperature (Fig. 7a) and shows an extremely fine nanotexture for the specimens prepared at the highest temperatures (Fig. 7b).
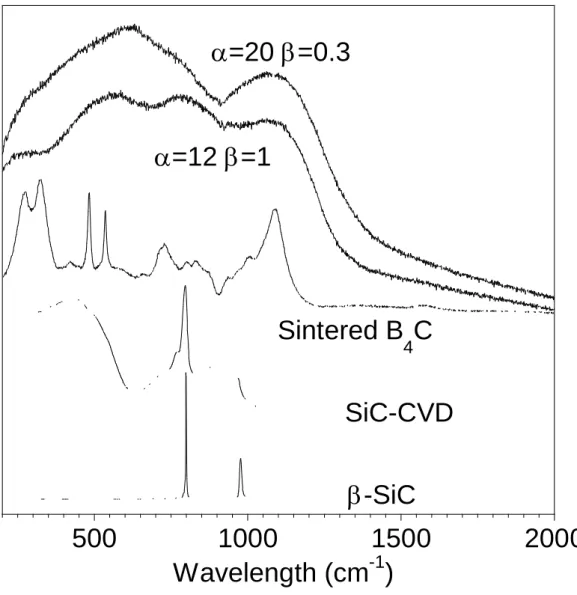
The Raman spectra give no indication of any crystalline phase in the coatings (Fig. 8). In
particular, crystalline boron carbide and free carbon (with a sp2 or sp3 hybridization), even in a very
disordered form, were not revealed. However, all the spectra are similar to those obtained from the
CVD of the B-C system [8], showing a wide band around 800-1400cm-1, i.e., at frequencies
corresponding to the breathing modes of B11C icosahedra in crystalline B4C [10]. These features,
characteristic of a density of a state, might be assigned to very disordered BxCy icosahedra-like
units, with no further structural organization at a longer range.
Slight variations in the Raman spectra are detected with the increase of the deposition temperature and the MTS concentration in the initial gas phase. This is illustrated in Fig. 8
comparing the two conditions =20; =0.3; Q=243 sccm and =12; =1; Q=420 sccm at
T=1050°C and P=12 kPa. The former spectrum is similar to those obtained at lower temperatures
and from B-C coatings [8]. The latter shows an additional large band around 700-950 cm-1, within
the range of the optical phonons of the SiC polytypes [11]. Such a broad band also corresponds to a poorly crystalline form of SiC. The higher amount of MTS in the gas phase, which leads to an increase of the silicon content of the coating, also induces the crystallization of SiC nanograins. The
presence of -SiC nanocrystals in this specimen (as evidenced by the 111, 220, 311 Bragg
reflexions) was confirmed by XRD.
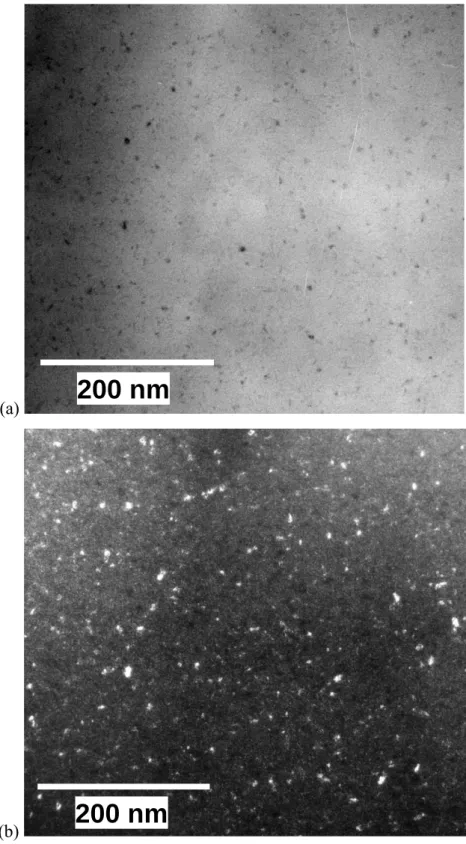
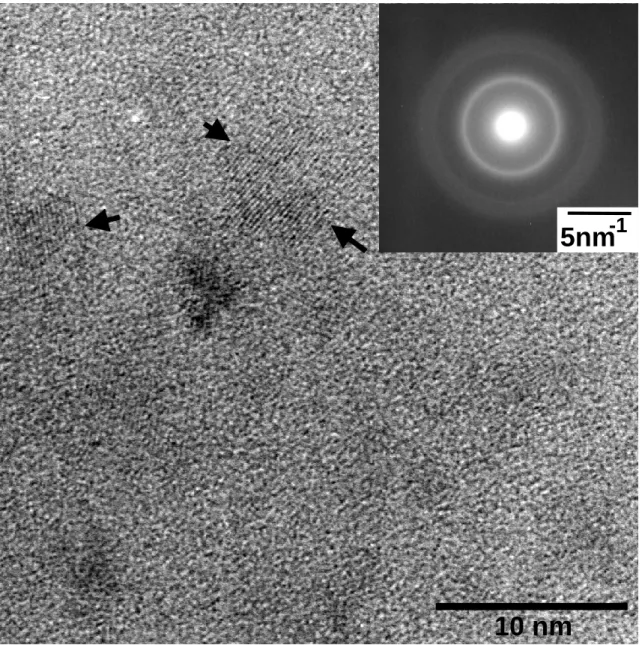
TEM investigations were also carried out on the same specimen (=12; =1; Q=420 sccm;
T=1050°C; P=12 kPa), to examine its structure at the nanometer scale. The bright field images
show a heterogeneous structure composed of nanocrystals (5 nm) embedded in an amorphous
phase (Fig. 9a). Selected area electron diffraction and high resolution analyses were carried out to
determine the nature of the crystals phase (Fig. 10). The diffraction rings were assigned to the -SiC
phase (sharp 111 at d=0.251 nm and broad and weak 220 and 311). The diffuse and homogeneous rings are characteristic of nanocrystals with a random orientation. The 111-dark field (Fig. 9b) and
high resolution images (Fig. 10) confirmed that the coherent domains belong to the -SiC phase
(d=0.252 nm).
This structural study permits to conclude that the low temperature coatings consist of a
quasi-amorphous B-and C-rich phase (e.g., disordered BxCy icosahedra units without any long range
sp2 (with aromatic rings) or sp3 (diamond like) carbon phase. SiC nanocrystals appear within the
amorphous phase at high temperature (T1050°C), their amount increasing with the silicon
concentration.
3-3 Gas phase analysis
An example of IR spectrum of the gas phase (T=900°C, P=12 kPa, =12, =1 and Q=420
sccm) is shown in Fig. 11. The gaseous species detected were MTS, SiCl4, chlorosilanes (HxSiCl
(4-x)), CH4, BCl3, HBCl2 and HCl. The characteristic peak areas are represented in Fig. 12a-12g as a
function of temperature (from room temperature to 1050°C), for P=12 kPa, =12 and =1, either in
the presence or without the annular porous preform in the hot zone (installed to assess the influence of the heterogeneous reactions). It is worthy of note that the IR beam goes through the whole reactor (Fig. 2) and consequently the spectra recorded not only reflect the concentration of the gases in the hot zone, but also the contribution of (i) the inlet initial species, in the upper part of the reactor and (ii) the outlet gases (products and unreacted species), in the lower part. The variations
of the IR peak areas characteristic of the reactants (MTS, BCl3) versus temperature are therefore
underestimated with respect to the variations of the intermediate species (e.g., HBCl2).
The peak areas of the MTS and BCl3 species both slightly and linearly decrease from room
temperature to 500°C (Fig. 12a, 12e). This phenomenon can be explained by a thermal expansion of
the gases (no decomposition is expected below this temperature). The MTS and BCl3 apparent
concentrations strongly decrease as temperature rises, from about 800°C for MTS and 600°C for
BCl3. The initiation of the BCl3 consumption at low temperature is directly related to the production
of HBCl2 and HCl from homogeneous reactions, occurring within the same temperature range (Fig.
12f, 12g) [8, 12]. Similarly, the consumption of MTS is related to the production of SiCl4, HxSiCl
(4-x) species and CH4 (Fig. 12b-12d). The decomposition of BCl3 is strongly enhanced by the addition
of a porous preform in the hot zone of the reactor (and the beginning of the decomposition is shifted from 600°C to 400°C, Fig. 12e). Heterogeneous reactions are not expected at such a low temperature (the deposition rate is indeed negligible, Fig. 4). The porous preform, increasing the residence time of the gases in the hot zone, indeed improves homogeneous reactions such as the
reduction of BCl3 into HBCl2. In contrast, the decomposition of MTS is only slightly enhanced by
the preform, the decomposition starting at 750°C instead of 800°C (Fig. 12a).
The peak area of the HBCl2 intermediate species exhibits a maximum at about 850-900°C
without the porous preform (and 750°C with the perform) (Fig. 12f), corresponding to the starting
deposition of the solid (see section 3-1). HBCl2 is homogeneously produced from the
decomposition of BCl3 below this temperature, whereas it is partly consumed beyond 850°C,
heterogeneous reactions with a hydrocarbon to produce boron carbide [8]. For higher temperatures
(T850°C), the peak area downshift induced by the presence of the perform can be assigned to the
heterogeneous consumption of HBCl2. The difference between the two peak areas is maximum at
about 900°C, a feature which can be related to the maximum of the boron atomic concentration in the coating, observed at the same temperature (Fig. 6).
The peak areas of the CH4 and SiCl4 species exhibit a maximum at about 1000°C in presence
or without perform (Fig. 12c-12d). The comparison between the two peak areas indicates that heterogeneous consumption of both species increases with the temperature from 900°C. These two species are further consumed from 900°C to 1050°C, giving rise to an increase of silicon and carbon concentrations in the coating.
The HCl production is also promoted by the addition of the porous perform (Fig. 12g). This product is obtained by homogeneous reactions at low temperature and by both heterogeneous and homogeneous reactions at higher temperatures.
Finally, the gas phase composition in the condition P=5 kPa;=12; =1;Q=245 sccm was
compared to that in a similar condition but in the absence of BCl3 in the initial gas mixture, with the
aim of investigating the role of BCl3 in the decomposition of MTS. The production of SiCl4 is
strongly enhanced by the presence of BCl3, whereas that of CH4 is almost unaffected (Fig.
13a-13b). Although SiCl4 and CH4 species are both derived from the homogeneous decomposition of
MTS, their apparent concentrations in the gas phase are significantly different. The minor influence
of BCl3 on the apparent concentration of CH4 might be explained by a heterogeneous consumption
of hydrocarbons derived from the decomposition of MTS, within the low temperature range
(780<T<900°C), counterbalancing the homogeneous production of CH4. This phenomenon could
indeed explain the surprisingly high carbon content in the coating (particularly with respect to silicon) observed at low temperatures (Fig. 6).
4 DISCUSSION AND CONCLUSION
On the basis of complementary experimental approaches (kinetic measurements, characterization of the coatings and analysis of the gas phase), this study evidenced the existence of different CVD regimes alternating as a function of the temperature range.
For low temperatures (780°C<T<900°C), the activation energy of the CVD rate is relatively
low (Ea<200 kJmol-1), the order with respect to MTS is slightly lower than 0.8 and the coatings are
rich in boron and carbon, with a B/C atomic ratio close to 2 (only traces of silicon are detected). The kinetics are likely controlled by the heterogeneous reaction of hydrocarbons (derived from the
amorphous and consists mainly of B-B and B-C bonds organized only at a very short distance (e.g., in the form of disordered icosahedra). Despite the high carbon concentration, there is no evidence of aromatic C-C bonds in the material.
For intermediate temperatures (900<T<1000°C), the activation energy and the order with
respect to MTS are significantly higher than at low temperatures (Ea300 kJmol-1 and nMTS=1.6,
respectively). Such a transition in the deposition rate reveals a change in the chemical mechanism controlling the kinetics. This phenomenon coincides with an increase of the silicon and carbon concentrations and a decrease of the boron content of the coating. In addition, the gas phase analysis showed that the heterogeneous consumption of chlorosilanes increases from 900°C. In this temperature range, the kinetics seem to be controlled by the reaction of silicon-rich gas species
(e.g., HxSiCl(4-x), but also radicals such as SiCl3, SiCl2) derived from MTS. The coatings are
amorphous and their silicon content increases as the temperature rises. In addition to the same B-B and B-C bonds present at low temperature, increasing amounts of Si-C bonds gradually appear in the ceramic, but in too little amounts to give rise to the formation of SiC crystals.
For high temperatures (T>1000°C), kinetics are controlled by mass transfer. The silicon concentration increases at such a level that SiC nanocrystals are formed, embedded within the amorphous B-and C-rich phase (where B-C bonds are predominant). The mass transfer regime indeed favours phase crystallization, in agreement with the thermodynamic equilibrium [5-6].
The present work has allowed a better understanding of the deposition process of Si-B-C
coatings. A standard BCl3-MTS-H2 precursor was used, but under conditions never investigated so
far, i.e., compatible with the CVI of porous fibrous preforms. The gas phase analysis, the heterogeneous kinetic study and the characterization of the coatings showed that the CVD process of the Si-B-C system is particularly complex. However, the deposition kinetics in the Si-B-C system have been compared to those in the B-C and Si-C systems. On the one hand, the Si-B-C system can be compared to the B-C system at low temperatures (780<T<900°C), with kinetics mainly controlled by the formation of B-C bonds [8]. On the other hand, the kinetic behaviour displays some common features with that of the Si-C system for intermediate temperatures (900<T<1000°C), with kinetics rather controlled by the formation of Si-C bonds.
AKNOWLEDGEMENTS
The authors are indebted to CNRS and Snecma for providing the grant to J.B. They greatly acknowledge C. François, for the TEM analyses, as well as S. Bertrand and C. Descamps for valuable discussions.
REFERENCES
[1] S. Goujard, L. Vandenbulcke, J. Rey, J.L. Charvet, H. Tawill, French Patent No. 9013323, 26
Oct.1990.
[2] S. Goujard, L. Vandenbulcke, in: J.P. Singh, N.P. Bansal (Eds.), Advances in Ceramic-Matrix
Composites II, Proceedings of the Ceramic Matrix Composites Symposium, 96th Annual
Meeting of the American Ceramic Society, Indianapolis, U.S.A., April 25-27, 1994, Ceramic Transactions 46 (1994) 925.
[3] E. Bouillon, F. Abbe, S. Goujard, E. Pestourie, G. Habarou, B. Dambrine, in : T. Jessen, E
Ustundag (Eds.), 24th Annual Conference on Composites, Advanced Ceramics, Materials, and Structures: A, Cocoa Beach, U.S.A., January 23-28, 2000, Ceram. Eng. Sci. Proc. 21 (2000) 459.
[4] F. Langlais, in: A. Kelly, C. Zweben, R. Warren (Eds.), Comprehensive Composite Materials,
vol. 4: Carbon/Carbon, Cement and Ceramic Matrix Composites, Elsevier, Amsterdam, 2000 p. 611.
[5] S. Goujard, L. Vandenbulke, C. Bernard, G. Blondiaux, J.L. Debrun, J. Electrochem. Soc.,
141 (1994) 452.
[6] S. Goujard, L. Vandenbulke, C. Bernard, J. Eur. Ceram. Soc., 15 (1995) 551.
[7] E.M. Golda, B. Gallois, in: T.E. Besmann, B.M. Gallois, J.W. Warren (Eds.), Chemical Vapor
Deposition of Refractory Metals, Ceramics II, December 4-6, 1991, Boston, U.S.A., Materials Research Society Symposium Proceedings 250 (1993) 167.
[8] J. Berjonneau, G. Chollon, F. Langlais, in: A. Devi, R. Fischer, H. Parala, M. Hitchman
(Eds.), 15th European Conference on Chemical Vapour Deposition, Bochum, Germany,
September 4-9, 2005, Electrochemical Society Proceedings 2005-09 (2005)189. [9] F. Loumagne, F. Langlais, R. Naslain, J. Cryst. Growth, 155 (1995) 198.
[10] D.R. Tallant, T.L. Aselage, A.N. Campbell, D. Emin, Phys. Rev. B, 40 (1989) 5649. [11] D.W. Feldman, J.H. Parker, W.J. Choyke, L. Patrick, Phys. Rev. 173 (1968) 787.
Figure captions
Fig. 1: Ternary diagram showing the initial gas phase compositions investigated by Goujard et al [6] and in the present work.
Fig. 2: Configuration of the CVD-reactor during (a) the measurement of the deposition rate (with the microbalance) and (b) the gas phase analysis (with the FTIR spectrometer).
Fig. 3: Influence of the total flow rate (Q) on the deposition rate (R) at T=900°C and (a) P=2 kPa, (b) P=5 kPa and (c) P=12 kPa.
Fig. 4: Influence of the temperature on the deposition rate at (a) P=2 kPa, (b) P=5 kPa and (c) P=12 kPa.
Fig. 5: Influence of the partial pressures (Pi) on the deposition rate, at P12 kPa and for (a)
T=800°C and (b) T=900°C.
Fig. 6: Influence of the temperature on the elemental composition of CVD coatings for (a) =12,
=1 and Q=245 sccm (P=2 and 5 kPa) or Q=420 sccm (P=12 kPa) and (b) =20, =0.3 and Q=243
sccm
Fig. 7: SEM micrographs of the fractured sections of coatings processed at P=12 kPa and for (a)
=12, =1, T=900°C and Q=175 sccm and (b) =20, =0.3, T=1050°C and Q=243 sccm.
Fig 8: Raman spectra of crystalline SiC and B4C reference materials and coatings processed at
T=1050°C, P=12 kPa and for =12, =1 and Q=420 sccm and =20, =0.3 and Q=243 sccm.
Fig. 9: Bright field (a)and SiC(111)-dark field (b) TEM images of a coating processed at T=1050°C,
P=12 kPa, =12, =1 and Q=420 sccm.
Fig. 10: HRTEM image and the corresponding SAED pattern of a coating processed at T=1050°C,
P=12 kPa, =12, =1 and Q=420 sccm.
Fig. 11: FTIR spectrum of the gas phase recorded at T=900°C, P=12 kPa, =12, =1 and Q=420
Fig. 12: Influence of the temperature on the FTIR peak areas of the main gas species (P=12 kPa,
=12, =1 and Q=420 sccm). (a) MTS, (b) chlorosilanes, (c) SiCl4, (d) CH4, (e) BCl3, (f) HBCl2
and (g) HCl.
Figure 13: Influence of the presence of BCl3 in the gas phase on the FTIR peak areas of CH4 and
Table captions
Table 1 : Apparent activation energies Ea (kJmol-1) of the deposition rate as a function of the
=8
=
0.
3
=
0.
6
=1
BCl
3
MTS
H
2
=10
=12
=20
=40
Present work
Goujard et al. [6]
=8
=
0.
3
=
0.
6
=1
BCl
3
MTS
H
2
=10
=12
=20
=40
Present work
Goujard et al. [6]
Fig. 1: Ternary diagram showing the initial gas phase compositions investigated by Goujard et al [6] and in the present work.
(a)
(b)
1 –Silica tube reactor 2 – Graphite susceptor 3 – RF inductive coil 4 – Thermocouple 5 – Pressure gauge 6 – Gas inlet
7 – Gas outlet (to liq. N2 trap
and pressure control) 8 – Microbalance 9 – Data acquisition 10 - FTIR spectrometer 11 - ZnSe window 12 - HgCdTe detector 4 5 9 8 6 9 3 1 2 7 10 11 12 6 4 7
Fig. 2: Configuration of the CVD-reactor during (a) the measurement of the deposition rate (with the microbalance) and (b) the gas phase analysis (with the FTIR spectrometer).
(a) 0 1 2 3 4 5 6 7 8 50 100 150 200 250 300 350 400 450 =12 =0.3 =12 =1 =20 =0.3 =20 =1 Q (sccm) R ( µ g c m -2 mi n -1 ) (b) 0 1 2 3 4 5 6 7 8 50 100 150 200 250 300 350 400 450 =12 =0.3 =12 =0.6 =12 =1 =20 =0.3 =20 =0.6 =20 =1 1 2 0 .3 Q (sccm) R ( µ g c m -2 mi n -1 ) (c) 0 2 4 6 8 10 50 100 150 200 250 300 350 400 450 =12 =0.3 =12 =1 =20 =0.3 =20 =1 Q (sccm) R ( µ g c m -2 m in -1 )
Fig. 3: Influence of the total flow rate (Q) on the deposition rate (R) at T=900°C and (a) P=2 kPa, (b) P=5 kPa and (c) P=12 kPa.
(a) -2 -1 0 1 2 3 4 5 0.7 0.75 0.8 0.85 0.9 0.95 1 1100 1000 900 800 T°(C) ln R ( µ g c m -2 mi n -1 ) 1000/T (K-1) =12 =1 Q=245sccm =20 =0.3 Q=243sccm (b) -2 -1 0 1 2 3 4 5 0.7 0.75 0.8 0.85 0.9 0.95 1 1100 1000 900 800 T°(C) ln R ( µ g c m -2 mi n -1 ) 1000/T (K-1) =12 =1 Q=245sccm =20 =0.3 Q=243sccm (c) -2 -1 0 1 2 3 4 5 0.7 0.75 0.8 0.85 0.9 0.95 1 1000 900 800 T°(C) 1100 ln R ( µ g c m -2 mi n -1 ) 1000/T (K-1) =12 =1 Q=420sccm =20 =0.3 Q=365sccm =12 =1 Q=175sccm
Fig. 4: Influence of the temperature on the deposition rate at (a) P=2 kPa, (b) P=5 kPa and (c) P=12 kPa.
(a) -2 -1.5 -1 -0.5 0 0.5 1 1.5 2 -3 -2 -1 0 1 2 3 lnP i (kPa) ln R ( µ gcm -2 m in -1 ) MTS BCl 3 H 2 HCl
T=800°C
(b) 0 0.5 1 1.5 2 2.5 3 3.5 4 -3 -2 -1 0 1 2 3 ln R ( µg cm -2 m in -1 ) lnP i (kPa) H 2 BCl 3 MTS HClT=900°C
Fig. 5: Influence of the partial pressures (Pi) on the deposition rate, at P12 kPa and for (a)
(a) 0 10 20 30 40 50 60 70 80 750 800 850 900 950 1000 1050 P=12kPa P=5kPa P=2kPa T°(C)
Si
B
C
C on cent ra ti on (at .% ) (b) 0 10 20 30 40 50 60 70 80 750 800 850 900 950 1000 1050 P=12kPa P=5kPa % at. 2kPa C on cent rat ion (at .% ) T°(C)Si
B
C
Fig. 6: Influence of the temperature on the elemental composition of CVD coatings for (a) =12,
=1 and Q=245 sccm (P=2 and 5 kPa) or Q=420 sccm (P=12 kPa) and (b) =20, =0.3 and Q=243
(a)
(b)
Fig. 7: SEM micrographs of the fractured sections of coatings processed at P=12 kPa and for (a)
500
1000
1500
2000
B
=12
=1
=20
=0.3
Wavelength (cm
-1)
-SiC
SiC-CVD
Sintered B
4C
Fig 8: Raman spectra of crystalline SiC and B4C reference materials and coatings processed at
(a)
200 nm
(b)
200 nm
Fig. 9: Bright field (a)and SiC(111)-dark field (b) TEM images of a coating processed at T=1050°C,
Fig. 10: HRTEM image and the corresponding SAED pattern of a coating processed at T=1050°C, P=12 kPa, =12, =1 and Q=420 sccm.
10 nm
5nm
-1
10 nm
5nm
-1
5nm
-1
5nm
-1
500
1000
1500
2000
2500
3000
3500
B
Wavenumber (cm
-1)
SiCl
4HBCl
2CH
4H
xSiCl
4-xMTS
BCl
3HCl
X10
CH
4Fig. 11: FTIR spectrum of the gas phase recorded at T=900°C, P=12 kPa, =12, =1 and Q=420
(a) 5 10 15 20 25 30 0 200 400 600 800 1000 T (°C) P e ak a re a (a. u. ) MTS (1270 cm-1) (b) 0 2 4 6 8 10 0 200 400 600 800 1000 T (°C) P e a k ar e a ( a. u. ) Chlorosilanes (2259 cm-1) (c) 0 1 2 3 4 5 6 7 8 0 200 400 600 800 1000 T (°C) P eak a rea (a. u. ) SiCl 4 (641cm -1) (d) 0 0.2 0.4 0.6 0.8 1 1.2 1.4 1.6 0 200 400 600 800 1000 T (°C) P eak a re a (a .u. ) CH 4 (1306 cm -1)
Fig. 12: Influence of the temperature on the FTIR peak areas of the main gas species (P=12 kPa,
=12, =1 and Q=420 sccm). (a) MTS, (b) chlorosilanes, (c) SiCl4, (d) CH4, (e) BCl3, (f) HBCl2
(e) 1 2 3 4 5 6 0 200 400 600 800 1000 T (°C) P eak a rea (a. u. ) BCl 3 (1900 cm -1) (f) 0 10 20 30 40 50 0 200 400 600 800 1000 T (°C) P e ak a re a (a. u. ) HBCl 2 (1100 cm -1) (g) 0 0.05 0.1 0.15 0.2 0.25 0.3 0.35 0.4 0 200 400 600 800 1000 T (°C) P e ak a re a (a. u .) HCl (2943 cm-1)
Fig. 12: Influence of the temperature on the FTIR peak areas of the main gas species (P=12 kPa,
=12, =1 and Q=420 sccm). (a) MTS, (b) chlorosilanes, (c) SiCl4, (d) CH4, (e) BCl3, (f) HBCl2
(a) 0 200 400 600 800 1000 With BCl 3 Without BCl 3 0 0.05 0.1 0.15 0.2 0.25 0.3 0.35 0.4 A ve c B C l3 cor P e ak a re a ( a. u. ) CH 4 (1306 cm -1) T (°C) (b) 0 0.5 1 1.5 2 2.5 0 200 400 600 800 1000 With BCl 3 Without BCl 3 SiCl 4 (641 cm -1) T (°C) P e ak a re a ( a. u. )
Figure 13: Influence of the presence of BCl3 in the gas phase on the FTIR peak areas of CH4 and
TABLE
Q(sccm)
P=2 kPa P=5 kPa P=12 kPa
750T1000°C 750T900°C 900T1000°C 750T850°C 850T1000°C 12/1 175 - - - 1791 3035 245 1995 1949 2677 - - 420 - - - 1618 26812 20/0.3 243 1715 16911 2937 - - 365 - - - 17219 2968
Table 1 : Apparent activation energies Ea (kJmol-1) of the deposition rate as a function of the
![Fig. 1: Ternary diagram showing the initial gas phase compositions investigated by Goujard et al [6]](https://thumb-eu.123doks.com/thumbv2/123doknet/13260398.396686/17.892.119.789.88.725/ternary-diagram-showing-initial-phase-compositions-investigated-goujard.webp)