HAL Id: hal-00297588
https://hal.archives-ouvertes.fr/hal-00297588
Submitted on 18 Dec 2006
HAL is a multi-disciplinary open access
archive for the deposit and dissemination of
sci-entific research documents, whether they are
pub-lished or not. The documents may come from
teaching and research institutions in France or
abroad, or from public or private research centers.
L’archive ouverte pluridisciplinaire HAL, est
destinée au dépôt et à la diffusion de documents
scientifiques de niveau recherche, publiés ou non,
émanant des établissements d’enseignement et de
recherche français ou étrangers, des laboratoires
publics ou privés.
emission of nitrogen oxides (NO and N2O)
K. Pilegaard, U. Skiba, P. Ambus, C. Beier, N. Brüggemann, K.
Butterbach-Bahl, J. Dick, J. Dorsey, J. Duyzer, M. Gallagher, et al.
To cite this version:
K. Pilegaard, U. Skiba, P. Ambus, C. Beier, N. Brüggemann, et al.. Factors controlling regional
differ-ences in forest soil emission of nitrogen oxides (NO and N2O). Biogeoscidiffer-ences, European Geoscidiffer-ences
Union, 2006, 3 (4), pp.651-661. �hal-00297588�
www.biogeosciences.net/3/651/2006/ © Author(s) 2006. This work is licensed under a Creative Commons License.
Biogeosciences
Factors controlling regional differences in forest soil emission of
nitrogen oxides (NO and N
2
O)
K. Pilegaard1, U. Skiba2, P. Ambus1, C. Beier1, N. Br ¨uggemann3, K. Butterbach-Bahl3, J. Dick2, J. Dorsey4, J. Duyzer5, M. Gallagher4, R. Gasche3, L. Horvath6, B. Kitzler7, A. Leip8, M. K. Pihlatie9, P. Rosenkranz3, G. Seufert8, T. Vesala9, H. Westrate5, and S. Zechmeister-Boltenstern7
1Biosystems Department, Risø National Laboratory, Roskilde, Denmark 2Centre of Ecology and Hydrology, Penicuik, Scotland
3Institute for Meteorology and Climate Research, Karlsruhe Research Centre, Garmisch-Partenkirchen, Germany 4UMIST, Manchester, UK
5Netherlands Organization for Applied Research, Apeldoorn, The Netherlands 6Hungarian Meteorological Service, Budapest, Hungary
7Federal Forest Research Centre, Vienna, Austria 8Joint Research Centre, Ispra, Italy
9Department of Physical sciences, University of Helsinki, Finland
Received: 3 May 2006 – Published in Biogeosciences Discuss.: 29 June 2006
Revised: 21 November 2006 – Accepted: 8 December 2006 – Published: 18 December 2006
Abstract. Soil emissions of NO and N2O were measured
continuously at high frequency for more than one year at 15 European forest sites as part of the EU-funded project NOFRETETE. The locations represent different forest types (coniferous/deciduous) and different nitrogen loads. Geo-graphically they range from Finland in the north to Italy in the south and from Hungary in the east to Scotland in the west.
The highest NO emissions were observed from conif-erous forests, whereas the lowest NO emissions were ob-served from deciduous forests. The NO emissions from coniferous forests were highly correlated with N-deposition. The site with the highest average annual emission (82 µg NO-N m−2h−1) was a spruce forest in South-Germany (H¨oglwald) receiving an annual N-deposition of 2.9 g m−2. NO emissions close to the detection limit were observed from a pine forest in Finland where the N-deposition was 0.2 g N m−2a−1. No significant correlation between N2O
emission and N-deposition was found. The highest average annual N2O emission (20 µg N2O-N m−2h−1) was found in
an oak forest in the M´atra mountains (Hungary) receiving an annual N-deposition of 1.6 g m−2. N
2O emission was
signif-icantly negatively correlated with the C/N ratio.
The difference in N-oxide emissions from soils of conif-erous and deciduous forests may partly be explained by dif-ferences in N-deposition rates and partly by difdif-ferences in characteristics of the litter layer and soil. NO was mainly
Correspondence to: K. Pilegaard
derived from nitrification whereas N2O was mainly derived
from denitrification. In general, soil moisture is lower at coniferous sites (at least during spring time) and the litter layer of coniferous forests is thick and well aerated favouring nitrification and thus release of NO. Conversely, the higher rates of denitrification in deciduous forests due to a compact and moist litter layer lead to N2O production and NO
con-sumption in the soil.
The two factors soil moisture and soil temperature are of-ten explaining most of the temporal variation within a site. When comparing annual emissions on a regional scale, how-ever, factors such as nitrogen deposition and forest and soil type become much more important.
1 Introduction
Increasing emissions of N-oxides from combustion pro-cesses and NH3-volatilisation from agriculture have led
to an increase of N-deposition in Europe during the last decades. Atmospheric N-deposition is estimated to be at least 0.5 g N m−2a−1 in most parts of Europe, in central
Europe significantly above 2 g N m−2a−1
(Umweltbunde-samt, 1997), and in The Netherlands, parts of Northern Ger-many, and UK up to 5 g N m−2a−1 (e.g. van der Eerden et al., 1998). As a result, natural ecosystems, especially forests which have a huge filtering capacity, receive an N-fertilization equivalent to approx. 15% of N-fertilizer input to arable land (Kristensen et al., 2004). Due to this high atmospheric N-deposition the N-status of forest ecosystems
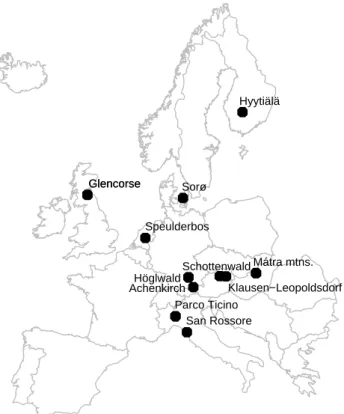
Speulderbos Sorø Mátra mtns. Glencorse Parco Ticino San Rossore Glencorse Hyytiälä Höglwald Achenkirch Klausen−Leopoldsdorf Schottenwald
Fig. 1. NOFRETETE field stations.
is changing from naturally N-limited to N-saturated (Aber et al., 1989; Dise and Wright, 1995; Fenn et al., 1998). Nitro-gen saturation of forest ecosystems has serious environmen-tal consequences by changing the soil chemistry, forest com-position and productivity, and by altering the fluxes of radia-tively active trace gases (e.g. NO, N2O, CO2, CH4) (Aber,
1992; Butterbach-Bahl et al., 1997; Priha and Smolander, 1995). The improved N-availability in forest soils has been shown to reduce C/N-ratios in leaves and litter (Magill et al., 1997) and, at least initially, has stimulated tree growth and forest productivity (Beck, 1996). Increased atmospheric N-deposition is a matter of concern, as it can change the ground vegetation (increasing dominance of nitrophilic species) (e.g. Hofmann, 1995; Pitcairn et al., 2002); decrease forest vitality (induction of nutrient imbalances) (e.g. Schulze, 1989); ac-celerate soil acidification due to increased nitrification (e.g. Kreutzer and Weiss, 1998); and increase losses of N to the environment in form of N-leaching to the groundwater (e.g. Kreutzer, 1995) and/or in form of N-gas emissions (N2O,
NO, N2) into the atmosphere (e.g. Butterbach-Bahl et al.,
1997; Pilegaard et al., 1999; van Dijk and Duyzer, 1999; Skiba et al., 1998).
Oxidised nitrogen compounds in the atmosphere such as nitrous oxide (N2O), nitric oxide (NO) and nitrogen dioxide
(NO2) play an important role by affecting the oxidising
ca-pacity of the troposphere (NO and NO2), by affecting
ecosys-tems through deposition (NO2and derivates) or by acting as
a greenhouse gas (N2O).
Forests cover a large part of the European continent (ap-prox. 35%), but the exchange of nitrogen oxides (NO, N2O
and NO2) has so far only been investigated in a few
Euro-pean forests. These studies in N-affected forests in Central (Butterbach-Bahl et al., 1997; van Dijk and Duyzer, 1999; Brumme and Beese, 1992; Gasche and Papen, 1999) and Northern Europe (Pilegaard et al., 1999; Skiba et al., 1998) have shown that European forests have a much higher NO and N2O emission than other temperate forests in the world
(Williams et al., 1992; Castro et al., 1993). It has been sug-gested that the high emissions found in European forests are due to the high atmospheric N-input to these forests. The contribution of oxidised and reduced nitrogen species to the total deposition varies according to location, and is dominated by NH3in intensively farmed countries (e.g. The
Netherlands), but by oxidised species in the remote parts of Europe. Comparing earlier results from forest sites with dif-ferent N-input (Butterbach-Bahl et al., 1997) and studies of NO and N2O emission at various distances from poultry and
pig farms support this hypothesis (Skiba et al., 1998). The limited information on the impact of anthropogenic influences like e.g. atmospheric N-deposition on N-trace gas emissions from forest soils, the limited number of field stud-ies, restricted temporal coverage of field measurements and the lack of information on the effect of forest types on the magnitude of N-oxides emissions from forest ecosystems are the reasons why the contribution of forest ecosystems to re-gional and global budgets of atmospheric N2O and NO still
have a high degree of uncertainty.
NO and N2O emissions are known to vary considerably
with both soil temperature and soil moisture and are there-fore strong functions of climate (Smith et al., 1998; Pile-gaard et al., 2001). However, the relationships are not simple and not the same for NO and N2O. It is therefore important
to study these relationships over a range of climates at long time-scales to cover different seasons for each locality.
In this paper we report the results of continuous measure-ments of NO and N2O emissions at 15 different forest sites
as part of the EU-funded project NOFRETETE. The mea-surements were made by chamber methods, either by man-ual measurements or by fully automated systems at a high frequency (up to hourly) throughout at least an entire year. Emission measurements were carried out using either the dy-namic (NO) or the static chamber (N2O) technique. The
locations chosen include different types of forests (conifer-ous and decidu(conifer-ous) in different European climates, ranging from boreal to temperate continental forests and from At-lantic to Mediterranean forests. Furthermore the sites dif-fer in atmospheric N-deposition ranging from low deposi-tion (0.2 g N m−2a−1) to high deposition (∼4 g N m−2a−1). We relate annual mean emission rates of NO and N2O to the
main parameters soil temperature, soil moisture, C/N ratio, pH, nitrogen deposition, and stand age. Temporal variation throughout the year is not dealt with here, but will be treated in site-specific papers (e.g. Ferr´e et al., 2005; Horv´ath et al.,
2005; Kitzler et al., 2005a,b; Rosenkranz et al., 2006).
2 Materials and methods
2.1 Sites
An overview of the 15 forest sites is given in Table 1 and Fig. 1 and some characteristics of the sites is given in Table 2. The sites range from Finland in the north to Italy in the south and from Scotland in the west to Hungary in the east. The sites investigated represent different forest types:
Coniferous forests: Scots pine (Pinus silvestris), Finland; Sitka spruce (Picea sitch´ensis), Scotland; Norway spruce (Picea abies), Germany, Austria, Hungary; Douglas fir (Pseudotsuga menzi´esii viridis), The Netherlands; Mediter-ranean pine (Pinus pinaster), Italy.
Deciduous forests: birch (Betula pub´escens), Scotland; beech (Fagus sylvatica), Denmark, Germany, Austria; ses-sile oak (Quercus petraea), Hungary; poplar (Populus sp.), Italy; mixed forest with black poplar (Populus nigra), aspen (Populus tremuloides), white willow (Salix alba), and com-mon alder (Alnus glutinosa), Italy.
At three locations, Glencorse (Scotland), H¨oglwald (Ger-many), and M´atra mountains (Hungary) both coniferous and deciduous forest sites were investigated.
2.2 Flux measurements
The soil emissions of NO and N2O were measured with the
chamber technique (e.g. Butterbach-Bahl et al., 1997; Pile-gaard et al., 1999; van Dijk and Duyzer, 1999). NO was measured with dynamic chambers and the flux was estimated by comparing the steady-state concentration in the cham-ber with a reference measurement or by using the full mass balance equation (Altimir et al., 2002). In some cases the reference measurement was made in a chamber similar to the measurement chambers but shielded from the soil with a cover of the same material; in other cases the reference measurement was made of the incoming ambient air and cor-rections for wall losses in chamber and tubes were made. NO was analysed by chemiluminescence technique. Because O3
interacts with the NO emitted from the soil it was analysed simultaneously and any loss of NO due to this reaction was corrected for (Remde et al., 1993). N2O was measured using
manual and/or automatic static chambers. Headspace N2O
concentrations were analysed by gas chromatography (elec-tron capture detector) either in the field or in the laboratory.
Characteristics of the chamber systems applied for flux measurements at the different sites are given for NO in Ta-ble 3 and for N2O in Table 4. The use of a reference
cham-ber is indicated by “+1” in the column giving the numcham-ber of chambers simultaneously in use. The chambers were mounted on frames previously inserted into the soil. At some sites chambers were moved among different sets of frames, indicated in Tables 3 and 4 by a larger number of frames than
chambers. The tables give references to the specific methods applied at each site.
2.3 Additional measurements
Nitrogen deposition was measured by analysing concentra-tions of NO−3 and NH+4 in throughfall collected with a large number of funnels or with specially designed throughfall col-lectors. In deciduous forests stem-flow was also collected and analysed for NO−3 and NH+4 concentrations and the val-ues were added to the throughfall to give the input to the forest floor. Soil moisture was measured by TDR probes and soil temperature by thermocouples. C/N ratio, pH, and bulk density (for calculation of water filled pore space, WFPS) was measured in the upper 0–5 cm of the mineral soil. 2.4 Data analysis
The relationships between fluxes and the main parameters were investigated by stepwise multiple regression analysis using the S-PLUS statistical software (Insightful Corp.).
3 Results
The annual average emissions of NO (Table 5) ranged from below detection limit to 81.7 µg N m−2h−1. The
highest emissions were found in the H¨oglwald spruce forest followed by the Speulderbos Douglas fir forest (75.2 µg N m−2h−1) and the lowest in the Hyyti¨al¨a Scots pine forest (0.006 µg N m−2h−1) and the Parco Ticino mixed forest (below detection limit). Emissions of N2O ranged
from 0.3 to 20.3 µg N m−2h−1with the highest values found in the oak forest in the M´atra mountains followed by the Parco Ticino poplar forest (19.7 µg N m−2h−1) and the low-est values in Hyyti¨al¨a, San Rossore (2.1 µg N m−2h−1) and Speulderbos (2.3 µg N m−2h−1).
Atmospheric nitrogen deposition at the 15 field sites inves-tigated ranged between 0.22 g m−2a−1 and 3.85 g m−2a−1 with the highest value for the Speulderbos forest in The Netherlands and the lowest value for the Hyyti¨al¨a forest in Finland (Table 5). The average nitrogen deposition to coniferous forests (1.6±0.5 g N m−2a−1) was similar to deciduous forests (1.5±0.2 g N m−2a−1).
On average coniferous forests showed much higher emission of NO (31.0±15.6 µg N m−2h−1) than
decid-uous forests (4.1±1.9 µg N m−2h−1). For N2O it
was found that the deciduous forests had higher emis-sion (11.3±2.2 µg N m−2h−1) than the coniferous forests (6.6±2.3 µg N m−2h−1).
The results of the regression analyses of the emissions of NO and N2O, the sum of NO and N2O and the ratio between
NO and N2O with the parameters nitrogen deposition, forest
type, age, C/N, pH, soil temperature and WFPS are given in Table 6. In analyses of NO emission, values from the Italian sites were excluded, because of the very few measurements
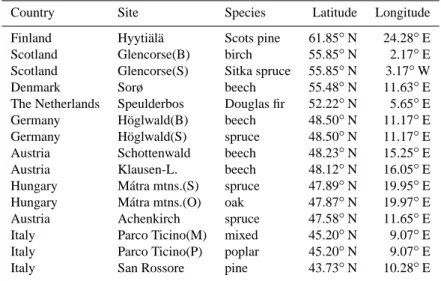
Table 1. Geographical location, and tree species of forest field sites for continuous measurements of NO and N2O fluxes. Country Site Species Latitude Longitude
Finland Hyyti¨al¨a Scots pine 61.85◦N 24.28◦E Scotland Glencorse(B) birch 55.85◦N 2.17◦E Scotland Glencorse(S) Sitka spruce 55.85◦N 3.17◦W Denmark Sorø beech 55.48◦N 11.63◦E The Netherlands Speulderbos Douglas fir 52.22◦N 5.65◦E Germany H¨oglwald(B) beech 48.50◦N 11.17◦E Germany H¨oglwald(S) spruce 48.50◦N 11.17◦E Austria Schottenwald beech 48.23◦N 15.25◦E Austria Klausen-L. beech 48.12◦N 16.05◦E Hungary M´atra mtns.(S) spruce 47.89◦N 19.95◦E Hungary M´atra mtns.(O) oak 47.87◦N 19.97◦E Austria Achenkirch spruce 47.58◦N 11.65◦E Italy Parco Ticino(M) mixed 45.20◦N 9.07◦E Italy Parco Ticino(P) poplar 45.20◦N 9.07◦E Italy San Rossore pine 43.73◦N 10.28◦E
Table 2. Characteristics of forest field sites.
Site Type Age C/N pH Soil Soil WFPS Precipitation temperature moisture years ◦C %v/v % mm a−1 Hyyti¨al¨a coniferous 41 37.7 3.3 4.6 26.3 38 500 Glencorse(B) deciduous 19 13.8 5.1 6.6 31.4 44 1047 Glencorse(S) coniferous 19 13.8 5.1 6.3 25.9 36 1047 Sorø deciduous 84 17.7 4.5 7.6 24.6 36 845 Speulderbos coniferous 43 24.5 3.7 9.4 17.9 31 721 H¨oglwald(B) deciduous 87 15.8 3.4 8.3 937 H¨oglwald(S) coniferous 96 18.8 3.2 8.6 31.5 56 937 Schottenwald deciduous 141 13.4 4.3 8.1 27.0 60 509 Klausen-L. deciduous 60 16.0 5.0 8.4 41.0 59 612 M´atra mtns.(S) coniferous 39 12.9 3.6 5.6 26.0 53 817 M´atra mtns.(O) deciduous 74 13.5 4.7 8.2 26.0 59 817 Achenkirch coniferous 126 18.0 7.0 6.2 50.2 60 1355 Parco Ticino(M) deciduous 150 17.9 4.6 12.2 30.7 44 825 Parco Ticino(P) deciduous 13 15.3 6.4 13.9 29.3 51 825 San Rossore coniferous 38 29.9 6.5 14.0 11.1 21 959
from these sites. NO emission was dependent on forest type and positively correlated with nitrogen deposition. The parameter WFPS was tested for curvature by including a quadratic term, but this was not significant. Separately per-formed regression analyses for deciduous and coniferous forests showed, however, that the relationship between ni-trogen deposition and NO emission was only significant for the coniferous forests (NO (µg N m−2h−1)=−13.9+25.5∗[N deposition (g m−2a−1)], r2=0.82). The relationships be-tween NO emission and N deposition are shown in Fig. 2.
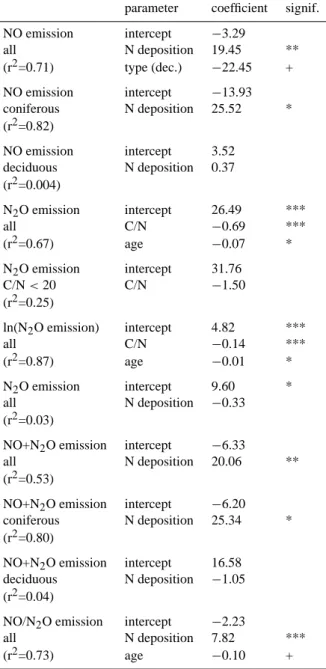
The N2O emission was significantly negatively correlated
with both the C/N ratio and the age of the stands (Table 6 and Fig. 3); a logarithmic transformation of N2O emission
improved the significance of the correlation. Restricting the
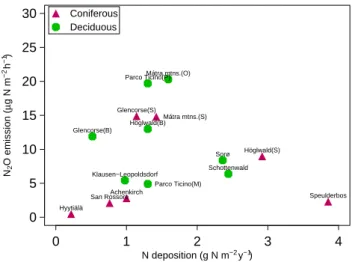
analysis to sites with C/N<20, because very little nitrifica-tion occurs above this threshold, resulted in a non-significant regression. There was no significant correlation between the N2O emission and the nitrogen deposition (Fig. 4).
The sum of NO and N2O was positively correlated with
nitrogen deposition (Fig. 5) although when split into forest types only for the coniferous stands (Table 6). The amount of N-oxides emitted relative to total N deposition ranged from 2% (Hyyti¨al¨a) to 32% (Glencorse spruce). The sum (NO+N2O) was not significantly correlated with any other of
the investigated parameters.
The NO/N2O ratio was positively correlated with nitrogen
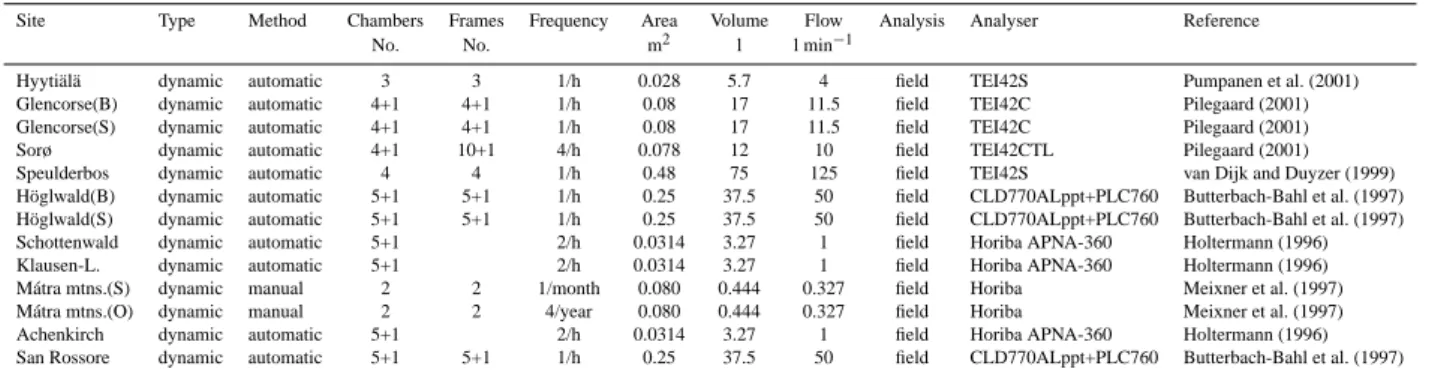
Table 3. Characteristics of chamber systems used in NO flux measurements.
Site Type Method Chambers Frames Frequency Area Volume Flow Analysis Analyser Reference No. No. m2 l l min−1
Hyyti¨al¨a dynamic automatic 3 3 1/h 0.028 5.7 4 field TEI42S Pumpanen et al. (2001) Glencorse(B) dynamic automatic 4+1 4+1 1/h 0.08 17 11.5 field TEI42C Pilegaard (2001) Glencorse(S) dynamic automatic 4+1 4+1 1/h 0.08 17 11.5 field TEI42C Pilegaard (2001) Sorø dynamic automatic 4+1 10+1 4/h 0.078 12 10 field TEI42CTL Pilegaard (2001) Speulderbos dynamic automatic 4 4 1/h 0.48 75 125 field TEI42S van Dijk and Duyzer (1999) H¨oglwald(B) dynamic automatic 5+1 5+1 1/h 0.25 37.5 50 field CLD770ALppt+PLC760 Butterbach-Bahl et al. (1997) H¨oglwald(S) dynamic automatic 5+1 5+1 1/h 0.25 37.5 50 field CLD770ALppt+PLC760 Butterbach-Bahl et al. (1997) Schottenwald dynamic automatic 5+1 2/h 0.0314 3.27 1 field Horiba APNA-360 Holtermann (1996) Klausen-L. dynamic automatic 5+1 2/h 0.0314 3.27 1 field Horiba APNA-360 Holtermann (1996) M´atra mtns.(S) dynamic manual 2 2 1/month 0.080 0.444 0.327 field Horiba Meixner et al. (1997) M´atra mtns.(O) dynamic manual 2 2 4/year 0.080 0.444 0.327 field Horiba Meixner et al. (1997) Achenkirch dynamic automatic 5+1 2/h 0.0314 3.27 1 field Horiba APNA-360 Holtermann (1996) San Rossore dynamic automatic 5+1 5+1 1/h 0.25 37.5 50 field CLD770ALppt+PLC760 Butterbach-Bahl et al. (1997)
Table 4. Characteristics of chamber systems used in N2O flux measurements.
Site Type Method Chambers Frames Frequency Area Volume Analysis Analyser Reference
No. No. m2 l
Hyyti¨al¨a static manual 2 6 2/month 0.116 32.48 laboratory HP-GC 6890 Syv¨asalo et al. (2004) Glencorse(B) static manual 4 4 4 campaigns 0.14 25 laboratory HP-GC-5890 MacDonald et al. (1998) Glencorse(B) static semi-automatic 1 1 1/day 1 72 laboratory HP-GC-5890 MacDonald et al. (1998) Glencorse(S) static manual 4 4 4 campaigns 0.14 25 laboratory HP-GC-5890 MacDonald et al. (1998) Glencorse(S) static semi-automatic 1 1 1/day 1 72 laboratory HP-GC-5890 MacDonald et al. (1998) Sorø static manual 6 6 2/month 0.071 8 laboratory Shimadzu 14b w/ECD Ambus et al. (2001) Sorø static semi-automatic 1 1 1/day 0.49 60 laboratory Shimadzu 14b w/ECD Ambus et al. (2001) Speulderbos static automatic 4 4 1/hour 0.48 75 field Chompack cp-9001 GC63Ni-ECD Duyzer (1995)
H¨oglwald(B) static automatic 5 5 2/hour 0.25 37.5 field Shimadzu 14a w/ECD Butterbach-Bahl et al. (1997) H¨oglwald(S) static automatic 5 5 2/hour 0.25 37.5 field Shimadzu 14a w/ECD Butterbach-Bahl et al. (1997) Schottenwald static manual 4 4 2/month 1.0 80 laboratory GC-63Ni ECD H¨artel et al. (2002)
Schottenwald static semi-automatic 1 1 1/day 0.49 49 laboratory GC-63Ni ECD
Klausen-L. static manual 4 4 1/month 1.0 80 laboratory GC-63Ni ECD H¨artel et al. (2002) Klausen-L. static semi-automatic 1 1 1/day 0.49 49 laboratory GC-63Ni ECD
M´atra mtns.(S) static manual 8 8 2/month 0.0080 0.4 laboratory HP-GC 5890 + HP-MS 5972 Christensen et al. (1990) M´atra mtns.(O) static manual 8 8 2/month 0.0080 0.4 laboratory HP-GC 5890 + HP-MS 5972 Christensen et al. (1990) Achenkirch static manual 4 4 2/month 1.0 80 laboratory GC-63Ni ECD H¨artel et al. (2002)
Achenkirch static semi-automatic 1 1 1/day 0.49 49 laboratory GC-63Ni ECD
Parco Ticino(M) static manual 4 4 2/month 0.13 28 laboratory Shimadzu GC14B Leip (2000) Parco Ticino(M) static semi-automatic 1 1 1/day 0.46 60 laboratory Shimadzu GC14B
Parco Ticino(P) static manual 4 4 2/month 0.13 28 laboratory Shimadzu GC14B Leip (2000) Parco Ticino(P) static semi-automatic 1 1 1/day 0.46 60 laboratory Shimadzu GC14B
San Rossore static manual 4 8 2/month 0.13 28 laboratory Shimadzu GC14B Leip (2000) San Rossore static semi-automatic 1 1 1/day 0.46 60 laboratory Shimadzu GC14B
At three locations (Glencorse, H¨oglwald and M´atra moun-tains) both deciduous and coniferous forests were investi-gated. At Glencorse and H¨oglwald the coniferous sites had higher N deposition as compared to the deciduous sites. In addition, NO emission was highest at coniferous sites at both locations, whereas N2O emission was highest at the spruce
site in Glencorse, but lowest at the spruce site in H¨oglwald. The differences in both deposition and NO emission between the two forests in the M´atra mountains were much smaller whereas the difference in the magnitude of N2O emission
between the two sites was substantial (Table 5) with the oak site having the highest emission.
4 Discussion
In this investigation we related annual mean emission rates of NO and N2O to the parameters soil temperature, soil
mois-ture, C/N ratio, pH, nitrogen deposition, forest type, and
stand age. The study showed that when comparing annual emission rates over a larger regional area the most important parameters for NO were nitrogen deposition and forest type, and for N2O the most important parameteres were C/N
ra-tio and stand age. The parameters normally explaining most of the temporal variation within a single site (soil tempera-ture and soil moistempera-ture) had less influence on the mean annual emission rates at the regional scale.
The question of whether predictive understanding of N2O
fluxes can be increased by examining relationships between fluxes and environmental parameters at larger spatial and temporal scales was also addressed by Groffman et al. (2000). They compared relationships between annual rather than hourly or daily fluxes and ecosystem-scale variables such as plant community and soil type and annual climate rather than field-scale variables such as soil moisture and temperature. They found that there were coherent patterns in annual N2O flux at the ecosystem scale in forest,
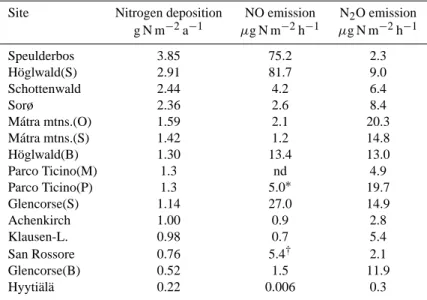
Table 5. Annual nitrogen deposition (NO−3+NH+4) in throughfall (g N m−2a−1) and average emission of NO and N2O (µg N m−2h−1) from forests in Europe listed in the order of deposition. Data from July 2002–June 2003, except Speulderbos September 2002–August 2003, and NO in Sorø May 2003–April 2004. nd=below detection limit.
Site Nitrogen deposition NO emission N2O emission g N m−2a−1 µg N m−2h−1 µg N m−2h−1 Speulderbos 3.85 75.2 2.3 H¨oglwald(S) 2.91 81.7 9.0 Schottenwald 2.44 4.2 6.4 Sorø 2.36 2.6 8.4 M´atra mtns.(O) 1.59 2.1 20.3 M´atra mtns.(S) 1.42 1.2 14.8 H¨oglwald(B) 1.30 13.4 13.0 Parco Ticino(M) 1.3 nd 4.9 Parco Ticino(P) 1.3 5.0∗ 19.7 Glencorse(S) 1.14 27.0 14.9 Achenkirch 1.00 0.9 2.8 Klausen-L. 0.98 0.7 5.4 San Rossore 0.76 5.4† 2.1 Glencorse(B) 0.52 1.5 11.9 Hyyti¨al¨a 0.22 0.006 0.3
∗Based on 2 measurements in August and November 2002
†Based on continuous measurements during 23 April–4 June 2003 and 28 October–3 December 2003 (Rosenkranz et al., 2006)
controls of N2O flux vary within and between regions and
only emerge with continuous (at least daily) flux measure-ments over multiple years. Compared to the analysis of Groffman et al. (2000) the present investigation deals with both NO and N2O, measured within the same time-period
and with a high frequency.
4.1 Effects of soil moisture and temperature
Production of NO and N2O in soils is primarily driven by
microbial processes such as nitrification and denitrification (Firestone and Davidson, 1989), therefore soil temperature is a key variable affecting the emission rates of both gases. Emissions of both NO (Slemr and Seiler, 1984) and N2O
(Skiba et al., 1998; Smith et al., 1998) increase with in-creasing soil temperature due to the fact that rates of enzy-matic processes generally increase with temperature as long as other factors (e.g. substrate or moisture) are not limiting. Soil water acts as a transport medium for NO−3 and NH+4 and influences the rate of O2 supply and thereby controls
whether aerobic processes such as nitrification or anaerobic processes such as denitrification dominate within the soil. While N2O emissions are known to increase at higher
wa-ter contents through larger losses from denitrification (Wolf and Russow, 2000; Papen and Butterbach-Bahl, 1999) the relationship between the NO flux and the soil water is more complex. Due to limited substrate diffusion at very low water content and limited gas diffusion at high water content, nitric oxide emissions are suspected to have a maximum at low to
medium soil water content. Ludwig et al. (2001) suggested an optimum of NO emissions at approximately 20% WFPS and a strong decrease towards extreme moisture conditions. However, other studies reported maximum NO fluxes be-tween 43% and 85% WFPS (Ormeci et al., 1999; van Dijk and Duyzer, 1999; Gasche and Papen, 1999).
The effects of soil moisture and temperature on NO and N2O emission were studied in a laboratory experiment
with soil cores from some of the same field sites as in the present study (Parco Ticino(M), Schottenwald, Klausen-Leopoldsdorf, Achenkirch, H¨oglwald (spruce) and Hyyti¨al¨a) (Schindlbacher et al., 2004) . Soil moisture and tempera-ture explained most of the variations in NO (up to 74%) and N2O (up to 86%) emissions for individual soils. NO
and N2O were emitted from all soils except from the
bo-real pine forest soil in Finland, where the laboratory exper-iment showed that NO was consumed. NO emissions from the German spruce forest ranged from 1.3 to 608.9 µg NO-N m−2h−1and largely exceeded emissions from other soils.
Average N2O emissions from this soil tended also to be
high-est (171.7±42.2 µg N2O-N m−2h−1), but did not differ
sig-nificantly from other soils. NO and N2O emissions showed a
positive exponential relationship to soil temperature. The re-sults from the annual averages of field data did not show any significant relationship to soil temperature for neither for NO nor for N2O emission.
Schindlbacher et al. (2004) also showed that N2O
emis-sions increased with increasing WFPS or decreasing wa-ter tension, respectively. Maximum N2O emissions were
Table 6. Regression coefficients. Units as given in Tables 2 and 5.
Significance: ***p<0.001; **p< 0.01; *p<0.05; +p<0.1. parameter coefficient signif. NO emission intercept −3.29 all N deposition 19.45 ** (r2=0.71) type (dec.) −22.45 + NO emission intercept −13.93 coniferous N deposition 25.52 * (r2=0.82) NO emission intercept 3.52 deciduous N deposition 0.37 (r2=0.004) N2O emission intercept 26.49 *** all C/N −0.69 *** (r2=0.67) age −0.07 * N2O emission intercept 31.76 C/N < 20 C/N −1.50 (r2=0.25) ln(N2O emission) intercept 4.82 *** all C/N −0.14 *** (r2=0.87) age −0.01 * N2O emission intercept 9.60 * all N deposition −0.33 (r2=0.03)
NO+N2O emission intercept −6.33
all N deposition 20.06 ** (r2=0.53)
NO+N2O emission intercept −6.20 coniferous N deposition 25.34 * (r2=0.80)
NO+N2O emission intercept 16.58 deciduous N deposition −1.05 (r2=0.04)
NO/N2O emission intercept −2.23
all N deposition 7.82 *** (r2=0.73) age −0.10 +
measured between 80 and 95% WFPS or 0 kPa water ten-sion. The optimal moisture for NO emission differed signif-icantly between the soils, and ranged between 15% WFPS in sandy Italian floodplain soil and 65% in loamy Austrian beech forest soils. For the field data WFPS was not a signif-icant parameter for N2O emission, but had a positive
signifi-cant effect on NO emission. The annual average WFPS in the field was higher than the optima found for NO in the labora-tory experiment, but since not all field sites were studied in the laboratory it is difficult to provide a general conclusion.
0 1 2 3 4 0 20 40 60 80 100 N deposition (g N m−2 y−1) NO emission ( µ g N m −2 h −1) Speulderbos Schottenwald Höglwald(S) Höglwald(B) Mátra mtns.(O) Glencorse(S) Glencorse(B) Klausen−L.
Hyytiälä Achenk.Mátra mtns.(S) Sorø
Coniferous Deciduous
Fig. 2. NO emission (µg N m−2h−1) as a function of
nitro-gen deposition (g N m−2a−1). Regression lines (solid=significant, dashed=non significant) for coniferous and deciduous sites, respec-tively. C/N 10 15 20 25 30 35 40 0 5 10 15 20 N2 O emission ( µ g N m −2 h −1) Speulderbos Schottenwald Höglwald(S) Glencorse(S) Parco Ticino(M) Parco Ticino(P) San Rossore Achenkirch Hyytiälä Sorø Mátra mtns.(S) Coniferous Deciduous
Fig. 3. N2O emission (µg N m−2h−1) as a function of C/N ratio.
The full line represents a linear regression of the full data set and the dotted line a linear regression of sites witn C/N<20 (non signif-icant).
In general, rather clear relationships between nitrogen ox-ides emission and soil moisture and soil temperature can be found within a single locality when studying short-term variations. However, using the same parameters when com-paring annual values from different localities within a large region as in this study does not necessarily reveal compa-rable relationships since other factors such as soil proper-ties, stand age, and site hydrological conditions interfere. Equally, in a study of 18 European forests Janssens et al. (2001) found large differences in observed annual soil respi-ration and total ecosystem respirespi-ration, but despite good cor-relations with temperature within the single forests, the dif-ferences between the forests were not correlated with mean
0 1 2 3 4 0 5 10 15 20 25 30 N deposition (g N m−2 y−1) N2 O emission ( µ g N m −2 h −1) Speulderbos Schottenwald Höglwald(S) Sorø Höglwald(B) Mátra mtns.(O) Glencorse(S) Parco Ticino(P) San Rossore Klausen−Leopoldsdorf Achenkirch Glencorse(B) Hyytiälä Mátra mtns.(S) Parco Ticino(M) Coniferous Deciduous
Fig. 4. N2O emission (µg N m−2h−1) as a function of nitrogen
deposition (g N m−2a−1).
annual temperature. They hypothesised that differences in soil respiration among forests are likely to depend more on forest productivity rather than on temperature.
4.2 Effects of C/N ratio and pH
This study showed a significant negative correlation between N2O emission and the C/N ratio (Fig. 3). This is in
accor-dance with the laboratory studies by Ambus et al. (2006). No significant effects of pH could be found, but there was a (non significant) negative correlation between pH and ni-trogen input, which could be due to the acidifying effect of NH+4 in soil. Consistently, the sites with high NO emission also had a low pH (Speulderbos, H¨oglwald), but a low pH in itself did not seem to lead to high emission (Hyyti¨al¨a).
Klemedtsson et al. (2005) found a strong negative relation-ship between N2O emissions and soil C/N ratios in forested
histosols in Sweden. A decaying exponential equation could describe the relationship and was validated with published data from similar sites in Finland and Germany. They found that at low C/N ratios below 15–20 other parameters such as climate, pH and groundwater tables increase in importance as predictors for N2O emission. A similar negative relationship
was found between net nitrification and C/N ratio in spruce and beech forests throughout Europe (Persson et al., 2000). In the study it was also found that no net nitrifcation could be detected when the C/N ratio exceeded 28 which is consistent with the low emissions found from the soils in San Rossore and Hyyti¨al¨a.
4.3 Effects of increased N-input
This study showed significant positive correlations between input of nitrogen to forests and NO emission (Fig. 2) and the sum of NO and N2O (Fig. 5), but no significant
relation-ship for N2O (Fig. 4). Clear relationships have been reported
0 1 2 3 4 0.0 0.2 0.4 0.6 0.8 1.0 N deposition (g N m−2 y−1) NO+N 2 O emitted ( g N m −2 y −1) Speulderbos Höglwald(S) Sorø Mátra mtns.(S) Höglwald(B) Glencorse(S) Klausen−Leopoldsdorf Achenkirch Glencorse(B) Hyytiälä Schottenwald Mátra mtns.(O) Coniferous Deciduous
Fig. 5. Sum of N-oxides emitted as a function of nitrogen deposition
(g N m−2a−1). Regression lines (solid=significant, dashed=non significant) for coniferous and deciduous sites, respectively.
previously when comparing the temporal variation in nitro-gen deposition at a single site by e.g. Butterbach-Bahl et al. (1997). However, increased nitrogen input does not always lead to enhanced microbial activity. In an experiment with chronic N additions to forest ecosystems (Burton et al., 2004) it was found that soil N availability was enhanced, but after an initial increase soil respiration was reduced probably due to reduced decomposition activity of the microbial commu-nity.
The N2O emission from Speulderbos was very low
con-sidering the high nitrogen input (Fig. 4). This can, however, be explained by the very low N-mineralisation and nitrifica-tion rate of this soil (Ambus et al., 2006), which is probably due to the rather poor sandy soil. Furthermore, the dense canopy at this site reduced soil moisture, so that conditions favourable for denitrification do not often prevail. The other sites showing very low N2O emission were Hyyti¨al¨a and San
Rossore, which also had a soil with low biological activity, but also a much lower N input.
4.4 Effects of forest type and tree species
The difference between the nitrogen oxides emissions from deciduous and coniferous forest soils found in the present study can most likely be explained by differences in soil and litter properties in the two main types of forests. Laboratory studies on N2O emission from soils collected in several of the
current study sites also confirmed higher emissions from de-ciduous sites compared with coniferous sites (Ambus et al., 2006). A number of other studies have shown similar differ-ences between forest types and tree species (e.g. Butterbach-Bahl et al., 1997, 2002; Gasche and Papen, 1999; Papen and Butterbach-Bahl, 1999).
In a northwestern Connecticut forest, Finzi et al. (1998) quantified the C and N content of the forest floor and the
top mineral soil and the rate of net N mineralisation beneath six different tree species. Large differences among species in the size of the forest floor C and N pools and in net N mineralisation rates were found and explained by interspe-cific differences in litter production and quality. The ef-fects of five different tree species on soil respiration, gross N mineralisation and gross nitrification rates were investi-gated in pure tree stands in a species trial in Jutland, Den-mark (Br¨uggemann et al., 2005). The highest rates of soil respiration, gross N mineralisation and gross nitrification were found in the organic layer under spruce, followed by beech>larch>oak>pine.
Consistently elevated fluxes of NO from coniferous for-est soil were found in an experiment with addition of N (+50 kg N ha−1a−1 and +150 kg N ha−1a−1) to coniferous
and deciduous forest soils (Venterea et al., 2003). Only the application of the higher amount of N-fertilizer had an effect on NO flux from the deciduous forest soil. Treatment effects on N2O flux were much smaller and no difference between
forest types could be seen. From this experiment it was con-cluded that atmospheric deposition may result in increased NO emission from forest soils by promoting nitrification, and that the response may vary significantly between forest types under similar climatic regimes. These results confirm the re-lationship between nitrogen deposition and the difference of forest types found in the present study.
There are several possible reasons for the difference in N-oxide emission between coniferous and deciduous forests. N-deposition (in throughfall) is often substantially (2–3 times) higher in coniferous forests than in deciduous forest due to their better filtering capacity of the air (higher leaf area index, evergreen) (Rothe et al., 2002). Some factors of the coniferous forest floor favour nitrification and thus NO emission; i.e. soil moisture is generally lower at coniferous forests (at least during spring time), they produce a thick well aerated litter layer, and the lower pH might lead to NO pro-duction from chemical decomposition of NO−2 (van Cleem-put and Baert, 1984). Conversely, higher rates of denitrifica-tion are found in deciduous forests leading to N2O
produc-tion and NO consumpproduc-tion in the soil. However, the rather crude partition into deciduous and coniferous forests might not be sustained since, as documented above, different tree species provide different conditions for nitrogen oxides emis-sion and the effects can not always be clearly split into the groups coniferous/deciduous.
The age of the forest had a significant negative effect on the N2O emission and on the ratio between NO and N2O
emission. Although age is not a real indicator of successional state when comparing different types of forests, this indicates that nitrogen oxides emission is not suppressed by a higher growth rate in younger forests.
5 Conclusions
From a detailed study throughout a year of nitrogen oxides emission from the soil at 15 forest sites across Europe, it was found that coniferous forest soils had much higher NO emis-sions than deciduous forest soils. It was also found that NO emission from coniferous forest soils was highly correlated with the N-input to the soil as measured in throughfall and stem-flow. The NO emission from deciduous forest soils was generally low. The N2O emission was slightly higher in
de-ciduous forests compared to coniferous. The correlation be-tween N2O emission and N-deposition was not significant,
but there was a significant negative correlation between the N2O emission and the C/N ratio. The emission of N in
N-oxides was 2–32% of the amount of N in atmospheric input to the soil. The differences between coniferous and decidu-ous forests are probably partly due to higher N-input to conif-erous forest soils and partly due to differences in litter layer properties.
Many studies have shown that the temporal variation of nitrogen oxides emission on a specific site is clearly related to soil moisture and soil temperature. This study shows that when comparing annual emissions on a regional scale, how-ever, factors such as nitrogen deposition and forest and soil type become much more important.
Acknowledgements. The NOFRETETE project was funded by the
EU commission under the contract no. EVK2-CT2001-00106. Edited by: F. X. Meixner
References
Aber, J. D.: Nitrogen cycling and nitrogen saturation in temperate forest ecosystems, Tree, 7, 220–224, 1992.
Aber, J. D., Nadelhofer, K. J., Steudler, P., and Melillo, J. M.: Ni-trogen saturation in northern forest ecosystems, BioScience, 39, 378–386, 1989.
Altimir, N., Vesala, T., Keronen, P., Kulmala, M., and Hari, P.: Methodology for direct field measurements of ozone flux to fo-liage with shoot chambers, Atmos. Environ., 36, 19–29, 2002. Ambus, P., Jensen, J., Priem´e, A., Pilegaard, K., and Kjøller, A.:
Assessment of CH4and N2O fluxes in a Danish beech (Fagus
sylvatica) forest and an adjacent N-fertilised barley (Hordeum vulgare) field: effects of sewage sludge amendments, Nutrient
Cycling in Agroecosystems, 60, 15–21, 2001.
Ambus, P., Zechmeister-Boltenstern, S., and Butterbach-Bahl, K.: Relationship between nitruous oxide production and nitrogen cy-cling in European forests, Biogeosciences, 3, 135–145, 2006, http://www.biogeosciences.net/3/135/2006/.
Beck, W.: Ver¨anderungen im Wachstumsverhalten von Kiefer und Buche im nordostdeutschen Tiefland in Abh¨angigheit von Fremdstoffeintrag und Witterung, in 9. Hamburger Forst- und Holtztagung 1996, 73–96, Bundesforschungsantalt f¨ur Forst- und Holtzwirtschaft, Hamburg, 1996.
Br¨uggemann, N., Rosenkranz, P., Papen, H., Pilegaard, K., and Butterbach-Bahl, K.: Pure stands of temperate forest tree species
modify soil respiration and N turnover, Biogeosciences Discuss., 2, 303–331, 2005,
http://www.biogeosciences-discuss.net/2/303/2005/.
Brumme, R. and Beese, F.: Effects of liming and nitrogen fertiliza-tion on emissions of CO2and N2O from a temperate forest, J. Geophys. Res., 96, 9321–9328, 1992.
Burton, J. L., Pregitzer, K. S., Crawford, J. N., Zogg, G. P., and Zak, D. R.: Simulated chronic NO−3 deposition reduces soil res-piration in northern hardwood forests, Global Change Biol., 10, 1080–1091, 2004.
Butterbach-Bahl, K., Gasche, R., Breuer, L., and Papen, H.: Fluxes of NO and N2O from temperate forest soils: Impact of forest type, N deposition and of liming on the NO and N2O emissions, Nutrient Cycling in Agroecosystems, 48, 79–90, 1997.
Butterbach-Bahl, K., Rothe, A., and Papen, H.: Effect of tree dis-tance on N2O and CH4– fluxes from soils in temperate forest ecosystems, Plant and Soil, 240, 91–103, 2002.
Castro, M. S., Steudler, P. A., Melillo, J. M., Aber, J. D., and Mill-hamet, S.: Exchange of N2O and CH4between the atmosphere and soils in spruce-fir forests in Northeastern United States, Bio-geochemistry, 18, 119–135, 1993.
Christensen, S., Simkins, S., and Tiedje, J. M.: Spatial variation in denitrification: Dependency of activity centers on the soil envi-ronment, Soil Sci. Soc. Am. J., 54, 1608–1613, 1990.
Dise, N. B. and Wright, R. F.: Nitrogen leaching from European forests in relation to nitrogen deposition, Forest Ecol. Manage., 71, 153–161, 1995.
Duyzer, J. H.: Measurements of the atmospheric emission of N2O from biogenic sources in general and by grassland ecosystems in particular, Tech. Rep. TNO-MEP R 95/213, TNO Institute of Environmental Sciences, 1995.
Fenn, M. E., Poth, M. A., Aber, J. D., Baron, J. S., Bormann, B. T., Johnson, D. W., Lemly, A. D., McNulty, S. G., Ryan, D. F., and Stottlemeyer, R.: Nitrogen excess in North American ecosys-tems: predisposing factors, ecosystem responses, and manage-ment strategies, Ecol. Appl., 8, 1998.
Ferr´e, C., Leip, A., Matteucci, G., Previtali, F., and Seufert, G.: Impact of 40 years poplar cultivation on soil carbon stocks and greenhouse gas fluxes, Biogeosciences Discuss., 2, 897–931, 2005,
http://www.biogeosciences-discuss.net/2/897/2005/.
Finzi, A., van Breemen, N., and Canham, C. D.: Canopy tree–soil interactions within temperate forests: Species effects on soil car-bon and nitrogen, Ecol. Appl., 8, 440–446, 1998.
Firestone, M. K. and Davidson, E. A.: Microbial basis of NO and N2O production and consumption in soil, in: Exchange of trace gases between terrestrial ecosystems and the atmosphere, edited by: Andreae, M. O. and Schimel, D. S., 7–21, John Wiley & Sons Ltd., Chichester, U.K., 1989.
Gasche, R. and Papen, H.: A 3-year continuous record of nitrogen trace gas fluxes from untreated and limed soil of a N-saturated spruce and beech forest ecosystem in Germany 2. NO and NO2 fluxes, J. Geophys. Res., 104, 18 505–18 520, 1999.
Groffman, P., Brumme, R., Butterbach-Bahl, K., Dobbie, K. E., Mosier, A. R., Ojima, D., Papen, H., Parton, W. J., Smith, K. A., and Wagner-Riddle, C.: Evaluating annual nitrous oxide fluxes at the ecosystem scale, Global Biogeochem. Cycles, 14, 1061– 1070, 2000.
H¨artel, C., Zechmeister, S., and Gerzabek, M.: Gaseous nitrogen
losses from a forest site in the north Tyrolean limestone Alps, Environ. Sci. Pollut. Res., Special Issue, 2, 23–30, 2002. Hofmann, G.: Kiefern¨okosysteme im Wandel, Der Wald, 45, 262–
267, 1995.
Holtermann, C.: A transportable system for the on–line measure-ments of NOx(NO , NO2) -emission from soils, Die Bodenkul-tur, 47, 235–244, 1996.
Horv´ath, L., F¨uhrer, E., and Lajtha, K.: Nitric oxide and nitrous ox-ide emission from Hungarian forest soils; link with atmospheric N-deposition, Biogeosciences Discuss., 2, 703–722, 2005, http://www.biogeosciences-discuss.net/2/703/2005/.
Janssens, I. A., Lankreijer, H., Matteucci, G., Kowalski, A., Buch-mann, N., Epron, D., Pilegaard, K., Kutsch, W., Longdoz, B., Gr¨unwald, T., Montagnani, L., Dore, S., Rebmann, C., Moors, E., Grelle, A., Rannik, ¨U., Morgenstern, K., Clement, R., Gud-mundsson, J., Minerbi, S., Berbigier, P., Ibrom, A., Moncrieff, J., Aubinet, M., Berhofer, C., Jensen, N., Vesala, T., Granier, A., Schulze, E.-D., Lindroth, A., Dolman, A., Jarvis, P., Ceulemans, R., and Valentini, R.: Productivity and disturbance overshadow temperature in determining soil and ecosystem respiration across European forests, Global Change Biol., 7, 269–278, 2001. Kitzler, B., Zechmeister-Boltenstern, S., Holtermann, C., Skiba,
U., and Butterbach-Bahl, K.: Nitrogen oxides emission from two beech forests subjected to different nitrogen loads, Biogeo-sciences, 3, 293–310, 2006,
http://www.biogeosciences.net/3/293/2006/.
Kitzler, B., Zechmeister-Boltenstern, S., Holtermann, C., Skiba, U., and Butterbach-Bahl, K.: Controls over N2O, NOx and CO2 fluxes in a calcareous mountain forest soil, Biogeosciences, 3, 383–395, 2006,
http://www.biogeosciences.net/3/383/2006/.
Klemedtsson, L., von Arnold, K., Weslien, P., and Gundersen, P.: Soil CN ratio as a scalar parameter to predict nitrous oxide emis-sions, Global Change Biol., 11, 1142–1147, 2005.
Kreutzer, K.: Effects of liming on soil processes, Plant and Soil, 168–169, 447–470, 1995.
Kreutzer, K. and Weiss, T.: The H¨oglwald field experiments – aims, concepts and basic data, Plant and Soil, 199, 1–10, 1998. Kristensen, H. L., Gundersen, P., Callesen, I., and Reinds, G. J.:
Throughfall nitrogen deposition has different impacts on soil so-lution nitrate concentration in European coniferous and decidu-ous Forests, Ecosystems, 7, 180–192, 2004.
Leip, A.: Nitrous oxide (N2O) emissions from a coastal catchment in the Delta of the Po river. Measurement and modeling of fluxes from a Mediterranean lagoon and agricultural soil, Tech. Rep. EUR 19052, Office for Official Publications of the European Communities, Luxembourg, 2000.
Ludwig, J., Meixner, F. X., Vogel, B., and F¨orstner, J.: Soil–air ex-change oif nitric oxide: An overview of processes, environmen-tal factors, and modeling studies, Biogeochemistry, 52, 225–257, 2001.
MacDonald, J. A., Skiba, U. M., Sheppard, L. J., Ball, B., Roberts, J. D., Smith, K. A., and Fowler, D.: The effect of nitrogen depo-sition and seasonal variability on methane oxidation and nitrous oxide emission rates in an upland spruce plantation and moor-land, Atmos. Environ., 31, 3693–3706, 1998.
Magill, A. H., Aber, J. D., Hendricks, J. J., Bowden, R. D., Melillo, J. M., and Steudler, P. A.: Biogeochemical response of for-est ecosystems to simulated chronic nitrogen deposition, Ecol.
Appl., 7, 402–415, 1997.
Meixner, F. X., Fickinger, T., Marufu, L., Serca, D., Nathaus, F. J., Makina, E., Mukurumbira, L., and Andreae, M. O.: Preliminary results of nitric oxide emission from a southern African savanna ecosystem, Nutrient Cycling in Agroecosystems, 48, 123–138, 1997.
Ormeci, B., Sanin, S. L., and Peirce, J. J.: Laboratory study of NO flux from agricultural soil: Effects of soil moisture, pH, and tem-perature, J. Geophys. Res., 104, 1621–1629, 1999.
Papen, H. and Butterbach-Bahl, K.: A 3-year continuous record of nitrogen trace gas fluxes from untreated and limed soil of a N-saturated spruce and beech forest ecosystem in Germany – 1. N2O emissions, J. Geophys. Res., D104, 18 487–18 503, 1999. Persson, T., Rudebeck, A., Jussy, J. H., Colin-Belgrand, M., Priem´e, A., Dambrine, E., Karlsson, P. S., and Sj¨oberg, R. M.: Carbon and nitrogen cycling in European forest ecosystems, vol. 142 of Ecological Studies, chap. Soil nitrogen turnover – Minerali-sation, nitrification and denitrification in European forest soils, 297–340, Springer Verlag, 2000.
Pilegaard, K.: Air–soil exchange of NO, NO2, and O3in forests, Water, Air and Soil Pollution: Focus, 1, 79–88, 2001.
Pilegaard, K., Hummelshøj, P., and Jensen, N. O.: Nitric oxide emission from a Norway spruce forest floor, J. Geophys. Res., D(104), 3433–3445, 1999.
Pilegaard, K., Hummelshøj, P., Jensen, N. O., and Chen, Z.: Two years of continuous CO2eddy-flux measurements over a Danish beech forest, Agric. Forest Meteorol., 107, 29–41, 2001. Pitcairn, C. E. R., Skiba, U. M., Sutton, M., Fowler, D., Munro, R.,
and Kennedy, V.: Defining the spatial impacts of poultry farm ammonia emissions on species composition of adjacent wood-land groundflora using Ellenberg Nitrogen Index, nitrous oxide and nitric oxide emissions and foliar nitrogen as marker vari-ables, Environ. Pollut., 199, 9–21, 2002.
Priha, O. and Smolander, A.: Nitrification, denitrification and mi-crobial biomass in soil from two N-fertilized and limed Norway spruce forests, Soil Biol. Biochem., 27, 305–310, 1995. Pumpanen, J., Ilvesniemi, H., Keronen, P., Nissinen, A., Pohja, T.,
Vesala, T., and Hari, P.: An open chamber system for measuring soil surface CO2efflux: Analysis of error sources related to the chamber system, J. Geophys. Res., 106, 7985–7992, 2001. Remde, A., Ludwig, J., Meixner, F., and Conrad, R.: A study to
explain the emission of nitric oxide from a marsh soil, J. Atmos. Chem., 17, 249–275, 1993.
Rosenkranz, P., Br¨uggemann, N., Papen, H., Xu, Z., Seufert, G., and Butterbach-Bahl, K.: N2O, NO and CH4exchange and mi-crobial N turnover over a Mediterranean pine forest soil, Biogeo-sciences, 3, 121–133, 2006,
http://www.biogeosciences.net/3/121/2006/.
Rothe, A., Huber, C., Kreutzer, K., and Weis, W.: Deposition and soil leaching in stands of Norway spruce and European Beech: Results from the H¨oglwald research in comparison with other European case studies, Plant and Soil, 240, 33–45, 2002. Schindlbacher, A., Zechmeister-Boltenstern, S., and
Butterbach-Bahl, K.: Effects of soil moisture and temperature on NO, NO2, and N2O emissions from European forest soils, J. Geophys. Res., 109, D17302, 1–12, 2004.
Schulze, E. D.: Air pollution and forest decline in spruce Picea
abies forest, Science, 244, 776–783, 1989.
Skiba, U., Sheppard, L., Pitcairn, C. E. R., Leith, I., Crossley, A., van Dijk, S., Kennedy, V. H., and Fowler, D.: Soil nitrous oxide and nitric oxide emissions as indicators of elevated atmospheric N deposition rates in seminatural ecosystems, Environ. Pollut., 102, 457–461, 1998.
Slemr, F. and Seiler, W.: Field measurements of NO and NO2 emis-sions from fertilized and unfertilized soils, J. Atmos. Chem., 2, 1–24, 1984.
Smith, K. A., Thomson, P. E., Clayton, H., McTaggart, I. P., and Conen, F.: Effects of temperature, water content and nitrogen fertilisation on emissions of nitrous oxide by soils, Atmos. Envi-ron., 32, 3301–3309, 1998.
Syv¨asalo, E., Regina, K., Pihlatie, M., and Esala, M.: Emissions of nitrous oxide from boreal agricultural clay and loamy sand soil, Nutrient Cycling in Agroecosystems, 69, 155–165, 2004. Umweltbundesamt: Daten zur Umwelt, Tech. rep.,
Umweltbunde-samt, Berlin; Germany, 1997.
van Cleemput, O. and Baert, L.: Nitrite – A key compound in N-loss processes under acid conditions, Plant and Soil, 76, 233–242, 1984.
van der Eerden, L. J. M., de Visser, P. H. B., and van Dijk, C. J.: Risk of damage to crops in the direct neighborhood of ammonia sources, Environ. Pollut., 102, 49–52, 1998.
van Dijk, S. M. and Duyzer, J. H.: Nitric oxide emissions from forest soils, J. Geophys. Res., 104, 15 955–15 961, 1999. Venterea, R. T., Groffman, P. M., Verchot, L. V., Magill, A. H.,
Aber, J. D., and Steudler, P. A.: Nitrogen oxide gas emissions from temperate forest soils receiving long-term nitrogen inputs, Global Change Biol., 9, 346–357, 2003.
Williams, E. J., Guenther, A., and Fehsenfeld, F. C.: An inventory of nitric oxide emissions from soils in the United States, J. Geo-phys. Res., 97, 7511–7519, 1992.
Wolf, I. and Russow, R.: Different pathways of formation of N2O, N2and NO in black earth soil, Soil Biol. Biochem., 32, 229–239, 2000.