HAL Id: hal-00304260
https://hal.archives-ouvertes.fr/hal-00304260
Submitted on 12 Jun 2008HAL is a multi-disciplinary open access
archive for the deposit and dissemination of sci-entific research documents, whether they are pub-lished or not. The documents may come from teaching and research institutions in France or abroad, or from public or private research centers.
L’archive ouverte pluridisciplinaire HAL, est destinée au dépôt et à la diffusion de documents scientifiques de niveau recherche, publiés ou non, émanant des établissements d’enseignement et de recherche français ou étrangers, des laboratoires publics ou privés.
Redox activity and chemical speciation of size fractioned
PM in the communities of the Los Angeles ? Long Beach
Harbor
S. Hu, A. Polidori, M. Arhami, M. M. Shafer, J. J. Schauer, A. Cho, C.
Sioutas
To cite this version:
S. Hu, A. Polidori, M. Arhami, M. M. Shafer, J. J. Schauer, et al.. Redox activity and chemical speciation of size fractioned PM in the communities of the Los Angeles ? Long Beach Harbor. Atmo-spheric Chemistry and Physics Discussions, European Geosciences Union, 2008, 8 (3), pp.11643-11672. �hal-00304260�
ACPD
8, 11643–11672, 2008 Redox activity of size-segregated PM samples S. Hu et al. Title Page Abstract Introduction Conclusions References Tables Figures ◭ ◮ ◭ ◮ Back CloseFull Screen / Esc
Printer-friendly Version Interactive Discussion
Atmos. Chem. Phys. Discuss., 8, 11643–11672, 2008 www.atmos-chem-phys-discuss.net/8/11643/2008/ © Author(s) 2008. This work is distributed under the Creative Commons Attribution 3.0 License.
Atmospheric Chemistry and Physics Discussions
Redox activity and chemical speciation of
size fractioned PM in the communities of
the Los Angeles – Long Beach Harbor
S. Hu1, A. Polidori1, M. Arhami1, M. M. Shafer2, J. J. Schauer2, A. Cho3, and C. Sioutas1
1
University of Southern California, Department of Civil and Environmental Engineering, 3620 South Vermont Avenue, Los Angeles, CA 90089, USA
2
University of Wisconsin-Madison, Environmental Chemistry and Technology Program, 660 North Park Street, Madison, WI 53706, USA
3
University of California, Los Angeles, School of Medicine, Los Angeles, CA 90095, USA Received: 25 April 2008 – Accepted: 15 May 2008 – Published: 12 June 2008
Correspondence to: C. Sioutas (sioutas@usc.edu)
ACPD
8, 11643–11672, 2008 Redox activity of size-segregated PM samples S. Hu et al. Title Page Abstract Introduction Conclusions References Tables Figures ◭ ◮ ◭ ◮ Back CloseFull Screen / Esc
Printer-friendly Version Interactive Discussion Abstract
In this study, two different types of assays were used to quantitatively measure the re-dox activity of PM and to examine its intrinsic toxicity: 1) in vitro exposure to rat alveolar macrophage (AM) cells using dichlorofluorescin diacetate (DCFH-DA) as the fluores-cent probe (macrophage ROS assay), and: 2) consumption of dithiothreitol (DTT) in
5
a cell-free system (DTT assay). Coarse (PM10−2.5), accumulation (PM2.5−0.25), and
quasi-ultrafine (quasi-UF, PM0.25) mode particles were collected weekly at five sam-pling sites in the Los Angeles-Long Beach Harbor and at one site near the University of Southern California campus (urban site). All PM samples were analyzed for organic (total and water-soluble) and elemental carbon, organic species, inorganic ions, and
10
total and water-soluble elements. Quasi-UF mode particles showed the highest redox activity at all Long Beach sites (on both a per-mass and per-air volume basis). A sig-nificant association (R2=0.61) was observed between the two assays, indicating that macrophage ROS and DTT levels are affected at least partially by similar PM species. Relatively small variation was observed for the DTT measurements across all size
15
fractions and sites, whereas macrophage ROS levels showed more significant ranges across the three different particle size modes and throughout the sites (coefficients of variation, or CVs, were 0.35, 0.24 and 0.53 for quasi-UF, accumulation, and coarse mode particles, respectively). Association between the PM constituents and the redox activity was further investigated using multiple linear regression models. The results
20
showed that OC was the most important component influencing the DTT activity of PM samples. The variability of macrophage ROS was explained by changes in OC concentrations and water-soluble vanadium (probably originating from ship emissions – bunker oil combustion). The multiple regression models were used to predict the av-erage diurnal macrophage ROS and DTT levels as a function of the OC concentration
25
ACPD
8, 11643–11672, 2008 Redox activity of size-segregated PM samples S. Hu et al. Title Page Abstract Introduction Conclusions References Tables Figures ◭ ◮ ◭ ◮ Back CloseFull Screen / Esc
Printer-friendly Version Interactive Discussion 1 Introduction
Epidemiological and toxicological studies have shown a positive association between adverse health effects and exposure to fine and ultrafine particulate matter (PM) (Dock-ery et al., 1993; Pope et al., 2002; Pope et al., 2004). Atmospheric PM and its com-ponents have the potential to interact with airway epithelial cells and macrophages to
5
generate reactive oxygen species (ROS), which have been linked to respiratory inflam-mation and other adverse health effects (Cho et al., 2005; Nel, 2005). A variety of methods in both cell-free and cell-based systems have been employed to examine the oxidative stress activity of PM. Cho et al. (2005) demonstrated that the dithiothreitol (DTT) assay can provide a good measure of the redox activity of particles by
deter-10
mining superoxide radical formation as the initial step in the generation of ROS. Li et al. (2003) showed that the consumption rate of DTT by PM samples is directly related to the particles’ ability to induce a stress protein in cells. Other types of in vitro assays are able to assess the ability of PM (or PM extracts) to stimulate cellular generation of ROS in macrophage cells (Sioutas et al., 2005). Despite recent advancements in ROS
15
analysis, the aerosol components driving the formation of ROS remain unclear. PM constituents that have been considered as major driving forces for ROS formation in-clude organic species, transition metals, and polycyclic aromatic hydrocarbons (PAHs) (Cho et al., 2005; Li et al., 2003). Due to the complex chemical compositions of PM, the specific role of different particle species in inducing oxidative stress, whether in
20
non-cellular or cellular assays, is still not well understood and could be assays and/or method dependent.
The link between PM components and their toxicity provides a particularly useful metric for aerosol monitoring, as there is wide agreement among the air pollution com-munity that not all PM species are equally toxic. Ntziachristos et al. (2007a)
demon-25
strated that the DTT activity could be attributed to PAHs via the formation of quinones. Geller et al. (2006) investigated the toxicity of PM emissions from gasoline and diesel passenger cars and demonstrated that a link exists between redox activity and
chem-ACPD
8, 11643–11672, 2008 Redox activity of size-segregated PM samples S. Hu et al. Title Page Abstract Introduction Conclusions References Tables Figures ◭ ◮ ◭ ◮ Back CloseFull Screen / Esc
Printer-friendly Version Interactive Discussion
ical species including organic carbon (OC), low molecular weight PAHs and trace ele-ments such as nickel and zinc. Water soluble metals could also be biologically active and act as catalysts to favor the formation of ROS (Mudway et al., 2004). However, there are limited studies examining the relationships between the water-soluble PM content and its underlying toxic response.
5
Efforts have also been made to associate specific sources of PM to oxidative stress (Zhang et al., 20081). However, toxicological studies on the adverse health effects of PM have focused on data collected at limited sampling sites dominated by only a few emission sources (e.g. vehicular emissions) (Li et al., 2003), or from laboratory gen-erated aerosols (Su et al., 2008). There are few works conducted to-date examining
10
the toxicity of PM collected at urban areas of interest, including locations impacted by nearby airports, harbors, power plants and refineries. The present study was con-ducted in the Los Angeles-Long Beach port, which represents the busiest harbor in the US and the fifth most important port complex in the world in terms of commercial activ-ity. This is an area impacted by various sources, including several types of industries,
15
refineries, as well as vehicular and marine vessels. The current work is an extension of a previous study conducted by Ntziachristos et al. (2007a), which addressed re-dox activity and chemical speciation of size-fractionated PM in urban and rural areas of the Los Angeles Basin. In addition to the DTT assay employed in Ntziachristos et al. (2007a), a macrophage-based ROS assay was also used, and associations
be-20
tween PM components (including water-soluble elements and water-soluble OC) and redox activities were investigated.
1
Zhang, Y., Schauer, J. J., Shafer, M. M., Hannigan, M. P., and Dutton, S. J.: Source Appor-tionment of in vitro Reactive Oxygen Species Bioassay Activity from Atmospheric Particulate Matter., submitted to Environ. Sci. Technol., 2008.
ACPD
8, 11643–11672, 2008 Redox activity of size-segregated PM samples S. Hu et al. Title Page Abstract Introduction Conclusions References Tables Figures ◭ ◮ ◭ ◮ Back CloseFull Screen / Esc
Printer-friendly Version Interactive Discussion
2 Experimental methods
2.1 Site locations
Size-segregated PM samples were collected at four sampling locations in the Los Angeles-Long Beach port area (SITE 1–SITE 4), at a background location near the harbor of the Los Angeles port (SITE 5, the closest to the oceanfront; see Fig. S1 in
5
the supporting information document for a map of the sampling sites), and at an urban site (SITE 6) at the University of Southern California (USC) campus. Samples were collected daily on weekdays (Monday to Friday) over a 7-week period from February to May of 2007. A detailed description of the sampling and chemical analysis methods is described elsewhere (Arhami et al., 20082); only a brief summary is reported here.
10
The six sampling sites were selected to capture the impact of a complex source mix within the harbor community. SITES 1, 2 and 3 were located in Wilmington, West Long Beach. SITE 1 was set-up at the intersection between a major street and a local resi-dential road. SITE 2 was about 3 km north of the ocean coast, at the intersection of two major streets, and in close proximity to the Alameda corridor (a 32 km freight rail
“ex-15
pressway”). SITE 3 was located inside a semi-industrial area and less than 1 km north of the CA-1 highway. SITE 4 was further away from the ocean coast (∼7 km north), about 1 km east (downwind) of the I-710 freeway (where more than 25% of the vehicle fleet is represented by heavy-duty diesel vehicles), and about 1 km north of the I-405 freeway. SITE 5 was a typical background site for the Long Beach harbor, while SITE 6
20
(located at the USC main campus), was representative of urban air quality conditions in downtown Los Angeles.
2
Arhami, M., Sillanp ¨a ¨a, M., Hu, S. R. O. M., Schauer, J. J., and Sioutas, C.: Size-Segregated Inorganic and Organic Components of PM in the Communities of the Long Beach and Los Angeles Harbor, submitted to Aerosol Sci. Technol., 2008.
ACPD
8, 11643–11672, 2008 Redox activity of size-segregated PM samples S. Hu et al. Title Page Abstract Introduction Conclusions References Tables Figures ◭ ◮ ◭ ◮ Back CloseFull Screen / Esc
Printer-friendly Version Interactive Discussion
2.2 Sampling description
At each site, size-segregated ambient aerosols were collected using two parallel Sioutas™ impactors (SKC Inc, PA; operating flow rate=9 lpm), one loaded with Zefluor filters (3 µm pore-size, Pall Life Sciences, Ann Arbor MI) and the other with Quartz fiber filters (Pall Life Sciences, Ann Arbor MI). Three different size fractions of PM were
col-5
lected, coarse (2.5 µm<Dp<10 µm), accumulation (0.25 µm<Dp<2.5 µm), and quasi-ultrafine (Dp<0.25 µm) modes. All substrate were either baked at 550◦C (Quartz fiber filter) or cleaned with a series of solvents (Zefluor) before usage to minimize contami-nations (see Arhami et al., 20082, for further details). After sampling, each Quartz fiber filter sample was wrapped in a piece of pre-baked aluminum foil, placed in a Petri dish
10
and kept frozen (at –4◦C) until analysis. 2.3 Gravimetric and chemical analyses
Zefluor filters were weighed before and after sampling using a Mettler-Toledo MX5 mi-crobalance (Mettler-Toledo, Columbus, OH; weight uncertainty ±2 µg) in a room with controlled temperature and humidity to determine the mass of the collected PM.
Labo-15
ratory filter blanks were also weighed before, during, and after each weighing session to verify the accuracy and consistency of the microbalance. The electrostatic charges of the Zefluor substrates were minimized using a static neutralizer (500 µCi Po210, NRD LLC, Grand Island, NY).
Weekly composites (one for each size fraction) were analyzed at the Wisconsin State
20
Lab of Hygiene (University of Wisconsin-Madison) for several important inorganic and organic species. Quartz composites were analyzed by: a) Ion Chromatography (IC), b) Thermal Evolution/Optical Transmittance (TOT), and c) Gas Chromatography/Mass Spectrometry (GC/MS) to determine the concentrations of inorganic ions (Sheesley et al., 2000), OC and elemental carbon (EC) (Turpin et al., 2000;Schauer, 2003), and
25
organic species/tracers including PAHs, n-Alkanes, n-Alkanoic Acids, Resin Acids, Hopanes and Steranes (Chowdhury et al., 2007; Zheng et al., 2002), respectively.
ACPD
8, 11643–11672, 2008 Redox activity of size-segregated PM samples S. Hu et al. Title Page Abstract Introduction Conclusions References Tables Figures ◭ ◮ ◭ ◮ Back CloseFull Screen / Esc
Printer-friendly Version Interactive Discussion
The Zefluor filters were sectioned in half, with one half used in the DTT assay. The remaining 1/2 filters were sectioned in thirds and weekly composites (one for each size fraction) prepared for the following analyses: (a) Total Elements (b) Water Soluble Ele-ments, and (c) Water Soluble OC (WSOC) and macrophage ROS. A magnetic sector inductively coupled plasma mass spectrometer (HR-ICPMS, Finnigan Element 2) was
5
applied for the quantification of 52 trace elements (Herner et al., 2006) in the total di-gests and water extracts. A General Electric Instrument (Sievers Total Organic Carbon, TOC; GE, Inc.) was used to determine WSOC concentrations.
2.4 Macrophage ROS and DTT assays
The redox activity of PM was measured by two different types of assays: 1) in-vitro
10
exposure to rat alveolar macrophage (AM) cells using dichlorofluorescin diacetate (DCFH-DA) as the fluorescent probe and 2) consumption of dithiothreitol (DTT) in a cell-free system (DTT assay). The first assay (applied to water soluble extracts of the collected PM filter samples) is directed at the biologically mediated production of ROS within the macrophage cell in response to cell stimulation from “toxic” species.
15
ROS species produced within the cytoplasm de-acetylate the DCFH-DA, resulting in the fluorescing compound (DCFH). Extracellular and abiotic de-acetylation is consid-ered to be small. Hereafter, this assay is referred to as Macrophage ROS. Alveolar macrophage cell lines (NR8383, American Type Culture Collection) were exposed to aqueous extracts of PM and subsequently assessed for viability (membrane integrity
20
– LDH assay) and production of ROS as an indicator of macrophage oxidative stress (Landreman et al.,20083). Zymosan (a β-1,3 polysaccharide of D-glucose) was cho-sen as the primary positive control because it is recognized by TLR-2 receptors on macrophage cells, activating a strong immuno-chemical response.
3
Landreman, A. P., Shafer, M., Hemming, J., Hannigan, M., and Schauer, J. J.: A Macrophage-Based Method for the Assessment of the Oxidative Stress Activity of Atmospheric Particulate Matter (PM) and Application to Routine (Daily-24 h) Aerosol Monitoring Studies, submitted to Aerosol Sci. Technol., 2008.
ACPD
8, 11643–11672, 2008 Redox activity of size-segregated PM samples S. Hu et al. Title Page Abstract Introduction Conclusions References Tables Figures ◭ ◮ ◭ ◮ Back CloseFull Screen / Esc
Printer-friendly Version Interactive Discussion
The DTT assay (applied to suspensions of the collected particles) provides an es-timate of the redox activity of a sample based on the ability of the PM to catalyze electron transfer between DTT and oxygen in simple chemical systems (Cho et al., 2005). The electron transfer is monitored by the rate at which DTT is consumed under a standardized set of conditions and the rate is proportional to the concentration of the
5
catalytically active redox-active species in the PM sample. This chemical assay mea-sures the consumption of DTT that is capable of quantitatively determining superoxide radical formation as the first step in the generation of ROS. The methodological proce-dure used for the DTT assays conducted for this work is described in great detail by Cho et al. (2005) and Li et al. (2003).
10
2.5 Statistical data analysis
Bivariate Pearson Correlations between Macrophage ROS and DTT levels, and the concentrations of the chemically speciated PM were calculated for a preliminary iden-tification of the most important predictor variables that could be included in multiple regression models for macrophage ROS and DTT. The chemical species with a
signifi-15
cantly positive correlation (p<0.05) with the macrophage ROS and DTT concentrations were then chosen as predictors in a series of multiple linear regression analyses (i.e., stepwise, forward, and backward elimination selections) using SAS for Windows (V 9.1, SAS Inc., Cary, NC). A general multiple linear regression equation expresses the response variable (Yi) as a linear combination of (p–1) predictor variables (Xi):
20
Yi = β0+ β1Xi ,1+ β2Xi ,2+ ... + βp−1Xi ,p−1+ εi (1) where, Yi is the response in the i th trial (i.e. Macrophage ROS or DTT), β0, β1,
. . . ,βp−1 are the regression coefficients, Xi ,1, Xi ,2, ..., Xi ,p−1 are predictor variables
ACPD
8, 11643–11672, 2008 Redox activity of size-segregated PM samples S. Hu et al. Title Page Abstract Introduction Conclusions References Tables Figures ◭ ◮ ◭ ◮ Back CloseFull Screen / Esc
Printer-friendly Version Interactive Discussion
3 Results and discussion
3.1 Overview of the PM chemical speciation
Table 1 shows the concentration of PM in three particle size ranges at each sampling site, and the corresponding percentage contribution of major aerosol components to PM mass. A detailed discussion about the chemical speciation results is described
5
elsewhere (Arhami et al., 20083). The mass distribution of the different species in differ-ent size fractions was relatively homogeneous across sampling sites. OC was the most abundant component of quasi-ultrafine (quasi-UF) particles at all sites (31.0 to 38.9% at SITE 5 and SITE 2, respectively). The organic material in ultrafine particles predom-inantly originates from various combustion sources (Seinfeld and Pandis, 1998), such
10
as vehicular and ship emissions. OC in the accumulation mode may also originate from the photo-oxidation of reactive gaseous precursors (i.e. secondary organic aerosol, or SOA, formation) (Turpin et al., 2000; Polidori et al., 2006); EC, primarily formed from in-complete combustion processes and often considered to be a good surrogate of diesel emissions (Seinfeld and Pandis, 1998), was present mainly in the quasi-UF mode (7.9
15
to 13.5% at SITE 4 and SITE 1, respectively).
Secondary aerosol components, such as sulfate, nitrate and ammonium, were the most dominant species in accumulation mode particles, together accounting between 41.2% (SITE 5) and 60.0% (SITE 6) over the six sampling sites. Sulfate was the most abundant component in the accumulation mode (21.3 to 29.2% at SITE 5 and SITE 1,
20
respectively) and the second most abundant component following OC in the quasi-UF mode (13.2 to 20% at SITE 2 and SITE 5, respectively) at most sites. Accumulation mode sulfate is mainly present in the urban air as ammonium sulfate, a secondary aerosol component formed in the atmosphere through the oxidation of sulfur dioxide ..(Rodhe, 1999), whereas in the quasi-UF fraction, a significant part of sulfate also
25
originates from bunker-fuel combustion from the nearby marine port vessels (Lin et al., 2005; Arhami et al., 20083). Nitrate contributed mostly to the mass of accumulation mode (12.6 to 24.8% at SITE 1 and SITE 6, respectively) and coarse mode
parti-ACPD
8, 11643–11672, 2008 Redox activity of size-segregated PM samples S. Hu et al. Title Page Abstract Introduction Conclusions References Tables Figures ◭ ◮ ◭ ◮ Back CloseFull Screen / Esc
Printer-friendly Version Interactive Discussion
cles (11.2 to 23.4% at SITE 2 and SITE 1, respectively). In the accumulation mode, nitrate originates through secondary processes involving nitric acid and ammonia (Se-infeld and Pandis, 1998), while in the coarse fraction it is mostly formed from reactions between nitric acid and sea salt or mineral compounds (Kerminen et al., 1998; Pio and Lopes, 1998). Ammonium (NH+4), present in the atmosphere mainly as
ammo-5
nium nitrate and ammonium sulfate, is also formed through secondary processes from gaseous precursor, and typically contributed more to the mass of accumulation mode PM (5.8 to 11.7% at SITE 5 and SITE 6, respectively).
Inorganic elements accounted from 9.2 to 17.6% of the coarse particle mass, and between 7.5 and 19.1% of the accumulation mode mass. Their contribution to the
10
quasi-UF fraction was relatively lower (3.9 to 6.9%) at all sites. Na and S were the most abundant elements in all three size fractions, followed by Ca, Mg, K, Fe and Al. Among all elements, Al, Fe, Ti, K, Mn, and Cs, which have a crustal origin (Ntziachristos et al., 2007b; Arhami et al., 20083) and are products of re-suspended soil dust, were found mostly in coarse PM. Sb, S, Cd, Mo, Zn, Pb and Cu, mainly generated by vehicular
15
sources and present as constituents of lube oil (Ntziachristos et al., 2007b), were found in all size fractions. V and Ni, which are mostly emitted by marine vessels and oil combustion (Lu et al., 2006;Isakson et al., 2001), were more abundant in the quasi-UF mode.
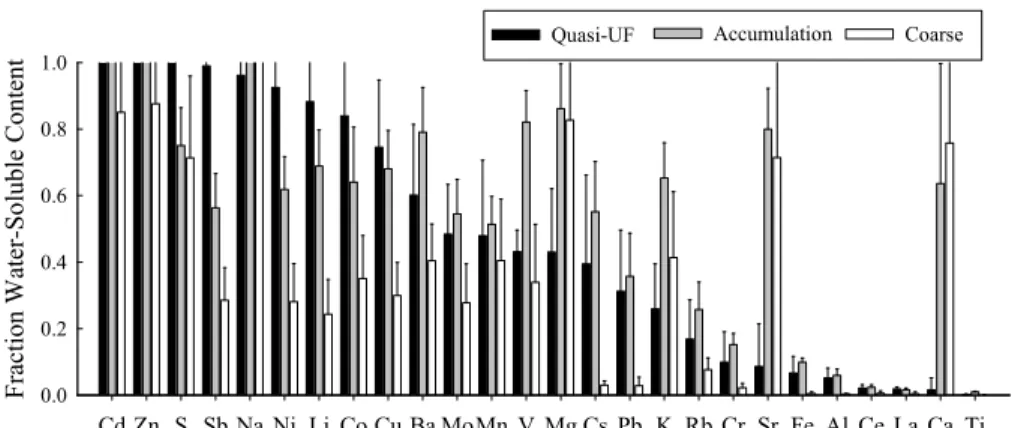
3.2 Water-soluble elements and water-soluble organic carbon (WSOC) content
20
Figure 1 shows water-soluble elements as a fraction of total element concentration in the three size ranges. Generally, trace elements in quasi-UF and accumulation mode particles are more soluble than those in coarse PM. For certain elements, in particular for Cd, Zn, Sb, Ni, Li, Co, and Cu, the solubility is highest in quasi-UF PM (>0.75) and decreases with increasing particle size. This class of compounds might originate from
25
high temperature combustion processes, such as fresh vehicular emissions. Zn and Cd are almost entirely water-soluble in both quasi-UF and accumulation modes. Na showed very high and comparable water solubility among the three size ranges. The
ACPD
8, 11643–11672, 2008 Redox activity of size-segregated PM samples S. Hu et al. Title Page Abstract Introduction Conclusions References Tables Figures ◭ ◮ ◭ ◮ Back CloseFull Screen / Esc
Printer-friendly Version Interactive Discussion
solubility of Ba, Mo, Mn, V, Mg, Cs, Pb and K, Sr peaked in the accumulation mode. The least soluble elements were Cr, Fe, Al, Ce, La and Ti (<15%), a finding consistent with their geochemical origin. These results agree with those reported in other studies conducted in an urban area of Birmingham, UK (Heal et al., 2005; Birmili et al., 2006). Birmili et al. (2006) reported that Zn and Cd in ambient PM7.2 particles are the most
5
soluble trace elements (∼50%), followed by Mn, Cu, Ba, Pb and Co.
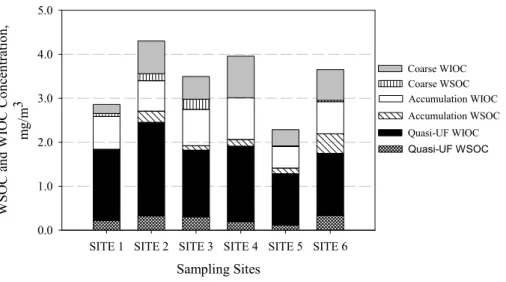
Figure 2 shows water-soluble (WSOC) and water-insoluble OC (WIOC) concentra-tions in three size ranges at all sampling sites. While some WSOC originates from primary emission sources, such as biomass burning, its production is mostly attributed to SOA formation processes (Weber et al., 2007). The highest WSOC
concentra-10
tions were in fine PM at all sites, with relatively equal partitioning between quasi-UF and accumulation modes (site-average WSOC concentrations were 0.25±0.08 and 0.20±0.12 µg C/m3for quasi-UF and accumulation modes, respectively). The average percentage contributions of WSOC to measured OC across all sites were 13.3±4.0%, 22.1±10.8% and 16.6±11.9% for quasi-UF, accumulation and coarse mode particles,
15
respectively, consistent with WSOC/OC wintertime ratios measured at other locations (Miyazaki et al., 2006). The relatively low WSOC/OC values as well as absolute WSOC concentrations compared to those reported in other studies are reflective of the limited photochemical activity during our sampling period. Decesari et al. (2001) observed seasonal variations in WSOC/OC ratio from 0.38 (winter) to 0.50 (summer) for fine
20
particles (Dp<1.5 µm) in the Po Valley. Sullivan and Weber (2006) reported mean WSOC/OC ratios for PM2.5 particles in the range of 0.50 and 0.60 in winter and
sum-mer, respectively, for measurements in St. Louis, MO, and Atlanta, GE. Ruellan and Cachier (2001) observed low mean WSOC/OC values (0.13) near a highly trafficked road around Paris in the summer and fall.
25
During this study, the highest WSOC concentrations as well as WSOC/OC fractions were observed at SITE 6 (downtown LA). This site is a receptor of freshly emitted particles upwind in the harbor area and transported to that site after considerable at-mospheric aging (SITE 6 is approximately 40 km north, thus mostly downwind, of the
ACPD
8, 11643–11672, 2008 Redox activity of size-segregated PM samples S. Hu et al. Title Page Abstract Introduction Conclusions References Tables Figures ◭ ◮ ◭ ◮ Back CloseFull Screen / Esc
Printer-friendly Version Interactive Discussion
harbor sites). Ho et al. (2006) reported that the WSOC/OC fraction in PM2.5measured in Hong Kong was lower at an urban site than at urban-residential and background sites, due to the formation of SOA during transport/aging of the PM mass from urban to background sites.
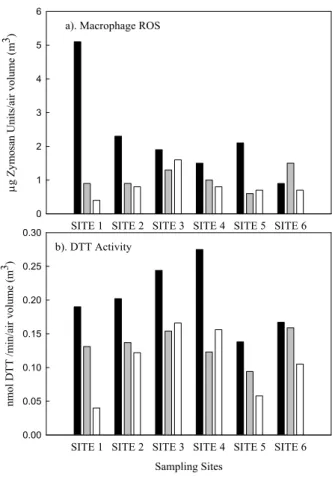
3.3 Measured redox activities
5
The redox activities of size fractionated PM measured by the two assays are shown, for all sites, on a per PM mass basis in Table 1. The macrophage ROS level of quasi-UF particles measured at SITE 1 was extremely high compared to those obtained in the same size-range at other sites. We do not have an obvious explanation for the higher PM activity in that site, at lest based on the detailed chemical PM composition
10
discussed in earlier paragraphs. We thus treated this data point as an outlier in the statistical analysis described in subsequent sections. On a per mass basis, ultrafine particles exhibited significantly higher redox activity than fine and coarse mode PM. Few previous studies have demonstrated this size-dependent contrast in PM toxicity (Li et al., 2003; Ntziachristos et al., 2007a; Cho et al., 2005). We also investigated the
15
redox potential of PM on a per unit of air volume basis (Fig. 3a), and quasi-UF particles still showed the highest activity levels at all Long Beach sites (SITE 1-5), but not at SITE 6 (urban site near USC), where accumulation mode particles had higher toxicity measured by the macrophage ROS assay.
The average DTT activities for PM2.5 particles at the Long Beach sites
20
(0.027+0.004 nmol DTT/min/µg mass; individual values for each site are reported in Table 1 on a per PM mass basis, and on Fig. 3b on a per unit of air volume basis) are well in the range of those reported for PM2.5 particles in a previous study
con-ducted during different seasons at different urban areas in Southern California (Ntzi-achristos et al., 2007a) (0.027+0.005 nmol DTT/min/µg mass). The average DTT
ac-25
tivity of PM0.25(0.039+0.010 nmol DTT/min/µg mass) in this study is somewhat lower
than that of PM0.15(0.058+0.015 nmol DTT/min/µg mass) estimated by Ntziachristos et al. (2007a). This discrepancy is probably due to the relatively lower contribution of
par-ACPD
8, 11643–11672, 2008 Redox activity of size-segregated PM samples S. Hu et al. Title Page Abstract Introduction Conclusions References Tables Figures ◭ ◮ ◭ ◮ Back CloseFull Screen / Esc
Printer-friendly Version Interactive Discussion
ticles between 0.15 and 0.25 µm to the DTT activity on a per mass basis.
The variability of the redox potential among size-fractions was estimated by its co-efficient of variation (CV; the standard deviation to mean ratio). CVs for DTT activities were 0.25, 0.20 and 0.27 for quasi-UF, accumulation and coarse mode PM, respec-tively. This rather low variability could be attributed to the fairly homogenous distribution
5
of organic species on a per mass basis among the three size ranges in that area. As it will be discussed later, these species are mostly responsible for the variability in DTT. By contrast, higher CVs were observed for macrophage ROS (0.35, 0.24 and 0.53, for quasi-UF, accumulation and coarse mode particles, respectively.
3.4 DTT vs. macrophage ROS
10
DTT activities and macrophage ROS measurements are compared on Figure S2 (sup-porting information). Macrophage ROS is significantly correlated with DTT consump-tion (R2=0.61, p<0.05) for the pooled samples (17 data points; as stated previously quasi-UF ROS at SITE 1 was excluded from all calculations). It should be noted that these are two independent and intrinsically different assays and, thus, should not be
15
expected to be correlated a priori. The consumption of DTT is based on the ability of a PM sample to accept electrons from DTT and transfer them to oxygen (Cho et al., 2005); whereas macrophage ROS assays use a filtered extract, so that cells are exposed to the soluble components of PM only. The substantial correlation between these two assays suggests that both analyses may be driven, at least in part, by
vari-20
ations in the concentrations of similar chemical species. The association between the DTT and Macrophage ROS assay and PM constituents are further investigated in the following sections.
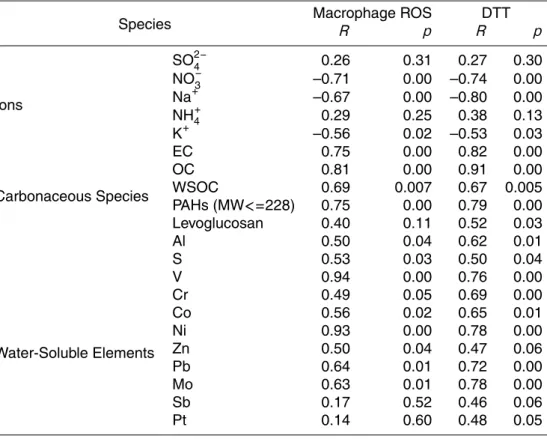
3.5 Macrophage ROS/DTT vs. chemical speciation
Table 2 shows Pearson’s correlation coefficients of macrophage ROS and DTT vs
se-25
ACPD
8, 11643–11672, 2008 Redox activity of size-segregated PM samples S. Hu et al. Title Page Abstract Introduction Conclusions References Tables Figures ◭ ◮ ◭ ◮ Back CloseFull Screen / Esc
Printer-friendly Version Interactive Discussion
sampling sites were pooled to calculate the resulting mean Pearson’s coefficients and
p values. The species with a significantly positive correlation (p<0.05) with the re-dox activities are highlighted in bold in the table. Inorganic ions show insignificant or negative correlation with both assays, which agrees with the findings of other studies (Ntziachristos et al., 2007a). Nitrate and sulfate have no functional groups to result
5
in the formation of ROS, but may play a general role on particle toxicity by affecting PM acidity. OC showed a significant correlation with both assays. EC is also signifi-cantly correlated with both macrophage ROS and DTT levels, but this strong associa-tion may be due to the high correlaassocia-tion between EC and OC concentraassocia-tions, both being emitted mostly by motor-vehicles. A strong correlation of water soluble V and Ni with
10
macrophage ROS was observed, with R values of 0.94 and 0.93, respectively. These two trace elements were highly correlated in this study (Arhami et al., 20083), suggest-ing that they originated from bunker fuel combustion from marine vessels (Isakson et al., 2001). With the exception of V, Ni and few other elements, the other species are moderately, insignificantly (p>0.05) or negatively correlated with both ROS and DTT
15
assays (Table S1, see supporting information for details).
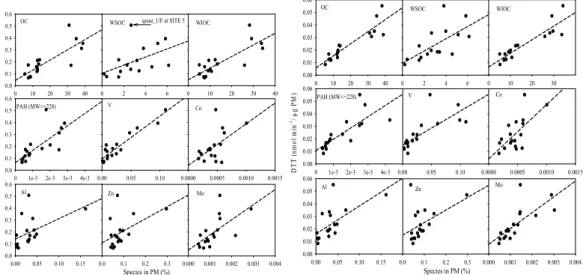
Figures 4 show correlations between a selected group of PM components (ex-pressed as a percentage of the measured PM mass) and redox activities of PM mea-sured by the macrophage ROS (Fig. 4a) and DTT (Fig. 4b) assays. The corresponding regression slopes, intercepts, and correlation coefficients (R2) are summarized in Table
20
S2 (supporting information). Water soluble V and, to a lesser degree, light molecular weight PAHs (MW≤228) and OC are well correlated with macrophage ROS levels. With the exception of one data point (quasi-UF at SITE 5), WSOC was also well correlated with ROS (R2=0.69, after excluding the influence of this last measurement). We hy-pothesize that the relative higher macrophage ROS level of quasi-UF particles at SITE
25
5 is mostly driven by the abundance of water soluble V and Ni, rather than water solu-ble OC, given the proximity of the site to the port and the lack of notasolu-ble traffic sources nearby. OC had the highest correlation with DTT than any other PM species (Fig. 4b). A multiple linear regression (MLR) analysis was conducted to further investigate the
ACPD
8, 11643–11672, 2008 Redox activity of size-segregated PM samples S. Hu et al. Title Page Abstract Introduction Conclusions References Tables Figures ◭ ◮ ◭ ◮ Back CloseFull Screen / Esc
Printer-friendly Version Interactive Discussion
contribution of the PM chemical components to the measured redox activities. 3.6 Multi-variance analysis
3.6.1 “Best-fitting” model for DTT
The “best-fitting” (3-parameters) regression equation for the DTT concentration was obtained using a “forward” selection method in SAS (“PROC REG”):
5
DTT = 0.034 + 5.585 × 10−02·OC + 9.15E−06·Alsoluble+ 7.39 × 10−04·Cosoluble (2)
where, OC, Alsoluble and Cosoluble are measured concentrations of OC, water-soluble
Al and water-soluble Co, respectively. The model was run considering all of the quasi-ultra-fine, accumulation and coarse concentrations together (a total of 16 data-points; 2 outliers were found and excluded), and the correlation between predicted
10
and measured DTT was excellent (y [predicted DTT]=0.95×[measured DTT]+0.0076);
R2=0.95).
As shown in Table S3a (supporting information), OC is by far the most significant factor in the regression (partial R2=0.76). The overall model is statistically significant (p<0.0001), has an R2 of 0.95, and a parameter coefficient (Cp) of 4 (the same as
15
the predicted number of parameters), indicating that the regression equation has an appropriate number of predictors. Thus, 95% of the DTT concentration variance can be explained by the variance of this 3-parameters model. These results confirm our earlier observations that organics drive the DTT response (Ntziachristos et al., 2007a). According to Cho et al. (2005), this assay is relatively insensitive to trace elements,
20
which is consistent with our regression results. Although the redox activity of transition metals in biological reactions is well established, the DTT assay does not reflect the redox activity for trace elements such as Al and Co. We hypothesize this could be due to the correlation of the trace metals with PAHs as indicated by Ntziachristos et al. (2007a). Al showed moderated correlation with light-MW PAHs (R=0.46),
suggest-25
ACPD
8, 11643–11672, 2008 Redox activity of size-segregated PM samples S. Hu et al. Title Page Abstract Introduction Conclusions References Tables Figures ◭ ◮ ◭ ◮ Back CloseFull Screen / Esc
Printer-friendly Version Interactive Discussion
the effect of light-MW PAHs on the DTT activity levels. Co concentration is not well correlated with PAHs (R=0.15); however, it is highly correlated with total OC (R=0.59). The PAHs only accounts for a small fraction of total OC (less than 30 ppm). Therefore Co might be a surrogate for other organic species. It is possible that regression models using different selection criteria, including OC and PAHs as predictor variables, could
5
explain the variability of DTT equally well.
The above best fitting regression equation (Eq. 2) can be used to estimate the effect of an increase/decrease in the concentration of any of the predictive variables (i.e. OC, Alsoluble and Cosoluble) on the DTT levels. For example, we varied OC over its typical
average diurnal range at SITE 2 (at the Wilmington site average hourly OC data were
10
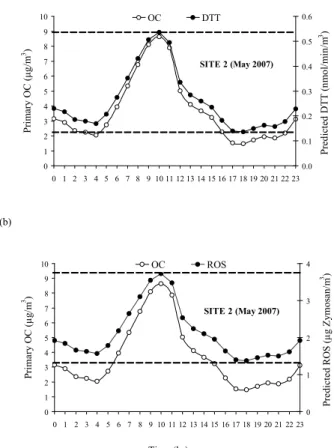
available only for May 2007), while holding constant the Alsoluble and Cosoluble concen-trations to their average background levels (those measured at SITE 5). This approach allowed us to describe/predict the DTT concentration at SITE 2 as the sum of its “urban background” concentration and the enhancement due to an increase in OC. As shown in Figure 5a, the predicted DTT at SITE 2 peaked during morning rush hour traffic
15
because of increased motor-vehicle emissions, reached a minimum late in the after-noon, and slightly increased again at night because of a lowered mixing height and increased atmospheric stability. The DTT activity rates and OC concentrations were ∼4 times higher between 9 and 11 a.m. than at 17–18 p.m., indicating (as expected) that traffic emissions can increase the redox potential of airborne PM substantially.
20
It should be noted that the intercept term influenced between 8 to 16% of the DTT levels predicted by Eq. 2, when considering the typical concentration range for OC in Wilmington. This small, but non-negligible effect of the intercept may be due to the contribution of redox active PM components, which are not included in our chemical analysis.
ACPD
8, 11643–11672, 2008 Redox activity of size-segregated PM samples S. Hu et al. Title Page Abstract Introduction Conclusions References Tables Figures ◭ ◮ ◭ ◮ Back CloseFull Screen / Esc
Printer-friendly Version Interactive Discussion
3.6.2 “Best-fitting” model for ROS
The “best-fitting” (2-parameters) regression equation for the ROS concentration was also obtained using a “forward” selection method in SAS (“PROC REG”):
ROS = 0.332 + 0.399 · OC + 2.2 × 10−04·Vsoluble (3)
where, OC and Vsolubleare the measured concentrations of OC and water-soluble V,
5
respectively. Similarly to DTT, the model was run considering all of the quasi-ultra-fine, accumulation and coarse concentrations together (a total of 16 data-points; 2 outliers were found and discarded), and the correlation between predicted and measured ROS was excellent (y [predicted ROS]=0.93×[measured ROS]+0.075); R2=0.93.
As shown in Table S3b (supporting information), water-soluble V is the most
influ-10
ential factor in the regression (partial R2=0.86). OC was also selected as a predictor variable (partial R2=0.07). The overall model is statistically significant (p<0.0001), with an R2of 0.93, and a parameter coefficient (Cp) of 3, which suggests that the regression equation has an appropriate number of predictors. Hence, 93% of the ROS concen-tration variance can be explained by the variance of this 2-parameters model. These
15
results indicate that the ROS response depends on two variables, each of which is an indicator of two major sources in that Long Beach area: OC (vehicular traffic) and V (ship emissions and oil combustion). The rest of PM species considered in this analy-sis were either non-correlated to ROS or, if they showed a significant association with ROS, they were probably emitted by the same two major sources.
20
The best fitting regression equation for ROS (Eq. 3) can also be used to estimate the effect of an increase/decrease in the concentration of any of the predictive variables (i.e. OC or Vsoluble) on the ROS levels. We varied OC over its average diurnal range
at SITE 2 (Wilmington site; average hourly OC data were available only for May 2007), while holding constant the Vsolubleconcentrations to its average background level
(mea-25
sured at SITE 5). This approach allowed us to describe/predict the ROS level at SITE 2 as the sum of its “urban background” concentration and the enhancement due to an increase in OC (Fig. 5b).
ACPD
8, 11643–11672, 2008 Redox activity of size-segregated PM samples S. Hu et al. Title Page Abstract Introduction Conclusions References Tables Figures ◭ ◮ ◭ ◮ Back CloseFull Screen / Esc
Printer-friendly Version Interactive Discussion
The predicted ROS values in Wilmington peaked during morning rush hour traffic be-cause of increased motor-vehicle emissions, reached a minimum late in the afternoon, and slightly increased again at night. The predicted ROS trend tracks reasonably well the diurnal patterns of OC, though not to the same degree of the DTT assay, shown in Figure 5a. This is mostly because of the significant influence of Vsolubleon ROS;
unfor-5
tunately, the lack of methodologies for near continuous measurements of particulate V prevent us from conducting a similar analysis for this species, but our data indicate the need and associated benefits for developing such methods, given the toxicity of some trace elements. Nonetheless, ROS and OC concentrations were ∼3–4 times higher between 9 and 11 a.m. than their daily average value, indicating that traffic emissions
10
can increase the potential of airborne particles to induce oxidative stress on human cells.
Finally, when considering the typical concentration range for OC in Wilmington, the intercept term influenced 6 to 15% of the ROS levels predicted by Eq. 3. In this case as well, the non-negligible effect of the intercept may be related to the fact that the model
15
only explains 93% of the ROS variance, although the presence of a non-PM related background activity for ROS could not be excluded.
We continue to confirm our earlier observations that organics are important and in-fluence the redox properties of PM measured by the DTT assay. According to Cho et al. (2005), most trace elements do not mitigate this assay; therefore all of our
re-20
sults are internally consistent with our prior works. In contrast, the macrophage ROS assay is mainly a function of two PM species, OC and V, which are indicators of the two major sources dominating the study area, i.e. vehicular traffic and ship emissions, respectively.
4 Summary and conclusions
25
The redox properties of size fractionated PM samples collected in the Los Angeles-Long Beach port area were measured using: 1) a “biological” assay applied to water
ACPD
8, 11643–11672, 2008 Redox activity of size-segregated PM samples S. Hu et al. Title Page Abstract Introduction Conclusions References Tables Figures ◭ ◮ ◭ ◮ Back CloseFull Screen / Esc
Printer-friendly Version Interactive Discussion
soluble extracts of the collected particles (Macrophage ROS assay), and: 2) a “chemi-cal” assay performed on suspensions of the PM filter samples (DTT assay). Quasi-UF mode particles showed the highest redox activities at all sites, on both a per-mass and per-air volume basis, and the substantial correlation between these two assays (R2=0.61) suggests that both assays may be driven, at least in part, by variations
5
in the concentrations of similar chemical species. A multiple linear regression model showed that OC (emitted from vehicle exhaust and port activities) was the single most important component influencing the DTT levels. A similar model also indicated that the variability of macrophage ROS is explained by changes in OC and water-soluble vana-dium concentrations (from vehicular traffic and ship emissions/bunker oil combustion,
10
respectively). The predicted DTT and ROS activity rates and measured OC concen-trations at one of the port sites were ∼3–4 times higher between 9 and 11 a.m. than at 17–18 p.m., confirming that traffic emissions can increase the redox potential of air-borne PM substantially and induce oxidative stress on human cells. The DTT and ROS are two independent and intrinsically different assays that measure different
as-15
pects/modes of PM toxicity, and, in this respect, they complement each other. A better understanding of the relationships between size-segregated PM (and PM components) and the associated DTT and ROS activities is important in terms of public health man-agement and prevention policies.
5 Supplemental information
20
Pearson correlation coefficients between macrophage ROS (and DTT) and selected chemical species, Pearson coefficients among selected water-soluble elements, sum-mary statistics for Figs. 4 and 5, a map of the sampling sites, and the results of the linear regression between macrophage ROS and DTT are included in the Sup-plemental Information document http://www.atmos-chem-phys-discuss.net/8/11643/
25
2008/acpd-8-11643-2008-supplement.pdf.
ACPD
8, 11643–11672, 2008 Redox activity of size-segregated PM samples S. Hu et al. Title Page Abstract Introduction Conclusions References Tables Figures ◭ ◮ ◭ ◮ Back CloseFull Screen / Esc
Printer-friendly Version Interactive Discussion
(SCPC), funded by US EPA under the STAR program (Grant RD-8324-1301-0) to the Uni-versity of Southern California. The research described herein does not necessarily reflect the views of the agency, and no official endorsement should be inferred. Mention of trade names or commercial products does not constitute an endorsement or recommendation for use. We thank the staff at the Wisconsin State Lab of Hygiene (WSLH) for chemical and toxicological
5
analysis of the PM samples, and the staff at UCLA for the DTT analysis of the PM samples. We are thankful for the Port of Long Beach, Dinesh Mohda and the staff at the Long Beach Job Corps Center, Mr. Balthazar Alvarez and South Coast AQMD for the help in the sample collection at the port sites.
References
10
Birmili, W., Allen, A. G., Bary, F., and Harrison, R. M.: Trace Metal Concentrations and Water Solubility in Size-Fractionated Atmospheric Particles and Influence of Road Traffic, Environ. Sci. Technol., 40, 1144–1153, 2006.
Cho, A. K., Sioutas, C., Miguel, A. H., Kumagai, Y., Schmitz, D. A., Singh, M., Eiguren-Fernandez, A., and Froines, J. R.: Redox activity of airborne particulate matter at different
15
sites in the Los Angeles Basin, Environ Res, 99, 40–47, 2005.
Chowdhury, Z., Zheng, M., Schauer, J. J., Sheesley, R. J., Salmon, L. G., Cass, G. R., and Russell, A. G.: Speciation of ambient fine organic carbon particles and source apportionment of PM2.5 in Indian cities, J. Geophys. Res., 112(D15), D15303, 2007.
Decesari, S., Facchini, M. C., Matta, E., Lettini, F., Mircea, M., Fuzzi, S., Tagliavini, E., and
20
Putaud, J. P.: Chemical features and seasonal variation of fine aerosol water-soluble organic compounds in the Po Valley, Italy, , Atmos. Environ., 35, 3691–3699, 2001.
Dockery, D. W., Pope III, D. C. A., Xu, X., Spengler, J. D., Ware, J. H., Fay, M. E., Ferris, B. G., and Speizer, F. E.: An Association between Air Pollution and Mortality in Six US Cities, N. Engl. J. Med., 329, 1753–1759, 1993.
25
Geller, M. D., Ntziachristos, L., Mamakos, A., Samaras, Z., Schmitz, D. A., Froines, J. R., and Sioutas, C.: Physicochemical and redox characteristics of particulate matter (PM) emitted from gasoline and diesel passenger cars, Atmos. Environ., 40, 6988–7004, 2006.
ACPD
8, 11643–11672, 2008 Redox activity of size-segregated PM samples S. Hu et al. Title Page Abstract Introduction Conclusions References Tables Figures ◭ ◮ ◭ ◮ Back CloseFull Screen / Esc
Printer-friendly Version Interactive Discussion
metal content of urban background PM10, PM2.5 and black smoke in Edinburgh, UK, Atmos. Environ., 39, 1417–1430, 2005.
Herner, J. D., Green, P. G., and Kleeman, M. J.: Measuring the trace elemental composition of size-resolved airborne particles, Environ. Sci. Technol., 40, 1925–1933, 2006.
Ho, K. F., Lee, S. C., Cao, J. J., Li, Y. S., Chow, J. C., Watson, J. G., and Fung, K.: Variability
5
of organic and elemental carbon, water soluble organic carbon, and isotopes in Hong Kong, Atmos. Chem. Phys., 6, 4569–4576, 2006,
http://www.atmos-chem-phys.net/6/4569/2006/.
Isakson, J., Persson, T. A., and Selin Lindgren, E.: Identification and assessment of ship emis-sions and their effects in the harbour of Goteborg, Sweden, Atmos. Environ., 35, 3659–3666,
10
2001.
Kerminen, V. M., Teinila, K., Hillamo, R., and Pakkanen, T.: Substitution of chloride in sea-salt particles by inorganic and organic anions, J. Aerosol Sci., 29, 929–942, 1998.
Li, N., Sioutas, C., Cho, A., Schmitz, D., Misra, C., Sempf, J., Wang, M. Y., Oberley, T., Froines, J., and Nel, A.: Ultrafine particulate pollutants induce oxidative stress and mitochondrial
15
damage, Environ. Health Perspect., 111, 455–460, 2003.
Lin, C. C., Chen, S. J., Huang, K. L., Hwang, W. I., Chang-Chien, G. P., and Lin, W. Y.: Charac-teristics of metals in nano/ultrafine/fine/coarse particles collected beside a heavily trafficked road, Environ. Sci. Technol., 39, 8113–8122, 2005.
Lu, G., Brook, J. R., Alfarra, M. R., Anlauf, K., Leaitch, W. R., Sharma, S., Wang, D., Worsnop,
20
D. R., and Phinney, L.: Identification and characterization of inland ship plumes over Van-couver, BC, Atmos. Environ., 40, 2767–2782, 2006.
Miyazaki, Y., Kondo, Y., Takegawa, N., Komazaki, Y., Fukuda, M., Kawamura, K., Mochida, M., Okuzawa, K., and Weber, R. J.: Time-resolved measurements of water-soluble organic carbon in Tokyo, J Geophys Res, 111(D23), D23206, 2006.
25
Mudway, I. S., Stenfors, N., Duggan, S. T., Roxborough, H., Zielinski, H., Marklund, S. L., Blomberg, A., Frew, A. J., Sandstrom, T., and Kelly, F. J.: An in vitro and in vivo investigation of the effects of diesel exhaust on human airway lining fluid antioxidants, Arch. Biochem. Biophys., 423, 200–212, 2004.
Nel, A.: ATMOSPHERE: Enhanced: Air Pollution-Related Illness: Effects of Particles, Science,
30
308, 804–806, doi:10.1126/science.1108752, 2005.
Ntziachristos, L., Froines, J. R., Cho, A. K., and Sioutas, C.: Relationship between redox ac-tivity and chemical speciation of size-fractionated particulate matter, Part Fibre Toxicol, 4, 5,
ACPD
8, 11643–11672, 2008 Redox activity of size-segregated PM samples S. Hu et al. Title Page Abstract Introduction Conclusions References Tables Figures ◭ ◮ ◭ ◮ Back CloseFull Screen / Esc
Printer-friendly Version Interactive Discussion
2007a.
Ntziachristos, L., Ning, Z., Geller, M. D., Sheesley, R. J., Schauer, J. J., and Sioutas, C.: Fine, ultrafine and nanoparticle trace element compositions near a major freeway with a high heavy-duty diesel fraction, Atmos. Environ., 41, 5684–5696, 2007b.
Pio, C. A., and Lopes, D. A.: Chlorine loss from marine aerosol in a coastal atmosphere, J.
5
Geophys. Res. D. Atmos., 103, 25 263–25 272, 1998.
Polidori, A., Turpin, B. J., Lim, H.-J., Cabada, J. C., Subramanian, R., Pandis, S. N., and Robinson, A. L.: Local and Regional Secondary Organic Aerosol: Insights from a Year of Semi-Continuous Carbon Measurements at Pittsburgh, , Aerosol Sci. Technol., 40, 861–872, 2006.
10
Pope, C. A., Burnett, R. T., Thun, M. J., Calle, E. E., Krewski, D., Ito, K., and Thurston, G. D.: Lung cancer, cardiopulmonary mortality, and long-term exposure to fine particulate air pollution, J. Am. Med. Assoc., 287, 1132–1141, 2002.
Pope, C. A., Burnett, R. T., Thurston, G. D., Thun, M. J., Calle, E. E., Krewski, D., and Godleski, J. J.: Cardiovascular mortality and long-term exposure to particulate air pollution -
Epidemio-15
logical evidence of general pathophysiological pathways of disease, Circulation, 109, 71–77, 2004.
Rodhe, H.: Human impact on the atmospheric sulfur balance, Tellus Series a-Dynamic Meteo-rology and Oceanography, 51, 110–122, 1999.
Ruellan, S. and Cachier, H.: Characterisation of fresh particulate vehicular exhausts near a
20
Paris high flow road, Atmos. Environ., 35, 453–468, 2001.
Schauer, J. J.: Evaluation of elemental carbon as a marker for diesel particulate matter, J. Expo. Anal. Environ. Epidemiol., 13, 443–453, 2003.
Seinfeld, J. H. and Pandis, S. N.: Atmospheric chemistry and physics: From air pollution to climate change, John Wiley, New York, 1998.
25
Sheesley, R. J., Schauer, J. J., N.D., S., and M.D., H.: Development of a standardized method for the analysis of organic compounds present in PM2.5.: Procedings of AWMA Annual Meet-ing 2000, Salt Lake City, UT, 2000,
Sioutas, C., Delfino, R. J., and Singh, M.: Exposure assessment for atmospheric ultrafine particles (UFPs) and implications in epidemiologic research, Environ. Health Perspect., 113,
30
947–955, 2005.
Su, D., Serafino, A., Muller, J.-O., Jenloft, R. E., Schlogl, R., and Fiorito, S.: Cytotoxicity and inflammatory potential of soot particles of low-emission diesel engines. , Environ. Sci.
Tech-ACPD
8, 11643–11672, 2008 Redox activity of size-segregated PM samples S. Hu et al. Title Page Abstract Introduction Conclusions References Tables Figures ◭ ◮ ◭ ◮ Back CloseFull Screen / Esc
Printer-friendly Version Interactive Discussion
nol., in press, 2008.
Sullivan, A. P. and Weber, R. J.: Chemical characterization of the ambient organic aerosol soluble in water: 1. Isolation of hydrophobic and hydrophilic fractions with a XAD-8 resin, J. Geophys. Res. D. Atmos., 111(D5), D05314, 2006.
Turpin, B. J., Saxena, P., and Andrews, E.: Measuring and Simulating Particulate Organics in
5
the Atmosphere: Problems and Propects., Atmos. Environ., 34, 2983–3013, 2000.
Weber, R. J., Sullivan, A. P., Peltier, R. E., Russell, A., Yan, B., Zheng, M., De Gouw, J., Warneke, C., Brock, C., Holloway, J. S., Atlas, E. L., and Edgerton, E.: A study of secondary organic aerosol formation in the anthropogenic-influenced southeastern United States, J. Geophys. Res., 112(D13), D13302, 2007.
10
Zheng, M., Cass, G. R., Schauer, J. J., and Edgerton, E. S.: Source apportionment of PM2.5 in the southeastern United States using solvent-extractable organic compounds as tracers, Environ. Sci. Technol., 36, 2361–2371, 2002.
ACPD
8, 11643–11672, 2008 Redox activity of size-segregated PM samples S. Hu et al. Title Page Abstract Introduction Conclusions References Tables Figures ◭ ◮ ◭ ◮ Back CloseFull Screen / Esc
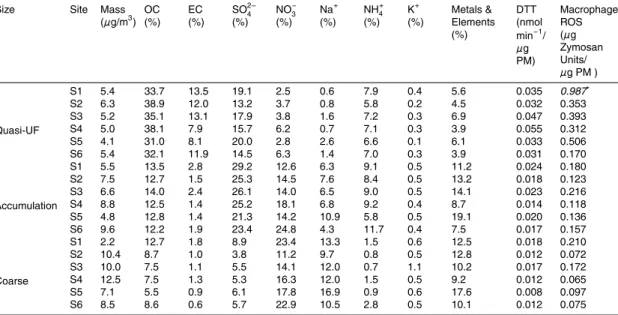
Printer-friendly Version Interactive Discussion Table 1. Size-resolved PM mass concentration, chemical composition and redox activities at
the six sampling sites.
Size Site Mass
(µg/m3) OC (%) EC (%) SO2−4 (%) NO− 3 (%) Na+ (%) NH+4 (%) K+ (%) Metals & Elements (%) DTT (nmol min−1/ µg PM) Macrophage ROS (µg Zymosan Units/ µg PM ) Quasi-UF S1 5.4 33.7 13.5 19.1 2.5 0.6 7.9 0.4 5.6 0.035 0.987∗ S2 6.3 38.9 12.0 13.2 3.7 0.8 5.8 0.2 4.5 0.032 0.353 S3 5.2 35.1 13.1 17.9 3.8 1.6 7.2 0.3 6.9 0.047 0.393 S4 5.0 38.1 7.9 15.7 6.2 0.7 7.1 0.3 3.9 0.055 0.312 S5 4.1 31.0 8.1 20.0 2.8 2.6 6.6 0.1 6.1 0.033 0.506 S6 5.4 32.1 11.9 14.5 6.3 1.4 7.0 0.3 3.9 0.031 0.170 Accumulation S1 5.5 13.5 2.8 29.2 12.6 6.3 9.1 0.5 11.2 0.024 0.180 S2 7.5 12.7 1.5 25.3 14.5 7.6 8.4 0.5 13.2 0.018 0.123 S3 6.6 14.0 2.4 26.1 14.0 6.5 9.0 0.5 14.1 0.023 0.216 S4 8.8 12.5 1.4 25.2 18.1 6.8 9.2 0.4 8.7 0.014 0.118 S5 4.8 12.8 1.4 21.3 14.2 10.9 5.8 0.5 19.1 0.020 0.136 S6 9.6 12.2 1.9 23.4 24.8 4.3 11.7 0.4 7.5 0.017 0.157 Coarse S1 2.2 12.7 1.8 8.9 23.4 13.3 1.5 0.6 12.5 0.018 0.210 S2 10.4 8.7 1.0 3.8 11.2 9.7 0.8 0.5 12.8 0.012 0.072 S3 10.0 7.5 1.1 5.5 14.1 12.0 0.7 1.1 10.2 0.017 0.172 S4 12.5 7.5 1.3 5.3 16.3 12.0 1.5 0.5 9.2 0.012 0.065 S5 7.1 5.5 0.9 6.1 17.8 16.9 0.9 0.6 17.6 0.008 0.097 S6 8.5 8.6 0.6 5.7 22.9 10.5 2.8 0.5 10.1 0.012 0.075 ∗ Outlier
ACPD
8, 11643–11672, 2008 Redox activity of size-segregated PM samples S. Hu et al. Title Page Abstract Introduction Conclusions References Tables Figures ◭ ◮ ◭ ◮ Back CloseFull Screen / Esc
Printer-friendly Version Interactive Discussion Table 2. Pearson Correlation between Macrophage ROS activity, DTT level, and selected
species.
Species Macrophage ROSR p RDTT p
Ions SO2−4 0.26 0.31 0.27 0.30 NO− 3 –0.71 0.00 –0.74 0.00 Na+ –0.67 0.00 –0.80 0.00 NH+4 0.29 0.25 0.38 0.13 K+ –0.56 0.02 –0.53 0.03 Carbonaceous Species EC 0.75 0.00 0.82 0.00 OC 0.81 0.00 0.91 0.00 WSOC 0.69 0.007 0.67 0.005 PAHs (MW<=228) 0.75 0.00 0.79 0.00 Levoglucosan 0.40 0.11 0.52 0.03 Water-Soluble Elements Al 0.50 0.04 0.62 0.01 S 0.53 0.03 0.50 0.04 V 0.94 0.00 0.76 0.00 Cr 0.49 0.05 0.69 0.00 Co 0.56 0.02 0.65 0.01 Ni 0.93 0.00 0.78 0.00 Zn 0.50 0.04 0.47 0.06 Pb 0.64 0.01 0.72 0.00 Mo 0.63 0.01 0.78 0.00 Sb 0.17 0.52 0.46 0.06 Pt 0.14 0.60 0.48 0.05
ACPD
8, 11643–11672, 2008 Redox activity of size-segregated PM samples S. Hu et al. Title Page Abstract Introduction Conclusions References Tables Figures ◭ ◮ ◭ ◮ Back CloseFull Screen / Esc
Printer-friendly Version Interactive Discussion Water-Soluble Elements Cd Zn S Sb Na Ni Li Co Cu Ba MoMn V Mg Cs Pb K Rb Cr Sr Fe Al Ce La Ca Ti F ra ct ion W at er-S ol ubl e Cont ent 0.0 0.2 0.4 0.6 0.8 1.0
Quasi-UF Accumulation Coarse
Fig. 1. Mean fractions of water-soluble elements in each size range. Error bars are the standard
ACPD
8, 11643–11672, 2008 Redox activity of size-segregated PM samples S. Hu et al. Title Page Abstract Introduction Conclusions References Tables Figures ◭ ◮ ◭ ◮ Back CloseFull Screen / Esc
Printer-friendly Version Interactive Discussion
Sampling Sites
SITE 1 SITE 2 SITE 3 SITE 4 SITE 5 SITE 6
W S O C a nd W IO C C onc en tr at io n, m g /m 3 0.0 1.0 2.0 3.0 4.0 5.0 Quasi-UF WSOC Quasi-UF WIOC Accumulation WSOC Accumulation WIOC Coarse WSOC Coarse WIOC
Fig. 2. Concentrations of water-soluble organic carbon (WSOC) and water insoluble organic
ACPD
8, 11643–11672, 2008 Redox activity of size-segregated PM samples S. Hu et al. Title Page Abstract Introduction Conclusions References Tables Figures ◭ ◮ ◭ ◮ Back CloseFull Screen / Esc
Printer-friendly Version Interactive Discussion
a). Macrophage ROS
Sampling Sites
SITE 1 SITE 2 SITE 3 SITE 4 SITE 5 SITE 6
μ g Z y m o sa n U n it s/ ai r v o lu m e (m 3) 0 1 2 3 4 5 6 b). DTT Activity Sampling Sites
SITE 1 SITE 2 SITE 3 SITE 4 SITE 5 SITE 6
nm ol D T T / m in /a ir vol um e (m 3) 0.00 0.05 0.10 0.15 0.20 0.25 0.30
Quasi-UF Accumulation Coarse
Fig. 3. Spatial distribution of size fractioned redox activities at the Long Beach Harbor; (a)
ACPD
8, 11643–11672, 2008 Redox activity of size-segregated PM samples S. Hu et al. Title Page Abstract Introduction Conclusions References Tables Figures ◭ ◮ ◭ ◮ Back CloseFull Screen / Esc
Printer-friendly Version Interactive Discussion 0 1e-3 2e-3 3e-3 4e-3
0.0 0.1 0.2 0.3 0.4 0.5 0.6 0.00 0.05 0.10 0.15 0.0 0.1 0.2 0.3 0.4 0.5 0.6 0.0 0.1 0.2 0.3 0.00 0.05 0.10 0 10 20 30 40 0.0 0.1 0.2 0.3 0.4 0.5 0.6 0 2 4 6 M ac rop ha g e R O S (μ g Z y m o sa n U n it s / μ g P M ) OC V Zn Species in PM (%) WSOC PAH (MW<=228) Al 0 10 20 30 40 WIOC 0.0000 0.0005 0.0010 0.0015 0.000 0.001 0.002 0.003 0.004 Co Mo quasi_UF at SITE 5 0 10 20 30 40 0.00 0.01 0.02 0.03 0.04 0.05 0.06 0 2 4 6 0.00 0.05 0.10 0.0000 0.0005 0.0010 0.0015 0.0 0.1 0.2 0.3 0.000 0.001 0.002 0.003 0.004 D T T ( n m o l m in -1/ μ g P M ) OC V Co Zn Mo Species in PM (%) WSOC
0 1e-3 2e-3 3e-3 4e-3 0.00 0.01 0.02 0.03 0.04 0.05 0.06 PAH (MW<=228) 0.00 0.05 0.10 0.15 0.00 0.01 0.02 0.03 0.04 0.05 0.06 Al 0 10 20 30 WIOC
Fig. 4. Scatter Plot of (a). Macrophage ROS and (b) DTT, with total, insoluble and water soluble
ACPD
8, 11643–11672, 2008 Redox activity of size-segregated PM samples S. Hu et al. Title Page Abstract Introduction Conclusions References Tables Figures ◭ ◮ ◭ ◮ Back CloseFull Screen / Esc
Printer-friendly Version Interactive Discussion (a) 0 1 2 3 4 5 6 7 8 9 10 0 1 2 3 4 5 6 7 8 9 10 11 12 13 14 15 16 17 18 19 20 21 22 23 P ri m ar y O C ( µ g/ m 3) 0.0 0.1 0.2 0.3 0.4 0.5 0.6 P re d ic te d D T T ( n m o l/ m in /m 3) OC DTT SITE 2 (May 2007) (b) 0 1 2 3 4 5 6 7 8 9 10 0 1 2 3 4 5 6 7 8 9 10 11 12 13 14 15 16 17 18 19 20 21 22 23 P ri m a ry O C (µ g/ m 3 ) 0 1 2 3 4 P re d ic te d R O S ( µ g Z y m o sa n /m 3 ) OC ROS SITE 2 (May 2007) Time (hr)
Fig. 5. Prediction of diurnal cycles of PM redox activity based on real time OC concentration; (a) DTT assay and (b) Macrophage ROS assay. The minimum and maximum estimated ROS