HAL Id: insu-02135813
https://hal-insu.archives-ouvertes.fr/insu-02135813
Submitted on 21 May 2019HAL is a multi-disciplinary open access archive for the deposit and dissemination of sci-entific research documents, whether they are pub-lished or not. The documents may come from teaching and research institutions in France or abroad, or from public or private research centers.
L’archive ouverte pluridisciplinaire HAL, est destinée au dépôt et à la diffusion de documents scientifiques de niveau recherche, publiés ou non, émanant des établissements d’enseignement et de recherche français ou étrangers, des laboratoires publics ou privés.
An early geodynamo driven by exsolution of mantle
components from Earth’s core
James Badro, Julien Siebert, Francis Nimmo
To cite this version:
James Badro, Julien Siebert, Francis Nimmo. An early geodynamo driven by exsolution of mantle components from Earth’s core. Nature, Nature Publishing Group, 2017, 536 (7616), pp.326-328. �10.1038/nature18594�. �insu-02135813�
An early geodynamo driven by exsolution of mantle components
from Earth’s core
James Badro1,2, Julien Siebert1, and Francis Nimmo3
1Institut de Physique du Globe de Paris, Université Sorbonne Paris Cité, Paris, France 2Earth and Planetary Science Laboratory, École Polytechnique Fédérale de Lausanne, CH-1015, Lausanne, Switzerland 3Department of Earth and Planetary Sciences, University of California Santa Cruz, Santa Cruz, CA 95064, United States
Abstract
Terrestrial core formation occurred in the early molten Earth by gravitational segregation of immiscible metal and silicate melts, stripping iron-loving elements from the silicate mantle to the metallic core1–3, and leaving rock-loving components behind. Here we performed experiments showing that at high enough temperature, Earth’s major rock-loving component, magnesium oxide, can also dissolve in core-forming metallic melts. Our data clearly point to a dissolution reaction, and are in agreement with recent DFT calculations4. Using core formation models5, we further show that a high-temperature event during Earth’s accretion (such as the Moon-forming giant impact6) can contribute significant amounts of magnesium to the early core. As it
subsequently cools, the ensuing exsolution7 of buoyant magnesium oxide generates a substantial amount of gravitational energy. This energy is comparable to if not significantly higher than that produced by inner core solidification8 — the primary driver of the Earth’s current magnetic field9–11. Since the inner core is too young12 to explain the existence of an ancient field prior to ~1 billion years, our results solve the conundrum posed by the recent paleomagnetic observation13 of an ancient field at least 3.45 Gyr old.
At the present day, the geodynamo is powered primarily by compositional buoyancy9–11 due to the crystallization of the inner core from the outer core, which started around ~1 billion years ago8,12. This creates a conundrum as to the origin of the early field; the inner core is certainly much younger than 3.45 Ga, so a different process for driving an early field is required.
Whether an early dynamo could have been driven by thermal buoyancy alone depends on the power extracted from the core by the mantle, which is uncertain14. It has been
Users may view, print, copy, and download text and data-mine the content in such documents, for the purposes of academic research, subject always to the full Conditions of use:http://www.nature.com/authors/editorial_policies/license.html#terms
Author Contributions
J. B. designed the project, performed the experiments, implemented thermodynamic and core-formation modeling, discussed the
Author Manuscript
Nature. Author manuscript; available in PMC 2017 February 18. Published in final edited form as:
Nature. 2016 August 18; 536(7616): 326–328. doi:10.1038/nature18594.
Europe PMC Funders Author Manuscripts
suggested7,15–17 that light elements dissolved in the core during core formation could exsolve early in Earth’s history as the core cools; the resulting compositional buoyancy would generate enough energy to fuel an early geodynamo. Magnesium exsolution prior to inner core growth has been proposed7,16 as a mechanism paralleling oxygen and/or silicon exsolution after inner core crystallization. The perquisite however is that magnesium must dissolve in iron during core formation.
In order to assess the plausibility of that mechanism, we experimentally investigated the solubility of magnesium in molten iron in equilibrium with basaltic and pyrolitic silicate melts at extremely high temperature. The experiments were performed in a laser-heated diamond anvil cell, where thin pure iron disks were sandwiched between two pyrolite or tholeiite glass disks of identical composition, thickness, and diameter. The assembly was compressed to 35–74 GPa, and laser-heated between 3300 and 4400 K for 30 to 60 seconds. After quench and decompression, thin sections were removed from the center of the laser heated spot using a crossbeam focused ion beam microscope. The thin sections were imaged by high-resolution field-emission scanning electron microscopy, and all showed a coalesced spherical iron ball surrounded by molten silicate (Extended Data Fig. 1), confirming the sample (metal and silicate) was fully molten during equilibration. The composition of the metal and silicate was analyzed using high-resolution electron probe microanalysis (see Methods).
Magnesium solubility in iron takes place according to
(1)
and that reaction’s equilibrium constant is , where T is temperature in K, and P pressure in GPa. The parameters (see Methods) were determined from a least-squares fit to our data to obtain
(2)
where numbers in parentheses are the standard errors on the parameters. Parameter c was found statistically irrelevant, showing that MgO solubility is independent of pressure. The regression is plotted along with the experimental data in Fig. 1 and shows an exceptionally good fit with an R2 of 0.96. This confirms that reaction (Eq. 1) accurately describes the process of MgO dissolution in iron, and that pressure has no observable effect. Aluminum solubility also takes place and can similarly be quantified (Extended Data Fig. 2), as discussed in Methods. At extreme temperatures, however, the two-component system vanishes to a single homogeneous miscible (solvus) metal-silicate phase4. In that case, reaction (Eq. 1) ceases to describe the system because neither of the phases (metal and silicate) is present. The MgO content of the homogeneous melt is then solely a function of the original bulk composition of the two-phase system.
Europe PMC Funders Author Manuscripts
In order to estimate the amount of MgO that can be dissolved in the core during formation, we ran a series of multistage core formation models5 where the planet was grown to its present mass by iterative accretion and core–mantle differentiation of material (see Methods). The magnesium concentrations in the growing core and mantle were calculated iteratively along with other lithophile (O, Si, Al) and siderophile (Ni, Co, Cr, and V) elements. Over 8000 simulations were performed sampling parameter space, and only geochemically consistent models (where the final concentrations of Ni, Co, Cr, and V in the silicate matches present-day mantle abundances) were retained5.
For core formation without a giant impact, we found a maximum of 0.8 wt.% MgO in the core, in the most favorable (hottest geotherm and deepest magma ocean) case. For a present-day temperature18 at the core–mantle boundary (CMB) of 4100 K, the MgO equilibrium value (saturation threshold) in the core is 1.1 wt.% (Fig. 1b). The core is therefore under-saturated in MgO so that any primordial magnesium dissolved during formation would not exsolve to the mantle.
Then we ran a series of core formation models that involve a final giant impact. In the Moon-forming giant impact scenario6, the impactor is thought of typically as a Mars-sized planetary embryo, but models range from 2.5% to 20% Earth masses19,20. With such a size, the impactor is a differentiated object with a core and mantle, and the temperatures during the impact are sufficiently high that the impactor core and the surrounding silicate mantle turn into a single miscible metal-silicate phase (see Methods). As this dense
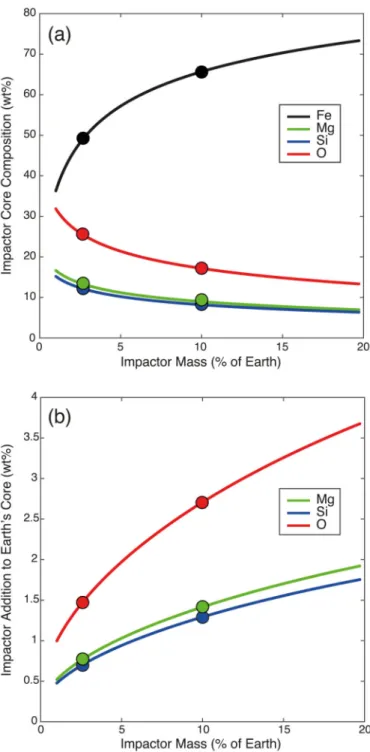
silicate-saturated metallic object (hereafter called the “hybridized impactor core”, HIC) merges with the Earth’s core, it strongly increases the latter’s lithophile element content. We calculated the composition of the HIC as a function of impactor size (Fig. 2a) by assessing its dilution ratio21 (see Methods) in the magma ocean, i.e. the relative mass of magma ocean that the impactor core interacts with. The amounts of Mg, Si, and O brought by the HIC to Earth’s core are plotted in Fig. 2b.
The total MgO dissolved in the core (Extended Data Fig. 3) ranges between 1.6 and 3.6 wt. %. Those values are higher than the 1.1 wt.% saturation value at the present-day CMB, implying that the core became over-saturated in MgO as it cooled. The excess MgO must have exsolved to the mantle and provided a large source of potential energy7,16 to drive an early dynamo. Since MgO solubility depends on temperature but not on pressure, MgO exsolution in the core takes place at the CMB, where the temperature is lowest. As MgO exsolves from the metal, the residue becomes denser and sinks, and is replaced by lighter MgO-bearing metal. This process ensures the entire core is processed at the CMB, so that the equilibrium concentration at the CMB (Fig. 1b) sets the concentration in the whole core. We estimated the energy released by MgO exsolution by calculating the difference in gravitational energies (ΔEgrav) of the core before and after exsolution, where the gravitational energy in each state is given by
(3)
Europe PMC Funders Author Manuscripts
where G is the gravitational constant, M(r) is the mass of the core comprised below radius r,
ρ(r) is the density of the core at radius r, and R the radius of the core.
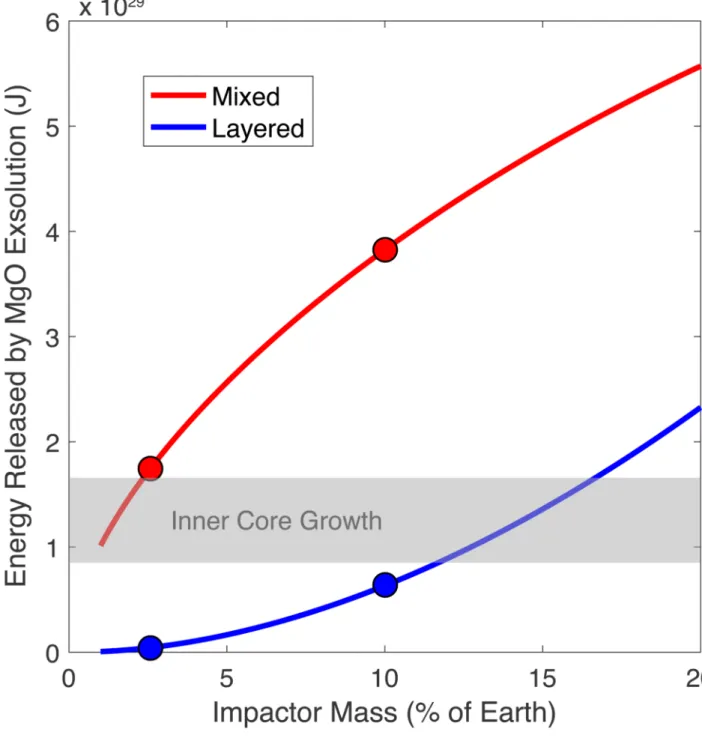
The energy release depends on how the HIC mixes with Earth’s core, as shown by the dependence on ρ(r) in Eq. (3). We investigated two extreme models of mixing: (i) full mixing of the HIC with Earth’s core producing a homogeneous core, and (ii) full layering where the HIC sits atop Earth’s core (see Methods). The energy release as a function of impactor size is plotted in Fig. 3. In the mixed case, it yields between 1 and 5.5x1029 J. For comparison, the total energy release from inner core growth (latent heat and buoyancy) ranges8,12 between 0.9 and 1.7x1029 J. The layered model provides less energy for small impacts (Fig. 3), but again reaches and exceeds the energy released by inner core growth for Mars-sized impactors or larger.
Since MgO solubility depends only on temperature, the power release and onset time of MgO exsolution depend on the temperature evolution at the CMB, which itself depends on the initial MgO concentration in the core (see Methods). Although the early evolution of CMB temperature is uncertain, as an example we adopt an a priori CMB temperature18 model. Prior to inner core growth, the exsolution rate is high as shown in Extended Data Fig. 4, and generates power in excess of ~3 TW (a conservative estimate of how much power is required to run a geodynamo by compositional buoyancy22) over the course of exsolution (Extended Data Fig. 5). With the onset of inner core growth, the cooling and exsolution rates decrease, and the power drops to ~1 TW (see Methods). In terms of timing, the onset of exsolution occurs once the (decreasing) MgO saturation value at the CMB reaches the concentration in the core (Extended Data Fig. 5). For our nominal model, this occurs ~1 Gyr after Earth’s formation with a Mars-sized impact and shifts up to ~2.3 Gyr in the case of a small “fast spinning” impact (see Methods).
Rapid initial cooling following a giant impact may have driven an early thermal dynamo. However, our experimental results show that MgO exsolution likely dominated the core’s energy budget in the intermediate period between early, rapid cooling and the onset of inner core growth. This provides a tangible basis for an exsolution-driven dynamo7, as well as a plausible mechanism explaining the uninterrupted geological record of magnetism13 in Earth’s rocks and minerals dating to 3.5 Ga or earlier. This mechanism should be relatively ineffective in smaller planets such as Mars or on Earth-sized planets that haven’t
experienced a giant impact, but for super-Earths, where pressures and temperatures could remain super-solvus for extended periods, it represents a novel method of driving potentially detectable present-day dynamos.
Methods
Magnesium and Aluminum Solubility
The thermodynamic process of mantle component solubility involves the solubility of mantle components in the metal phase (Eq. 4), rather than redox exchange as in the case of siderophile element partitioning. The magnesium concentration in the metal ranges between 0.2 mol% and 1 mol% in our experiments. The equilibrium constant of the dissolution reaction
Europe PMC Funders Author Manuscripts
(4)
is
(5)
and its logarithm is proportional to the Gibbs free energy change of reaction (Eq. 4) and can be written
(6)
where parameters a, b, and c correspond to the entropy, enthalpy, and volume changes of reaction (Eq. 4), respectively. Those parameters were fit to the data by linear regression, and c was found statistically irrelevant (no pressure dependence), to yield
(7)
Similarly, the aluminum concentration of in the metal ranges from 0 (below detection limit, explaining 2 fewer points for the Al plot in Extended Data Fig. 2) to 1.1 mol%. The equilibrium constant of the dissolution reaction
(8)
is
(9)
and its logarithm is proportional to the Gibbs free energy change of reaction (Eq. 8) and can be written again in the same form as equation (Eq. 6); fitting to the data by linear regression shows once more that c as statistically irrelevant, and we find
(10)
Europe PMC Funders Author Manuscripts
Saturation Conditions at the Core-Mantle Boundary
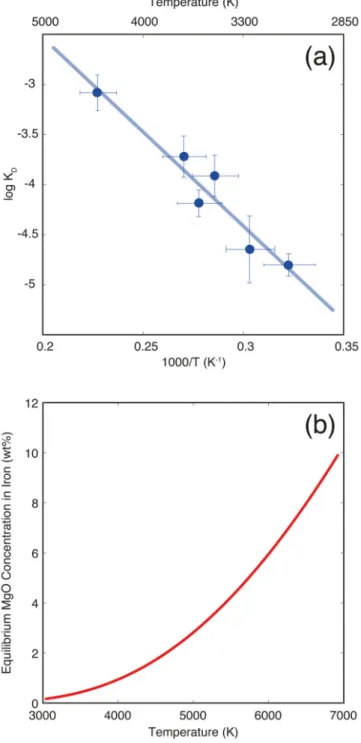
Equations (5), (7), (9), and (10) allow us to calculate the Mg and Al concentration in molten iron as a function of temperature and silicate composition. An important case is that of the equilibrium value in the core at the core–mantle boundary (CMB). As shown above, MgO dissolution in iron has no pressure dependence. This means that MgO exsolves in the coldest part of the core, which is the CMB. The equilibrium value at the CMB is therefore is the MgO saturation value; if the MgO concentration in the core is above saturation, MgO will be exsolved until it reaches that value. Fig. 1b shows the equilibrium value of MgO
concentration in the core as a function of CMB temperature, for a core buffered by (i.e. in local equilibrium with) a pyrolitic magma ocean (50 mol.% MgO in the mantle).
Experimental and Analytical
The silicate glasses were produced in an aerodynamic levitation laser furnace. The starting mixes were made by grinding and mixing from pure oxide (SiO2, MgO, Fe2O3, Al2O3) and carbonate (CaCO3) components, pressing them into pellets, before fusing them at constant fO2 at 1900–2100 °C for 5 minutes in a laser furnace using a 120 W CO2 laser. The fused samples were quenched to glasses, and analyzed for recrystallization, homogeneity, and composition on a Zeiss Auriga field-emission scanning electron microscope (IPGP, Paris). The glass beads were thinned down to 20 μm thick double-parallel thin section, and were processed using a femtosecond laser machining platform to cut disks of identical size for loading in the diamond anvil cell. Spherical iron balls 1–3 μm in size were flattened between two such silicate disks, and constituted the layered starting sample. Pressure was measured from the frequency shift of the first order Raman mode in diamond, measured on the anvil tips. Temperature was measured every second, simultaneously from both sides by
spectroradiometry. Electronic laser shutdown operates in ~2–4 μs, and temperature quench occurs in ~10 μs (owing to thermal diffusion in the sample) ensuring an ultrafast quench of the sample.
After decompression, a thin section (20-by-10 μm wide, 1–3 μm thick) was extracted from the center of the laser-heated spot using a Zeiss Auriga crossbeam focused ion beam microscope (IPGP, Paris). The sample was imaged and then transferred to a TEM copper grid, and the metal and silicate phases were analyzed using a Cameca SX-Five electron microprobe (CAMPARIS, Paris) with 5 large-area WDS analyzers. Metal and silicate phases of the run products are large enough (> 5 μm) to perform reliable analyses with an electron probe micro-analyzer (EPMA) on FIB sections.
Metal and silicate phases were analyzed using a Cameca SX100 and Cameca SX FIVE (CamParis, UPMC–IPGP) electron probe micro-analyzers. X-ray intensities were reduced using the CITZAF correction routine. Operating conditions were 15 kV accelerating voltage, and 10-20 nA beam current and counting times of 10-20 s on peak and background for major elements and 20-40 s for trace elements (including Mg and Al in the metallic phases). Pure Fe metal was used as standard for metal. Fe2O3, SiO2, MgO, and Al2O3 were used as standards to measure solubility of oxygen, silicon, magnesium, and aluminum in metal. Diopside glass (Si), wollastonite (Ca), orthoclase (K), anorthite (Al), albite (Na), rutile (Ti) and pure oxides (Fe2O3, MgO, SiO2, CaO and Al2O3) were used as standards for the
Europe PMC Funders Author Manuscripts
silicate. We verified that the geometry of metal and silicate phases was identical from both sides of the FIB sections, so that the excitation volume of EPMA analyses only samples a single phase. EPMA analyses with 1-2 μm beam size are large enough to integrate the small quench features of metal and silicate phases (<200 nm) and determine their bulk
compositions. When a few small metallic blobs were present in the silicate (500 nm–2 μm diameter) special care was taken to avoid them during analysis of the silicates.
Core Formation Modeling
The core of the Earth formed in the first ~50 million years24,25 of the Solar System, by an iterative addition of material to the proto-Earth. The accreting material, consisting of mixtures of iron-rich metals and silicates similar to those found in extra-terrestrial bodies (chondrite parent bodies, HEDs, angrites, etc.), impacted the growing planet. The heat generated by those impacts maintained the outermost portion of the planet in a molten state known as a magma ocean26. At temperatures below the solvus of iron and silicate, the two phases unmix and the metal (twice denser) segregates towards the center and forms the core. Along with the segregating metal, the siderophile elements are stripped to the core, among which are light elements such as Si and O. The depletion of siderophile elements from the mantle has been widely used to constrain the P–T–composition path of core formation, and has shown that the core formed in a deep magma ocean27,28. As the planet accretes, the magma ocean grows deeper; recent models5 show that the concentrations of Ni, Co, Cr, and V in the mantle satisfy terrestrial observables for final magma ocean depth between 1000 and 1700 km, corresponding to final pressures between 40 and 75 GPa and final
temperatures between 3000 K and 4180 K, respectively.
We ran a series of traditional multistage core formation models5 where the planet was accreted to its present mass by 0.1% Earth mass increments, without giant impacts. At each stage the planet grows, and the pressure and temperature of equilibration increase
accordingly. The concentrations of Ni, Co, V, Cr, O, Si, and Mg in the core were calculated iteratively during the 1000 steps of the accretion process. The simulations were run for a variety of redox paths (ranging from very reduced to very oxidized), several geotherms (between the solidus and the liquidus of peridotite), and for all possible magma ocean depths ranging from 0% (magma lake) to 100% (fully molten Earth) of the mantle. We forward-propagated all uncertainties on the thermodynamic parameters governing the partitioning equations, using Monte Carlo simulation. Most models (very deep or very shallow) do not satisfy, within uncertainties, the observed geochemical abundances of Ni, Co, V, and Cr in the mantle and therefore aren’t relevant. We only selected the models that do reproduce the geochemical abundances of Ni, Co, V, and Cr in the present-day mantle, and found that the maximum MgO concentration in the core at the end of accretion is 0.8 wt.%.
Giant Impact Modeling
In the Moon-forming giant impact scenario6, the impactor is thought of typically as a Mars-sized planetary embryo, but models range from 2.5% to 20% Earth masses19,20. With such a size, the impactor is a differentiated object with a core and mantle, and therefore (as opposed to small accretionary building blocks) it does not fully equilibrate with the entire magma ocean, but rather partially equilibrates29 with a small portion2,21 of that magma
Europe PMC Funders Author Manuscripts
ocean. The impactor and the magma ocean (in the impact zone) reach tremendous temperatures during the impact, as shown by smoothed-particle hydrodynamic
simulations19,20. Even though the temperatures from those simulations can be inaccurate because of intrinsic inaccuracies in the equations of state that they are based on, the
minimum temperature19 for the impactor core is 8000 K and that of the magma ocean in the impacted area is 7000 K. Therefore, the system consisting of the impactor core and the surrounding silicate mantle is necessarily always hotter than 7000 K, and turns into a single miscible metal-silicate phase.
We calculated the composition of Earth’s core after the giant impact in two steps. First, we modeled the pre-giant impact accretionary phase. The Earth was partially accreted as described in the previous paragraph, until it reached 80 to 99% Earth mass, leaving the planet in the state it was in prior to the giant impact. We only considered the models that reproduce the present-day geochemical abundances of Ni, Co, V, and Cr in the mantle. Then the final accretion event took place, consisting of the giant impact bringing in the remaining 1 to 20% of Earth’s mass. We calculated the composition of the “hybridized impactor core” (HIC) as a function of its size (Fig. 2a) considering the fact that as opposed to small accretionary building blocks, the core of the giant impactor does not fully equilibrate with the entire magma ocean; it rather partially equilibrates29 with a small portion2,21 of that magma ocean (see Partial Core Equilibration and Turbulent Fragmentation and Mixing section below). It is clear from Fig. 2a the bigger the impactor, the smaller the relative mass of magma ocean it interacts and equilibrates with, and consequently the less mantle components (Mg, O, Si) the HIC contains. The net effect on Earth’s core, once the HIC is added, is mitigated as shown in Fig. 2b; it is the result of the balance between larger HICs being less enriched in mantle component, but contributing more mass to the whole core. Partial Core Equilibration and Turbulent Fragmentation and Mixing
The composition of the HIC was calculated by taking into account two main parameters that are usually neglected in traditional core formation models2,3,5,28,30.
First, the degree of partial equilibration, i.e. the fraction of the core that equilibrates with the mantle, has been constrained by geochemical modeling, from the combined analysis of the Hf–W and U–Pb isotopic systems, and shown to be at least25,29,31 40%. We used that conservative lower bound, meaning that 60% of the impactor core merges with Earth’s core without equilibration (and therefore with no compositional effect) whereas the other half equilibrates in the magma ocean before merging with the core.
Second, the impactor core only “sees” a portion2 of the magma ocean and that fraction involved in the equilibration was estimated from fragmentation and turbulent mixing scaling laws21; those show that the ratio of equilibrated silicate to equilibrated metal (dilution ratio Δ) in the magma ocean is given by
(11)
Europe PMC Funders Author Manuscripts
where ρsilicate and ρmetal are the densities of silicate and metal, and δ is the ratio of impactor to Earth mass.
MgO Exsolution Energy
The energy release depends on how the HIC mixes with Earth’s core, as shown by the dependence on ρ(r) in Eq. (3). Even though simulations20 and energetic arguments32 both suggest that the HIC should thoroughly mix with Earth’s core, we investigated two extreme models of mixing: (i) full mixing of the HIC with Earth’s core producing a homogeneous core, and (ii) full layering where the HIC sits atop Earth’s core.
In the mixed case, the HIC is diluted in the bulk of Earth’s core and therefore the Si and O content delivered by the impactor are below the saturation limit of those elements5,30,33 (Fig. 2b); those concentrations are under-saturated with respect to the overlying conditions imposed by the magma ocean at the core-mantle boundary, and there is no chemical drive to force those components out of the system. In that case, we considered that MgO is the only phase to exsolve so that the associated energy release is a conservative lower bound. In the layered case, the HIC is concentrated atop the proto-core, and all three mantle components (MgO, SiO2, and FeO) are highly concentrated in the layer, and over-saturated with respect to core-mantle boundary conditions prevailing atop that layer. In that case, all of those components would exsolves and remix with the overlying magma ocean.
In our energy calculations, we fixed the present-day CMB temperature to 4100 K. Lower temperatures imply a lower saturation level in the core, and mean that more MgO exsolves and more energy is produced, and conversely. The final density and radius of the core are the present-day values (10.6 g/cm3 and 3485 km, respectively).
Impactor Core Mixing
We considered a uniform core of density ρ and radius R; it subsequently undergoes unmixing into an inner (dense) region with density ρc and radius Rc (the present-day values above), and an outer buoyant layer with density ρlayer. The volume fraction of the outer layer is f, which we take to be <<1. We may write
(12)
and
(13)
where equation (13) is correct to first order in f. In practice, we specify ρc and ρlayer (4.8 g/cm3 for MgO) and calculate ρ and R for a given value of f, with the current core boundary taken to be Rc. The gravitational energy E of the core in either state may be derived using (Eq. 3), and the change in energy ΔE in going from the uniform to the unmixed state can be
Europe PMC Funders Author Manuscripts
available to do work (e.g. to drive a dynamo). Making use of equations (3), (12) and (13), it may be shown that, to first order in f:
(14)
For f = 20%, equation (14) overestimates the full calculation (plotted in the figures) by about 5%; the discrepancy is smaller with smaller f, and equation (14) can be used to a good approximation to estimate the amount of energy released by lithophile element exsolution from the core. This equation shows the correct limiting behavior in the cases of f=0 and
ρc=ρlayer. Impactor Core Layering
In this case we take the mass fraction of the Earth’s core added by the HIC to be fm. Assuming the HIC density to have a density equal to ρi and the present-day total core mass to be Mc, the radius of the base of the impactor layer R1 prior to unmixing of this layer is given by
(15)
The HIC layer then undergoes unmixing into two components: “mantle components” (ρ2, 5.6 g/cm3) and “core material” (ρ1, 10.6 g/cm3). The HIC density ρi may then be derived using
(16)
where R2 is the radius of the base of the light element layer after unmixing. To make the total core mass correct, the density of the pre-impact core, ρc, is also calculated. Once ρi, R1 and R2 have been calculated, the energy change due to unmixing within the layer can be calculated using successive applications of equation (14) as before.
Thermal Evolution and Exsolution Power
Using a CMB temperature evolution model, we can estimate the MgO exsolution rate, and hence an exsolution power, as a function of time. A typical CMB temperature evolution is shown in Extended Data Fig. 4a, along with the associated MgO content of the core (Extended Data Fig. 4b) obtained by rewriting the MgO equilibrium curve (Fig. 1b) as a function of time. The time derivatives are the core’s cooling rate and its MgO exsolution rate as a function of time, and are plotted in Extended Data Fig. 4c and 4d, respectively.
Very early in Earth’s history, the equilibrium MgO concentration at the CMB (Extended Data Fig. 4b) is higher than the core’s MgO content, and no exsolution occurs. The reverse reaction, i.e. the potential for MgO to be dissolved from the mantle to the core is limited; it
Europe PMC Funders Author Manuscripts
is prone to only affect a thin layer below the CMB that is enriched in MgO, becomes light and stably stratified, and therefore incapable to recycle and affect the entire core. As the core cools, exsolution starts once the temperature at the CMB reaches a critical value
corresponding to an MgO equilibrium concentration equal to that in the core. This is shown in Extended Data Fig. 5, and is highlighted for two models: the Mars-size impact19 leaving behind a core containing 2.9 wt% MgO and a small “fast-spinning” impact20 producing a core containing 2.1 wt% MgO (see Fig. 2b and Extended Data Fig. 3). The power produced by MgO exsolution is linked to exsolution rate, and it can be estimated from the energy release (Fig. 3 and Extended Data Fig. 8) to be between 5.5 and 7 TW/wt.%/Ga. This allows us to translate an exsolution rate (Extended Data Fig. 4d) into exsolution power, as shown in Extended Data Fig. 5b and 8.
What is noteworthy is that initial MgO core content doesn’t directly affect exsolution power. The latter is only a function of exsolution rate, itself a function of core cooling rate. Initial MgO content only sets the onset of exsolution as shown in Extended Data Fig. 5. Of course, higher MgO contents in the core entail an earlier onset of exsolution, a longer duration for buoyancy-driven exsolution power, and hence much higher total exsolution energies as clearly shown in Fig. 3. Note that this dichotomy could be mitigated had we self-consistently included MgO exsolution in the thermal evolution model of the core. MgO exsolution power dramatically drops with the onset of inner core growth, as a consequence of the drop in core cooling rate. At the present day, MgO exsolution should still produce ~1 TW of power, much lower than the ~3 TW produced by inner core growth and driving the geodynamo. However, prior to inner core growth, exsolution power is always higher than ~3 TW, demonstrating that MgO exsolution can conceivably drive a geodynamo as early as ~1 Ga after core formation, and until the onset of inner core growth.
The Geodynamo
Assuming an entirely bottom-driven present-day dynamo, corresponding to a core-mantle boundary heat flow exactly at the adiabatic value Qad of 15 TW34,35, the convective power sustaining the geomagnetic field P = ε Qad is 3 TW, where ε=0.2 is the thermodynamic efficiency of latent heat and light element release at the inner core boundary22. Power-based scaling laws of the magnetic intensity36 then predict an internal magnetic field of about 1–4 mT, the higher estimate being in agreement with the observation of magnetic Alfvén waves in the core37 coupled to length-of-day variations at periods close to 6 years38.
Dynamo strength increases as buoyancy flux increases39,40, so the MgO exsolution mechanism represents a potent driver of an early geodynamo7. Although a giant impact might cause thermal stratification in the core12,41, the stabilizing thermal buoyancy will be completely overwhelmed by the compositional buoyancy associated with MgO exsolution.
Europe PMC Funders Author Manuscripts
Extended Data
Extended Data Figure 1. A fully molten metal-silicate sample recovered from the laser-heated diamond anvil cell.
A backscattered electron scanning electron microscopy image of a thin section recovered from a laser heated diamond anvil cell experiment. The section is excavated and lifted out from the center of the heated region then thinned down to 3 microns using a focused ion beam instrument. The metal and the silicate are both fully molten, as indicated by the coalesced metallic ball in the center and the circular rim of silicate around it. This sample was compressed to 55 GPa and heated to 3,600 K for 60 seconds.
Europe PMC Funders Author Manuscripts
Extended Data Figure 2. Magnesium and aluminum solubility in metallic iron melt at high pressure and temperature.
(top) Equilibrium constant for MgO dissolution in molten iron as a function of reciprocal temperature. The circles correspond to the experimental data (Extended Data Table 1) and error bars to standard error, while the squares correspond to the low-temperature
extrapolation of DFT calculations4. The thick line corresponds to the least-squares linear fit to the experimental data alone (Fig. 1); it shows the remarkable agreement between the theoretical and experimental datasets, especially at high temperature where the theoretical dataset (which is extrapolated from higher temperatures) is the least influenced by
Europe PMC Funders Author Manuscripts
extrapolation. (bottom) Equilibrium constant for Al2O3 dissolution (see Methods) in molten iron as a function of reciprocal temperature. The circles correspond to the experimental data (Extended Data Table 1) and error bars to standard error. The thick line corresponds to the
least-squares linear fit to the data (R2=0.92), and we find .
Extended Data Figure 3. Total MgO dissolved in the core after the giant impact.
A companion to Fig. 2, it is the sum of the MgO component dissolved in the core prior to the impact (0.8 wt.%) and that brought by the HIC. The 10% Mars-size impact19 and 2.5%
Europe PMC Funders Author Manuscripts
“fast-spinning” impact20 are highlighted by circles, and provide 2.9 wt.% and 2 wt.% MgO to the core, respectively.
Extended Data Figure 4. Thermal evolution of the core and MgO exsolution rate.
(a) Example CMB temperature evolution as a function of time (after core-formation) from Fig 4a of ref. 18, and its derivative (c), which is the cooling rate. (b) The associated MgO equilibrium concentration in the core, obtained by turning the temperature dependence in Fig. 1b into time dependence; and its derivative (d) which is the exsolution rate. MgO will only start exsolving from the core when the MgO equilibrium concentration (panel b) drops below the MgO content in the core inherited from core formation and the giant impact. Note that core cooling rate and therefore MgO exsolution rate drop dramatically with the onset of
Europe PMC Funders Author Manuscripts
inner core growth. The core at the present day is still exsolving MgO, albeit at a much slower rate than that prior to inner core growth.
Extended Data Figure 5. Onset of MgO exsolution and associated exsolution power for two typical models.
(a) The MgO equilibrium concentration in the core (same figure as Extended Data Fig. 4b), corresponding to our nominal CMB temperature evolution. The onset of MgO exsolution from the core occurs when the MgO equilibrium concentration drops below the MgO content in the core, which is reported here in two cases: 2.9 wt.% for the Mars-sized
Europe PMC Funders Author Manuscripts
impactor, and 2.1 wt.% for the “fast-spinning” impactor. For the thermal evolution model in Extended Data Fig. 4a, this onset is at 1.1 Ga and 2.3 Ga, respectively. (b) and (c) Exsolution power for these two cases which is proportional to the MgO exsolution rate plotted in Extended Data Fig. 4d. It is noteworthy that power at a given time is independent of initial MgO content (as long as MgO is being exsolved). The latter only affects the onset of exsolution and therefore the duration of energy release. We also note that the power produced is in excess of 3 TW, and therefore sufficient to drive a dynamo by compositional buoyancy. Finally, the power drops dramatically with the onset of inner core growth, because of the associated drop in core cooling rate and MgO exsolution rate. The core at the present day is still exsolving MgO, and should produce ~1 TW of power, significantly less than the power produced by inner core growth.
Europe PMC Funders Author Manuscripts
Extended Data Figure 6. Equilibrium Mg and MgO concentration in the core as a function of CMB temperature.
This is obtained by rewriting into
with XMgO=0.5 (pyrolitic mantle). This curve (red for MgO, blue for Mg) allows determining magnesium saturation in the core at a given temperature. This threshold is important to (i) estimate the present-day MgO content of the core, and hence how much MgO was lost by exsolution over geologic time (Extended Data
Europe PMC Funders Author Manuscripts
Fig. 4), and to (ii) estimate the temperature at which MgO exsolution started after core formation (Extended Data Fig. 5). For instance, for a core containing 2.9 wt.% MgO (for a Mars-sized impact, see Extended Data Fig. 3), exsolution is not bound to occur until the temperature at the CMB cools below 5030 K. Moreover, if the present-day CMB
temperature is 4100 K, the MgO saturation in the present-day core is 1.1 wt.%, so that the total amount of MgO that can be exsolved from the core isn’t the total initial MgO content, but that amount minus the present-day saturation value.
Extended Data Figure 7. Chemical effect of equilibration of the impactor’s core in Earth’s magma ocean.
Europe PMC Funders Author Manuscripts
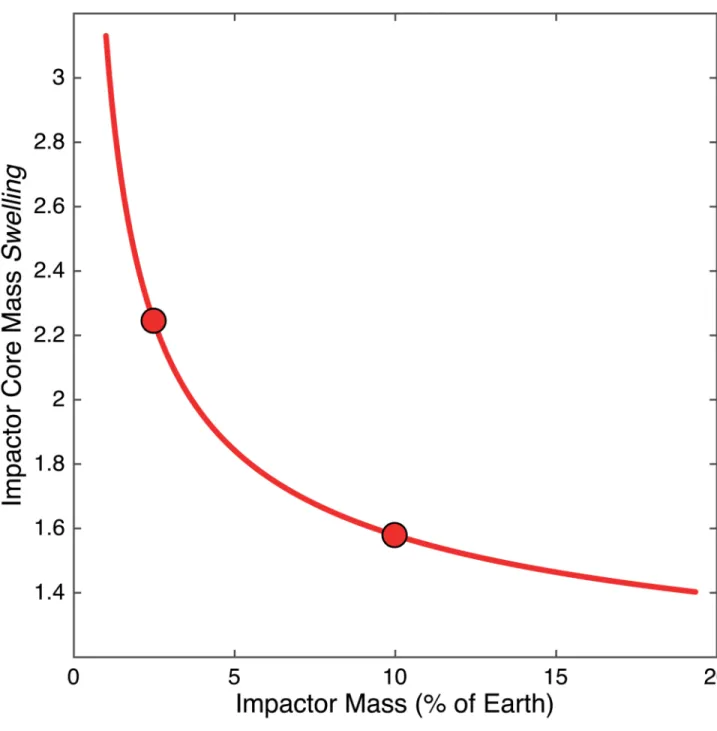
Another companion to Fig. 2, a plot showing the “swelling” of the impactor core to form the hybridized impactor core (HIC). The HIC is larger than the impactor core because of the dissolved mantle components therein, which can represent up to two times its initial mass. This y-axis shows the “swelling” factor, e.g. the ratio of HIC to impactor core
. This is equivalent to an effective dilution ratio. Small impactors interact with larger relative fractions of the magma ocean; therefore they
incorporate more mantle components per unit mass than large impactors, and “swell” more. The HIC of a “fast-spinning” impactor20 (2.5% Earth mass) is 2.2 times larger that the original impactor core, with 45% of its mass made of initial impactor core material (iron) and the remaining 55% consisting of magma ocean components, as shown in Fig. 2a. On the other hand, the core of a Mars-sized impactor19 (10% Earth mass) is 60% larger after equilibration with the magma ocean.
Europe PMC Funders Author Manuscripts
Extended Data Figure 8. Power released by exsolution if it occurs over 1 Gyr.
A companion to Fig. 3, the gravitational energy released by exsolution is converted into average power, assuming a characteristic time of exsolution of 1 Gyr. Again, the red curve corresponds to the energy released if the HIC fully mixes with Earth’s core, and the blue curve corresponds to the energy released if the HIC forms a layer on top of Earth’s core. The gray horizontal band corresponds to 3 TW, the power driving the dynamo today, and thus provides a conservative estimate as to how much power is required to run a geodynamo by compositional buoyancy22 [ref 37]. The 10% Mars-size impact19 and 2.5% “fast-spinning” impact20 are highlighted by circles. Note that the blue curve represents a lower-bound to the
Europe PMC Funders Author Manuscripts
energy released in case of layering of the HIC, because the layer contains so much lithophile elements that it would exsolve much faster, producing more power, albeit during a shorter period. By proportionality, this plot can be used to infer the power release for any characteristic exsolution time.
Extended Data Table 1
Analyses of the Mg and Al concentrations in the metal and silicate phases of the experimental runs.
Experimental conditions (pressure in GPa, temperature in K, uncertainties in parentheses) and phase composition; all compositions are in molar fractions, and standard errors are 1-sigma. The values for log KD are plotted in Fig. 1 and Extended Data Fig. 2. Full chemical analyses of the samples can be found in an excel spreadsheet available online.
Run X1_2 X1_3 X1_4 X2_4 X4_2 X6_1 P (GPa) T(K) 71 (5) 3500 (140) 35 (3) 3300 (130) 50 (4) 3700 (150) 74 (5) 4400 (180) 55 (4) 3600 (150) 43 (3) 3100 (130) Mg (metal) std err 0.0042 0.0006 0.0017 0.0004 0.0088 0.0012 0.0094 0.0011 0.0053 0.0005 0.0026 0.0002
MgO (silicate) std err 0.1446 0.0062 0.1285 0.0034 0.4081 0.0286 0.1073 0.0072 0.4324 0.0036 0.4285 0.0070 log KD std err -3.9 0.19 -4.7 0.35 -3.7 0.21 -3.1 0.18 -4.2 0.13 -4.8 0.10 Al (metal) std err 0.0018 0.0003 0.0113 0.0002 0.0008 0.0002 0.0003 0.0002
AlO1.5 (silicate) std err 0.0486
0.0036 0.1651 0.0068 0.0512 0.0012 0.0511 0.0013 log KD std err -5.5 0.26 -4.1 0.05 -6.5 0.39 -7.4 1.07
Supplementary Material
Refer to Web version on PubMed Central for supplementary material.
Acknowledgements
The research leading to these results has received funding from the European Research Council under the European Community’s Seventh Framework Programme (FP7/2007-2013) / ERC grant agreement n° 207467. Parts of this work were supported by the UnivEarthS Labex program at Sorbonne Paris Cité (ANR-10-LABX-0023 and ANR-11-IDEX-0005-02), IPGP multidisciplinary program PARI, and by Paris–IdF region SESAME Grant no. 12015908. JS acknowledges support from the French National Research Agency (ANR project VolTerre, grant no. ANR‐14‐CE33‐0017‐01). We thank Julien Aubert, Sarah Stewart, and Paul Asimow for fruitful discussions. We thank Rick Ryerson for valuable comments on the manuscript.
References
1. Ringwood AE. Chemical Evolution of Terrestrial Planets. Geochimica Et Cosmochimica Acta. 1966; 30:41–&. DOI: 10.1016/0016-7037(66)90090-1
2. Rubie DC, Melosh HJ, Reid JE, Liebske C, Righter K. Mechanisms of metal-silicate equilibration in the terrestrial magma ocean. Earth and Planetary Science Letters. 2003; 205:239–255.
3. Wood BJ, Walter MJ, Wade J. Accretion of the Earth and segregation of its core. Nature. 2006; 441:825–833. [PubMed: 16778882]
Europe PMC Funders Author Manuscripts
4. Wahl SM, Militzer B. High-temperature miscibility of iron and rock during terrestrial planet formation. Earth and Planetary Science Letters. 2015; 410:25–33. DOI: 10.1016/j.epsl.2014.11.014 5. Badro J, Brodholt JP, Piet H, Siebert J, Ryerson FJ. Core formation and core composition from
coupled geochemical and geophysical constraints. Proceedings of the National Academy of Sciences of the United States of America. 2015; 112:12310–12314. DOI: 10.1073/pnas.1505672112 [PubMed: 26392555]
6. Hartmann WK, Davis DR. Satellite-Sized Planetesimals and Lunar Origin. Icarus. 1975; 24:504– 515. DOI: 10.1016/0019-1035(75)90070-6
7. O’Rourke JG, Stevenson DJ. Powering Earth’s dynamo with magnesium precipitation from the core. Nature. 2015; In Press. doi: 10.1038/nature16495
8. Nimmo, F. Treatise on Geophysics (Second Edition). Elsevier; 2015. p. 27-55.
9. Lister JR, Buffett BA. The Strength and Efficiency of Thermal and Compositional Convection in the Geodynamo. Physics of the Earth and Planetary Interiors. 1995; 91:17–30.
10. Labrosse S, Poirier JP, LeMouel JL. On cooling of the Earth’s core. Physics of the Earth and Planetary Interiors. 1997; 99:1–17. DOI: 10.1016/S0031-9201(96)03207-4
11. Gubbins D, Alfe D, Masters G, Price GD, Gillan MJ. Can the Earth’s dynamo run on heat alone? Geophysical Journal International. 2003; 155:609–622.
12. Labrosse S. Thermal evolution of the core with a high thermal conductivity. Physics of the Earth and Planetary Interiors. 2015; 247:36–55. DOI: 10.1016/j.pepi.2015.02.002
13. Tarduno JA, et al. Geodynamo, Solar Wind, and Magnetopause 3.4 to 3.45 Billion Years Ago. Science. 2010; 327:1238–1240. DOI: 10.1126/science.1183445 [PubMed: 20203044]
14. Labrosse S, Hernlund JW, Coltice N. A crystallizing dense magma ocean at the base of the Earth’s mantle. Nature. 2007; 450:866–869. [PubMed: 18064010]
15. Buffett BA, Garnero EJ, Jeanloz R. Sediments at the top of Earth’s core. Science. 2000; 290:1338– 1342. [PubMed: 11082058]
16. Stevenson D. Core Exsolution: A Likely Consequence of Giant Impacts and a Likely Energy Source for the Geodynamo. Eos Trans AGU. 2007; 88 Fall Meet. Suppl.-Abstract U21D-02. 17. Buffett BA. Earth’s core and the geodynamo. Science. 2000; 288:2007–2012. [PubMed:
10856207]
18. Nimmo, F. Treatise on Geophysics (Second Edition). Elsevier; 2015. p. 201-219.
19. Canup RM. Forming a Moon with an Earth-like Composition via a Giant Impact. Science. 2012; 338:1052–1055. DOI: 10.1126/science.1226073 [PubMed: 23076098]
20. Cuk M, Stewart ST. Making the Moon from a Fast-Spinning Earth: A Giant Impact Followed by Resonant Despinning. Science. 2012; 338:1047–1052. DOI: 10.1126/science.1225542 [PubMed: 23076099]
21. Deguen R, Landeau M, Olson P. Turbulent metal-silicate mixing, fragmentation, and equilibration in magma oceans. Earth and Planetary Science Letters. 2014; 391:274–287. DOI: 10.1016/j.epsl. 2014.02.007
22. Aubert J, Labrosse S, Poitou C. Modelling the palaeo-evolution of the geodynamo. Geophysical Journal International. 2009; 179:1414–1428. DOI: 10.1111/j.1365-246X.2009.04361.x
23. Badro J, Cote AS, Brodholt JP. A seismologically consistent compositional model of Earth’s core. Proceedings of the National Academy of Sciences of the United States of America. 2014; 111:7542–7545. DOI: 10.1073/pnas.1316708111 [PubMed: 24821817]
24. Kleine T, Mezger K, Munker C, Palme H, Bischoff A. Hf-182-W-182 isotope systematics of chondrites, eucrites, and martian meteorites: Chronology of core formation and early mantle differentiation in Vesta and Mars. Geochimica Et Cosmochimica Acta. 2004; 68:2935–2946. 25. Yin QZ, et al. A short timescale for terrestrial planet formation from Hf-W chronometry of
meteorites. Nature. 2002; 418:949–952. [PubMed: 12198540]
26. Murthy VR. Early Differentiation Of The Earth And The Problem Of Mantle Siderophile Elements - A New Approach. Science. 1991; 253:303–306. DOI: 10.1126/science.253.5017.303 [PubMed: 17794697]
27. Li J, Agee CB. Geochemistry of mantle-core differentiation at high pressure. Nature. 1996; 381:686–689.
Europe PMC Funders Author Manuscripts
28. Siebert J, Badro J, Antonangeli D, Ryerson FJ. Metal-silicate partitioning of Ni and Co in a deep magma ocean. Earth and Planetary Science Letters. 2012; 321:189–197. DOI: 10.1016/j.epsl. 2012.01.013
29. Rudge JF, Kleine T, Bourdon B. Broad bounds on Earth’s accretion and core formation constrained by geochemical models. Nature Geoscience. 2010; 3:439–443. DOI: 10.1038/ngeo872
30. Siebert J, Badro J, Antonangeli D, Ryerson FJ. Terrestrial Accretion Under Oxidizing Conditions. Science. 2013; 339:1194–1197. DOI: 10.1126/science.1227923 [PubMed: 23306436]
31. Kleine T, Mezger K, Palme H, Munker C. The W isotope evolution of the bulk silicate Earth: constraints on the timing and mechanisms of core formation and accretion. Earth and Planetary Science Letters. 2004; 228:109–123.
32. Nakajima M, Stevenson DJ. Dynamical Mixing of Planetary Cores by Giant Impacts. Lunar Planet Sci Conf. 2016; 47:2053.http://www.hou.usra.edu/meetings/lpsc2016/pdf/2053.pdf
33. Fischer RA, et al. High pressure metal-silicate partitioning of Ni, Co, V, Cr, Si, and O. Geochimica Et Cosmochimica Acta. 2015; 167:177–194. DOI: 10.1016/j.gca.2015.06.026
34. Pozzo M, Davies C, Gubbins D, Alfe D. Thermal and electrical conductivity of iron at Earth’s core conditions. Nature. 2012; 485:355–U399. DOI: 10.1038/nature11031 [PubMed: 22495307] 35. de Koker N, Steinle-Neumann G, Vlcek V. Electrical resistivity and thermal conductivity of liquid
Fe alloys at high P and T, and heat flux in Earth’s core. Proceedings of the National Academy of Sciences of the United States of America. 2012; 109:4070–4073. DOI: 10.1073/pnas.1111841109 [PubMed: 22375035]
36. Christensen UR. A deep dynamo generating Mercury’s magnetic field. Nature. 2006; 444:1056– 1058. [PubMed: 17183319]
37. Gillet N, Jault D, Canet E, Fournier A. Fast torsional waves and strong magnetic field within the Earth’s core. Nature. 2010; 465:74–77. DOI: 10.1038/nature09010 [PubMed: 20445627] 38. Buffett BA. Gravitational oscillations in the length of day. Geophysical Research Letters. 1996;
23:2279–2282.
39. Olson P, Christensen UR. Dipole moment scaling for convection-driven planetary dynamos. Earth and Planetary Science Letters. 2006; 250:561–571. DOI: 10.1016/j.epsl.2006.08.008
40. Christensen UR, Aubert J. Scaling properties of convection-driven dynamos in rotating spherical shells and application to planetary magnetic fields. Geophysical Journal International. 2006; 166:97–114. DOI: 10.1111/j.1365-246X.2006.03009.x
41. Arkani-Hamed J, Olson P. Giant impacts, core stratification, and failure of the Martian dynamo. Journal of Geophysical Research-Solid Earth. 2010; 115:E07012.doi: 10.1029/2010je003579
Europe PMC Funders Author Manuscripts
Figure 1. Magnesium solubility in metallic iron melt at high pressure and temperature.
(a) Equilibrium constant for MgO dissolution in iron as a function of reciprocal temperature (Eq. 2). The experimental data is from Extended Data Table 1. The line corresponds to the least-squares linear fit to the data. A comparison with extrapolation from DFT calculations4 is shown in Extended Data Fig. 2. (b) The resulting MgO concentration in iron in
equilibrium with pyrolite as a function of temperature. This is obtained by rewriting (Eq. 2)
to obtain , where T is temperature in K, and then converting
Europe PMC Funders Author Manuscripts
Mg molar fractions to MgO weight fractions. This is the saturation MgO concentration in the core at a given temperature, and shows that for a present-day CMB temperature of 4100 K, the core cannot contain more than 1.1 wt.% MgO: any MgO dissolved in the core (during core formation) in excess of that value must have exsolved. For an extended version of this graph, see Extended Data Fig. 6.
Europe PMC Funders Author Manuscripts
Figure 2. Composition of the core of the giant impact after equilibration in the magma ocean, and its effect of Earth’s core composition.
(a) The composition of the hybridized impactor core (HIC), plotted as a function of impactor mass. Smaller impactors interact and equilibrate with larger relative amounts of magma ocean material; they “swell” (see Extended Data Fig. 7) and become very enriched in Mg, Si, and O. (b) The compositional imprint of the giant impact on the core; between 2 and 8% of the core’s total mass consist of mantle material transported by the HIC. The Si and O concentrations added to the core are lower than the amounts present in the core prior to the
Europe PMC Funders Author Manuscripts
impact23. This shows that the giant impact’s significant contribution to core chemistry is the magnesium influx. The 10% Mars-size impact19 and 2.5% “fast-spinning” impact20 are highlighted by circles.
Europe PMC Funders Author Manuscripts
Figure 3. Gravitational energy released by the exsolution of buoyant lithophile components from the core after the giant impact.
Calculated following equation (3), the red curve corresponds to the energy released if the HIC fully mixes with Earth’s core. In that case, MgO exsolution occurs up to the current saturation limit (Fig. 1b). The blue curve corresponds to the energy released if the HIC forms a layer on top of Earth’s core. In that case, the layer is so rich in lithophile elements (Fig. 2a) that the exsolution of all dissolved mantle components (MgO and SiO2) takes place. The 10% Mars-size impact19 and 2.5% “fast-spinning” impact20 are highlighted by circles. The gray horizontal band corresponds to the energy release by inner core growth
Europe PMC Funders Author Manuscripts
(gravitational + latent heat) since its inception, and is the main driver for the geodynamo today. The energies released by MgO exsolution are on the order of, if not significantly higher than, those released by inner core growth and show the effectiveness of lithophile element exsolution to drive an early dynamo. The average power of exsolution can be estimated assuming an exsolution time (Extended Data Fig. 9) or a temperature evolution model of the core (Extended Data Fig. 5).