HAL Id: hal-00316880
https://hal.archives-ouvertes.fr/hal-00316880
Submitted on 1 Jan 2001
HAL is a multi-disciplinary open access
archive for the deposit and dissemination of
sci-entific research documents, whether they are
pub-lished or not. The documents may come from
teaching and research institutions in France or
abroad, or from public or private research centers.
L’archive ouverte pluridisciplinaire HAL, est
destinée au dépôt et à la diffusion de documents
scientifiques de niveau recherche, publiés ou non,
émanant des établissements d’enseignement et de
recherche français ou étrangers, des laboratoires
publics ou privés.
measurement with the Multiple Antenna Profiler
(MAPR)
S. A. Cohn, W. O. J. Brown, C. L. Martin, M. E. Susedik, G. D. Maclean, D.
B. Parsons
To cite this version:
S. A. Cohn, W. O. J. Brown, C. L. Martin, M. E. Susedik, G. D. Maclean, et al.. Clear air
bound-ary layer spaced antenna wind measurement with the Multiple Antenna Profiler (MAPR). Annales
Geophysicae, European Geosciences Union, 2001, 19 (8), pp.845-854. �hal-00316880�
Annales Geophysicae (2001) 19: 845–854 c European Geophysical Society 2001
Annales
Geophysicae
Clear air boundary layer spaced antenna wind measurement with
the Multiple Antenna Profiler (MAPR)
S. A. Cohn, W. O. J. Brown, C. L. Martin, M. E. Susedik, G. D. Maclean, and D. B. Parsons
NCAR/Atmospheric Technology Division, P.O. Box 3000, Boulder, CO 80307-3000, USA Received: 18 August 2000 – Revised: 19 March 2001 – Accepted: 22 March 2001
Abstract. Spaced antenna (SA) wind measurement
tech-niques are applied to Multiple Antenna Profiler (MAPR) data to evaluate its performance in clear air conditions. MAPR is a multiple antenna 915 MHz wind profiler developed at the National Center for Atmospheric Research (NCAR) and de-scribed in Cohn et al. (1997), designed to make high reso-lution wind measurements. Previous reported measurements with MAPR were restricted to precipitation because of low signal to noise (SNR) and signal to ground-clutter (SCR) ra-tios. By using a standard pulse-coding technique and upgrad-ing the profiler control software, increases in average power and SNR were achieved, making routine measurements in clear air possible. Comparison of winds measured by MAPR and by a sonic anemometer on a nearby 300 m tower show correlation coefficients in the range of R2= 0.75 – 0.80, and an average absolute error of ∼1.4 m s−1. This compares
fa-vorably with the agreement typically found in wind profiler comparisons. We also consider the use of the parameter ah,
which is related to the value of the cross-correlation function at its zero crossing. This parameter is a data quality indicator and possibly a key component in a ground clutter removal technique.
Key words. Meteorology and atmospheric dynamics (mesoscale meteorology; instruments and techniques) – Radio science (remote sensing)
1 Introduction
The National Center for Atmospheric Research (NCAR) Multiple Antenna Profiler (MAPR) was developed both as a testbed for spaced antenna (SA) techniques in the atmo-spheric boundary layer, and as a research tool to measure wind profiles with a time resolution and accuracy not avail-able with conventional boundary layer profilers. SA wind profilers measure the horizontal wind using information from a single (usually vertical) beam direction, with backscatter
Correspondence to: S.A. Cohn ([email protected])
sampled with several separated receivers (e.g. Briggs, 1950). They can measure the wind more frequently than a conven-tional profiler, which uses the Doppler beam swinging (DBS) technique and must dwell sequentially in at least 3 direc-tions. Also, because the wind is found from data collected in a smaller region (the SA beam volume, rather than sev-eral separated beam volumes for DBS), the assumption of spatial and temporal stationarity required by both SA and DBS is more easily met. However, the precision of winds measured with SA techniques is a strong function of SNR (Doviak et al., 1998), so that for weak signals, a DBS pro-filer may provide more accurate winds, even if errors due to non-stationarity are larger. Thus, the SA and DBS wind mea-surement techniques each have advantages in complementary situations (high time resolution in strong SNR, and longer dwell times in weaker conditions).
Cohn et al. (1997) described MAPR and presented mea-surements of vertical profiles of winds with 30-second time resolution and 60-m altitude resolution. Their study com-pared winds measured by MAPR against an anemometer on the 300 m Boulder Atmospheric Observatory (BAO; Kaimal and Gaynor, 1983) tower. The MAPR measurements used backscatter from precipitation because the MAPR sensitivity in clear air was poor, and ground clutter at the BAO site can be strong. From this earlier work, it became clear that both hardware and software upgrades were necessary in order for MAPR to become a useful research tool, measuring winds routinely in both precipitation and clear air. In this paper, we describe recent upgrades to MAPR (Sect. 2), and present an evaluation of its performance in measuring winds in clear air conditions (Sect. 3). These upgrades included increasing the average transmitter power through pulse-coding, developing unix-based software to control the radar, upgrading the radar PC, and improving data quality checks. As in earlier work, the MAPR evaluation makes use of in situ measurements by anemometers at 300 m on the BAO tower, since validation of the high resolution wind measurements with other remote sensors is difficult. We further consider a novel quality con-trol and ground clutter removal idea (Sect. 4) based on a
theo-retical prediction of a parameter (ah), related to the amplitude
of the cross-correlation function at its zero crossing (c12(0)).
Comparing the agreement of theoretical to measured values of ah, we can evaluate the quality of the data. We can further
test how a clutter removal algorithm affects this comparison.
2 Instrumental improvements
The original design of MAPR (Van Baelen, 1994) used a modified version of the Radian LAP-3000 915 MHz bound-ary layer wind profiler (Ecklund et al., 1990; Carter et al., 1995). In this original design, a radar controller PC card gen-erates all timing signals and runs the transmitter. Rather than employing a single receiver, MAPR uses four identical re-ceiver chains, each containing a hardware chain (amplifiers, mixers, filters, etc.), a coherent integrator card, which ac-cumulates the digitized signal (I,Q pairs), and a DSP card, which transfers the signal from the coherent integrator and has the option of performing low-level processing steps. Each receiver chain processes the signal from one of four an-tenna panels. Cohn et al. (1997) describe this configuration in more detail.
An early version of the Radian software, the Profiler On-line Program (POP), controlled the transmitter and was mod-ified to perform initial data handling from four receiver chains rather than one. This software runs under the DOS operating system. The modified POP accepted the time se-ries from the four DSP cards and wrote the data to exabyte tape. This process was slow, and with this configuration, MAPR spent less than 40% of the time (depending on the number of ranges sampled and number of time series points) sampling the atmosphere. A unix-based program called Pro-filer On-line Environment (POE) was developed at NCAR to replace this early version of POP. POE is built on the So-laris operating system and it controls the radar in the same way as POP, but is much more efficient in transferring data between the DSP memory and storage devices. POE has fa-cilitated several improvements to MAPR efficiency and reli-ability. POE operates in a multi-tasking environment, and it is written in C++ (compared with POP in C) and, therefore, is easier to modify. With POE, data is first written to a large internal hard drive, and transferred to tape as a background process, increasing the time spent sampling the atmosphere to over 95%. Under the original modified POP, data collec-tion was delayed as time series were written to tape. POE also includes the option of processing times series data in real time into average correlation or spectral domain data, thereby greatly reducing the volume of data stored. Because a greater fraction of time is now spent sampling the atmosphere, more data is included in a one-minute average correlation function or spectrum, thereby improving signal detectability.
Another change facilitated by POE was the option of add-ing pulse-codadd-ing. Pulse-codadd-ing is described by Schmidt et al. (1979) and Ghebrebrhan (1990) and allows us to increase the average power and, therefore, SNR of MAPR without degrading the range resolution. DBS versions of POP have
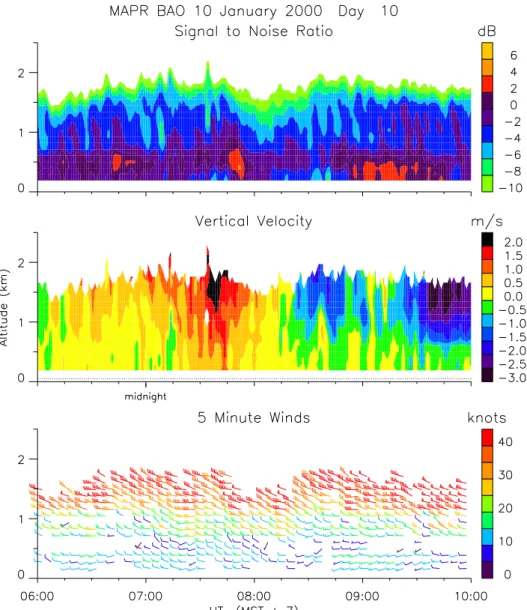
this ability, but it was not included in the modifications for MAPR. The improvements in MAPR sensitivity from a greater sampling duty cycle and from a higher average power now allow us to measure winds in clear air reliably. In addi-tion, wind estimates are now calculated in real time and the results presented graphically and archived. The full correla-tion analysis (FCA) method of Briggs (1984) is most often used to calculate winds, although the methods described by Holloway et al. (1997) have also been appled to MAPR data. Figure 1 shows MAPR observations of the passage of a downslope wind storm. The bottom plot shows horizontal wind profiles measured in clear air with 5 minute resolution. The top and center plots show the signal to noise ratio (SNR) and vertical wind speed, respectively, with 1 minute reso-lution. Note the persistent updraft seen near 0745 UT and downdraft near 0945 UT, as well as the higher frequency oscillations in vertical motion. The persistent motions are likely due to a stationary lee wave downwind of the continen-tal divide, with the higher frequency motions due to propa-gating waves.
3 Evaluation of wind measurements
During the winters of 1998–1999 and 1999–2000, long-term development tests were conducted at the NOAA Boulder At-mospheric Observatory in Erie, Colorado. This facility has a 300 m high instrumented tower, and other remote sensors are often present for testing. MAPR was located approximately 600 m south of the tower, the same location as in the earlier tests reported in Cohn et al. (1997). It was deployed as part of an NCAR Integrated Sounding System (ISS, Parsons et al., 1994), which includes a CLASS rawinsonde system and makes comparisons with co-located rawinsonde wind mea-surements possible. Comparisons of MAPR winds were pri-marily made with sonic and propeller anemometers at the 300 m level of the tower. However, to extend the compar-isons to a profile of altitudes, it was also possible to make oc-casional comparisons with consensus winds from a 449 MHz DBS wind profiler situated approximately 30 m from MAPR, and with CLASS rawinsondes launched from the MAPR ISS. MAPR winds for this evaluation were computed using FCA on correlation functions computed from 1 minute of data col-lection. Selected periods have also been analyzed using the “slope at zero lag” technique of Holloway et al. (1997). To remove outliers and improve precision, a consensus averag-ing algorithm (Strauch et al., 1984) is usually applied to these winds to compute a 5 or 10 minute or a 1 hour result. This consensus algorithm is the same as DBS wind profilers apply to radial velocity estimates.
3.1 Comparison with a 449 MHz DBS wind profiler and with CLASS rawinsondes
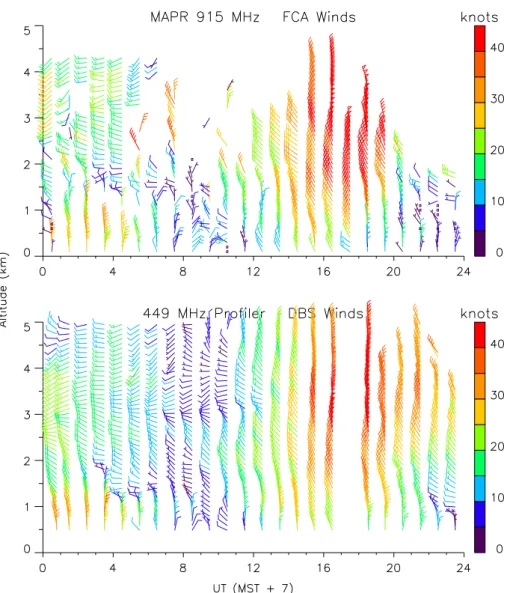
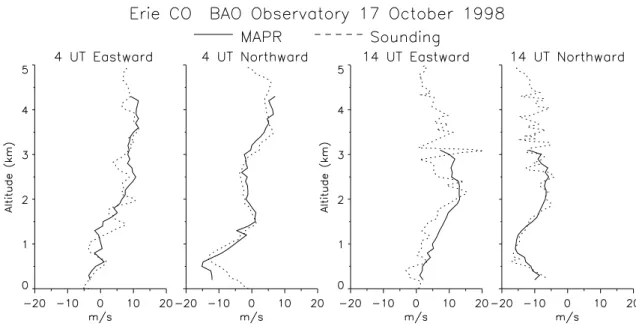
Figure 2 shows a full day comparison of MAPR winds with those from the 449 MHz profiler on 17 October 1998. While MAPR was designed to measure winds in the boundary layer
S.A. Cohn et al.: Clear air boundary layer spaced antenna wind measurement with the Multiple Antenna Profiler 847
Fig. 1. MAPR SNR (top), vertical air velocity (center), and 5 minute wind profiles (bottom) data during a strong downslope wind event on
10 January 2000, in Erie, Colorado.
and lower troposphere, the 449 MHz profiler is a quarter-scale version of the operational NOAA network wind profil-ers (e.g. Weber et al., 1990). This profiler is much more sen-sitive than MAPR, with an average transmitter power about 10 times greater and an antenna area that is also about 10 times greater. The figure compares 1 hour consensus winds from the 449 MHz profiler to a 1 hour consensus of 1 minute MAPR winds. Figure 3 compares MAPR winds with two CLASS rawinsonde wind profiles at 4 UT and 14 UT on the same day. In this figure, MAPR winds are a 30 minute average beginning with the time of launch. Both of these figures show general agreement, with areas of disagreement. MAPR winds in Fig. 2 are missing (failed the consensus test) where the SNR is weak, and winds from both profilers below 500 m are probably contaminated by ground clutter. This is also true of low level winds in the sounding comparison. In Fig. 3, MAPR eastward winds appear overestimated
com-pared to the sounding at 14 UT. However, as can be seen in Fig. 2, the eastward component was increasing during the 30 minute consensus period.
3.2 Comparison with sonic anemometers
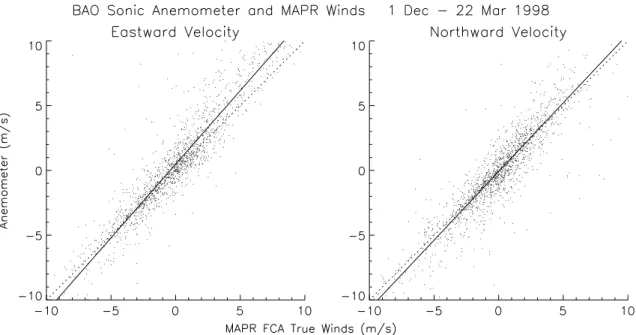
While wind profile comparisons with the sondes and the 449 MHz DBS profiler show general agreement, it is useful to make a more detailed comparison. For this, the higher time resolution wind measurements available from the sonic and propeller anemometers at the 300 m platform of the BAO tower are convenient. In light winds, the 300 m range gate of MAPR was relatively uncontaminated by ground clutter, making this comparison possible. A full day of winds mea-sured on 16 November 1998 is shown in Fig. 4. MAPR winds in this figure are a 10 minute consensus. The sonic anemometer winds were measured at 20 Hz and also aver-aged to 10 minutes. Because the MAPR pulse volume and
Fig. 2. Comparison of MAPR 1 hour wind profiles (top) on 17 October 1998 with those measured by a nearby 449 MHz DBS wind profiler
(bottom). Note that the 449 MHz profiler is much more sensitive than MAPR.
the BAO tower are about 600 m apart, and the MAPR pulse volume is more than 200000 m3, while the sonic samples over a path length of about 0.2 m, we cannot directly com-pare winds on time scales of less than several minutes. This figure shows good agreement with the MAPR winds close to the sonic anemometer values over a wide range of wind speeds and directions. However, there are times when dis-agreements as large as 3 m s−1occur. The larger variance in MAPR measurements at these times suggest degradation due to clutter or a low SNR, as larger variances are not pected with the far larger sample volume. In Fig. 5, we ex-tend this comparison to 4 months of data from December 1998 through March 1999. Each point in this scatterplot is a 1 hour average sonic anemometer wind plotted against a 1 hour consensus wind from MAPR. Approximately 56% of the MAPR data at 300 m was available during this period, with the remainder either filtered out because of clutter or
low SNR, or occasionally missing due to equipment failure. During this 3 month comparison we found a correlation coef-ficient of R2=0.75 to 0.80, and a standard deviation of about 1.5 m s−1. About 50% of the points agree within 1 m s−1,
and 80% agree within 2 m s−1. These values are quite good
relative to typical agreement between different instruments. For example, Weber et al. (1990) found a standard deviation of about 2.2 m s−1between hourly wind measurements of two co-located DBS wind profilers, and Martner et al. (1993) found the standard deviation between low level wind profiler winds and collocated rawinsondes measurements to range between 3–5 m s−1. In tropical conditions with strong SNR, Riddle et al. (1996) report standard deviations between 1.0– 1.5 m s−1in a similar comparison with rawinsondes. Even comparing the sonic anemometer, to a propeller anemome-ter, also located at the 300 m level of the tower, we find a standard deviation of 1.1 m s−1and a correlation coefficient
S.A. Cohn et al.: Clear air boundary layer spaced antenna wind measurement with the Multiple Antenna Profiler 849
Fig. 3. Comparison of MAPR 30 minute eastward and northward winds (solid) with CLASS rawinsonde measurements (dashed) at 4 UT
(left) and 14 UT (right) on 17 October 1998. The MAPR averaging time began with the sonde launch.
Fig. 4. Comparison of MAPR eastward (top) and northward (bottom) 10 minute winds (crosses) on 16 November 1998 with 10 minute winds
Fig. 5. MAPR 1 hour consensus winds compared with 1 hour median sonic anemometer winds from 1 December 1998 through 22 March
1999. The dashed line represents a slope of 1, and the sold line is a least squares fit.
of R2=0.9.
3.3 MAPR performance as a function of wind speed
The tower wind dataset can be used to evaluate MAPR wind measurements in more detail, assessing the range of atmo-spheric situations when the measurements are valid. A com-parison of the standard deviation between the profiler and sonic anemometer 5 minute winds as a function of wind speed and wind direction is shown in Fig. 6. There is no significant difference between agreement in winds from the N or S, and winds from the E or W, implying that the av-eraging time is sufficient to reduce differences due to scales of motion smaller than the 600 m separation of the measure-ments (MAPR is located about 600 m to the south of the tower). The figure also shows that the errors increase for wind speeds greater than about 10 m s−1, when the corre-lation functions have a short fading time and thus are very narrow. Clutter caused by the stronger winds has also in-creased these errors. The errors at small wind speeds (less than about 3 m s−1) are small, but the relative errors can be
quite large. We believe these errors at small wind speeds are due to weak clutter, rather than statistical variance, because they are not reduced with greater averaging. Note that the results of Fig. 6 apply specifically to the MAPR data collec-tion parameters used, to the FCA technique, and to the BAO site with its strong clutter. It is possible that other SA analy-sis techniques would perform better or worse over a different range of wind speeds. In particular, full spectral analysis has shown good results at high wind speeds because the spectral phase slope can be estimated using a wide range of frequen-cies due to beam broadening.
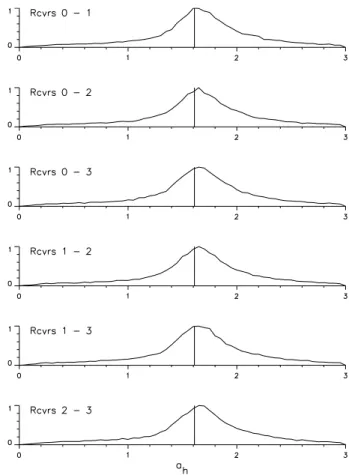
4 The antenna parameter ah
Cohn et al. (1997) used the parameter ah, described in
Hol-loway et al. (1997), to evaluate MAPR performance against a theoretical expectation. The theoretical value of this pa-rameter is solely a function of the transmitting and receiving antenna patterns. A measured value can be found from the value of the normalized cross-correlation magnitude of two receiver signals at zero lag, c12(0), and the distance between
those two receivers, 1x. ah =
2 1x
p
−ln[c12(0)]
The cross-correlation function is assumed to have been nor-malized such that the same normalization applied to the au-tocorrelation functions of each receiver (after noise removal) results in an autocorrelation of 1 at zero lag. For the MAPR antenna, this theoretical value is ah≈1.6. Cohn et al. (1997)
showed that measured values of ahapproximately agree with
this value in precipitation (strong SNR). We have repeated this exercise for a clear air case with weaker SNR in Fig. 7. The results are very similar to those of Cohn et al. (1997), showing a distribution of values centered slightly above 1.6. The scatter of values (width of this distribution) is greater in this clear air case than in the snow. This exercise is important not only because it tells us that our antenna beamwidths are correct, but also because it tells us whether we are properly normalizing the correlation functions, and ultimately it may provide information about clutter.
Although from SA theory we expect both auto and cross-correlation functions (magnitudes) to approach zero at large lags, we usually find this is not the case. These functions are more often a Gaussian-like feature raised by a positive offset present at all lags. One explanation for this offset is that we
S.A. Cohn et al.: Clear air boundary layer spaced antenna wind measurement with the Multiple Antenna Profiler 851
Fig. 6. Average absolute error between 5 minute MAPR and sonic
winds as a function of wind speed (top), wind direction (middle), and the (ah) parameter (bottom). This is for the same dataset as Fig. 4.
do not have an infinitely long time series, so statistical vari-ation in the magnitude of the complex correlvari-ation functions is not negligible (it must necessarily be positive). We would expect the offset, if due to statistical noise, to decrease with increasing averaging time. This has been verified in cases of very strong SNR. But there is another mechanism which could create an offset. Unlike SA measurements in the mid-dle and upper atmosphere, radar measurements in the bound-ary layer are often contaminated with ground clutter, both stationary and slowly moving. In the case of nearly station-ary ground clutter (for example, caused by backscatter from swaying trees and leaves), the decorrelation time of the clut-ter signal is quite long compared to the decorrelation time of the atmosphere (a function of wind speed and turbulence, and precipitation fall speed and differential fall speed, if present).
Fig. 7. Histograms of the parameter (ah) for each receiver pair. The distributions are centered just above the theoretical value of approximately 1.6 (vertical line).
Perfectly stationary ground clutter is removed by subtracting the mean from each time series before correlations are com-puted, but this slowly varying clutter can produce an offset which will not decrease with increasing averaging. For low SNR cases near the surface, we have verified that this is the case: more averaging does not decrease the offset.
In a simple attempt to compensate for the effects of this clutter, we have normalized the correlation functions after first subtracting this offset, found by examining the correla-tion funccorrela-tion at large lags. Without this step, the distribucorrela-tion of measured ah in Fig. 7 would be shifted to significantly
higher values. Improperly normalizing the correlation func-tions will lead to varying error in the wind measurement, de-pending on the SA method used. The error in the “slope at zero lag” method, for example, will be proportional to the fractional error in normalization, while the error in FCA is more complex. Figure 6c shows the standard deviation, again for 5 minute winds, as a function of the measured ah. The
agreement is noticeably better when ahis close to the
theo-retical value of 1.6, suggesting that our normalization process is beneficial.
The parameter ahmay be even more useful in a clutter
re-moval algorithm. Removing the offset from the correlation function could be done in a way that normalization of the
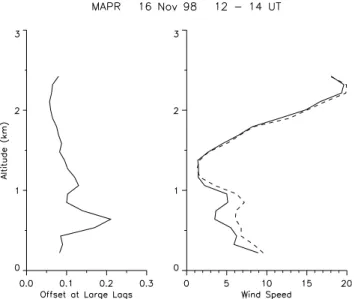
Fig. 8. The average magnitude of the normalized correlation
func-tion offset at large lags (left), and the wind profile computed using FCA and correlation functions without (solid) and with (dashed) re-moval of these offsets. This is a two-hour average from 12–14 UT on 16 November 1998.
correlations is adjusted to match the expected value of ah, so
the distribution of Fig. 7 collapses to a single value. How-ever, filtering data at the time series level may be an even more effective procedure to remove slowly moving clutter. In an iterative process, for example, as more severe filters are applied in the time series, the resulting measured ah could
indicate when the optimal degree of filtering is reached. To test the idea that removal of the correlation offset at large lags compensates for clutter, we compare an average wind profile computed using FCA both with and without this removal process. Figure 8 shows a profile of the average off-set seen in two hours of data during a period of strong surface winds (left), and the wind profile with and without removing this offset (right). Clutter from the BAO tower is the likely cause of the large offset seen at 600 m. A minimum in the wind speed profile at this height (solid) is present, perhaps because of the strong signal from a slowly swaying tower, but this minimum is not present when the offset is removed (dashed line). While we have no measurements which can verify the wind at this height, it appears that removal of the offset has improved the wind profile accuracy.
5 Discussion and conclusions
Development of MAPR was first intended to explore spaced antenna techniques at UHF in the boundary layer. SA had previously been used primarily in the stratosphere and above, and used by VHF radars, which could take advantage of the aspect sensitivity backscattered from a vertical beam. Also, new methods for estimating wind from spaced antenna sig-nals were being derived (Doviak et al., 1996; Holloway et al., 1997) and MAPR was used to test these. More recently,
Fig. 9. The percent of 1 minute winds passing the FCA quality
criteria as a function of the mean SNR. Each point summarizes all data below 1 km for a full day between 1 December 1999 and 31 January 2000.
a VHF wind profiler has been developed for boundary layer use (Vincent et al., 1998). The scientific motivation for MAPR is to overcome some limitations of DBS wind pro-filers in the boundary layer, in particular, the assumptions of a temporally constant and uniform (or linearly varying) wind field over a volume enclosing all beam directions. These as-sumptions are easily violated, for example, with thermals in a convective boundary layer, which may advect through the field of view of a profiler in a few minutes. If a vertically directed profiler beam samples the thermal, but subsequent oblique beams do not, the resulting horizontal wind measure-ment will be biased. Typical DBS wind profilers will average over 30–60 minutes, increasing the likelihood that all beams will sample a similar set of wind conditions. Measurements with a spaced antenna wind profiler, using only a vertically directed beam, require this same assumption but over a much smaller volume, so SA winds will be more accurate in in-homogeneous conditions. This makes SA boundary layer profiling especially useful in a convective boundary layer, in complex terrain, and when averaging times less than 30 min-utes are required. However, the precision of SA methods suf-fer at low SNR compared with the DBS method. Doviak et al. (1998) have shown that, theoretically, for large SNR and uniform flow, the wind estimate precision of SA and DBS techniques are comparable, but the SA profiler can measure with significantly better resolution. However, in conditions of low SNR, the DBS measurement will be more precise.
The MAPR upgrades, described in section 2, have im-proved its sensitivity enough to make high time-resolution clear air measurements possible. MAPR has now been used in field deployments to study tropical meteorology from a ship in the Nauru99 experiment (Brown et al., 2000), and to study winter fronts in Colorado (Parsons et al., 1999). It has
S.A. Cohn et al.: Clear air boundary layer spaced antenna wind measurement with the Multiple Antenna Profiler 853 also been used in the Vertical Transport and Mixing
Exper-iment (VTMX) to study nocturnal boundary layer motions and layers in November 2000 in the Salt Lake City, Utah ur-ban basin.
MAPR can be improved by further increasing its sensitiv-ity (or SNR) and by better recognizing and removing effects of clutter (both stationary ground clutter, and moving clutter, such as birds). Figure 9 illustrates the benefits of increased SNR. For each day between 1 December 1999 and 31 Jan-uary 2000, we have calculated the mean SNR in the low-est 1 km of measurements, and also the fraction of 1 minute wind measurements which have passed the FCA quality cri-teria. This figure suggests that each 3 dB increase in SNR will increase the fraction of winds measured by about 15%. Of course, this relation will not hold for very weak or very strong signals. To improve sensitivity and reduce clutter, fur-ther hardware upgrades are planned. A more powerful trans-mitter will soon be available for MAPR, resulting in an in-crease in SNR of approximately 10 dB. Also, much of the four analog receiver chains, as well as coherent integrators and DSP cards will soon be replaced with PIRAQ-II radar cards (Randall, 1999). These digitize the received signals at an intermediate frequency, and use digital filters and mix-ers. Use of PIRAQ-II is expected to reduce system noise (increasing SNR) and also increase the dynamic range of the receivers. This is important because clutter can saturate the receivers, distorting the signals in a way in which the atmo-spheric signal is not recoverable.
Acknowledgements. The BAO tower is operated by the NOAA
En-vironmental Technology Laboratory. We thank C. Russell, B. Tem-pleman, and J. Cole for their assistance with the anemometer data collection. Data from the 449 MHz wind profiler is courtesy of J. Jordan. Development of MAPR was partly sponsored by Depart-ment of Energy. Analysis of this data was partly supported by a grant for the VTMX experiment. NCAR is operated by the Uni-versity Corporation for Atmospheric Research under sponsorship of the National Science Foundation.
Topical Editor J.-P. Duvel thanks J. van Baelen and W. Angevine for their help in evaluating this paper.
References
Briggs, B. H., The analysis of spaced sensor records by correlation techniques, Middle Atmosphere Program: Handbook for MAP, 13, Ground-Based Techniques, edited by R. A. Vincent, 1984. Briggs, B. H., Phillips, G. J., and Shinn, D. H., The analysis of
observations on spaced receivers of the fading of radio signals, Proc. Phys. Soc. London Sect. B, 63, 106–121, 1950.
Brown, W. O. J., Parsons, D. B., Cohn, S. A., Miller, E. R., and Yoneyama, K., Profiler, radiometer, SST, and meteorolog-ical observations from the R/V Murai during Nauru99, Proc. 10th Atmospheric Radiation Measurement (ARM) Science Team Meeting, 13–17 March, 2000, San Antonio, TX, 2000 (avail-able at http://www.arm.gov/docs/documents/technical/conf10/ P00138.html).
Carter, D. A., Gage, K. S., Ecklund, W. L., Angevine, W. M., John-ston, P. E., Riddle, A. C., Wilson, J., and Williams, C. R.,
Devel-opments in UHF lower tropospheric wind profiling at NOAA’s Aeronomy Laboratory, Radio Sci., 30, 977–1001, 1995. Cohn, S. A., Holloway, C. L., Oncley, S. P., Doviak, R. J., and
Lataitis, R. J., Validation of a UHF spaced antenna wind profiler for high-resolution boundary layer observations, Radio Sci., 32, 1279–1296, 1997.
Doviak, R. J., Cohn, S. A., Holloway, C. L., and Lataitis, R. J., Theoretical comparisons of spaced antenna and Doppler beam swinging profiler performances for laminar flow measure-ments, Proceedings Eighth International Workshop on Techni-cal and Scientific Aspects of MST Radar, Bangalore, India, 15–20 December, 1997. Solar Terrestrial Energy Program, July, 1998, Belva Edwards, Ed., (Copies available from J. H. Allen, SCOSTEP Secretariat, NOAA, 325, Broadway, Boulder, CO 80303), 57–60, 1998.
Doviak, R. J., Lataitis, R. J., and Holloway,C. L., Cross correlations and cross spectra for spaced antenna wind profilers 1. Theoretical analysis, Radio Sci., 31, 157–180, 1996.
Ecklund, W. L., Carter, D. A., Balsley, B. B., Currier, P. E., Green, J. L., Weber, B. L., and Gage, K. S., Field tests of a lower tropo-spheric wind profiler, Radio Sci., 25, 899–906, 1990.
Ghebrebrhan, O., Full decoding of truncated ranges for ST/MST radar applications, IEEE Trans. Geosci. Remote Sens., 28, 14– 18, 1990.
Holloway, C. L., Doviak, R. J., Cohn, S. A., Lataitis, R. J., and Van Baelen, J. S., Cross correlations and cross spectra for spaced antenna wind profilers, Part 2: Algorithms to estimate wind and turbulence, Radio Sci., 32, 967–982, 1997.
Kaimal, J. C. and Gaynor, J. E., The Boulder Atmospheric Obser-vatory, J. Appl. Meteorol., 22, 863–880, 1983.
Martner, B. E., Wuertz, D. B., Stankov, B. B., Strauch, R. G., West-water, E. R., Gage, K. S., Ecklund, W. L., Martin, C. L., and Dabberdt, W. F., An evaluation of wind profiler, RASS, and mi-crowave radiometer performance, Bull. Amer. Meteor. Soc., 74, 599–613, 1993.
Parsons, D. B., Brown, W. O. J., and Cohn, S. A., High resolution measurements of cold- fronts observed in Colorado by in situ in-strumentation and a spaced antenna wind profiler, Proc. 29th In-ternational Conference on Radar Meteorology, 12–16 July 1999, Montreal, Quebec, Canada, Amer. Meteor. Soc., 557–560, 1999. Parsons, D. et al., The integrated sounding system: Description and preliminary observations from TOGA COARE, Bull. Am. Mete-orol. Soc., 75, 553–567, 1994.
Randall, M., PIRAQ-II: PC based radar digital receiver/processor offers more than MIPS, Proc. 29th International Conference on Radar Meteorology, 12–16 July 1999, Montreal, Quebec, Canada, Amer. Meteor. Soc., 525–528, 1999.
Riddle, A. C., Angevine, W. M., Ecklund, W. L., Miller, E. R., Parsons, D. B., Carter, D. A., and Gage, K. S., In-situ and re-motely sensed horizontal winds and temperature intercompar-isons obtained using Integrated Sounding Systems during TOGA COARE, Contrib. Atmos. Phys., 69, 49–61, 1996.
Schmidt, G., Ruster, R., and Czechowsky, P., Complementary code and digital filtering for detection of weak VHF radar signals from the mesosphere, IEEE Trans. Geosci. Electron., 17, 154–161, 1979.
Strauch, R. G., Merritt, D. A., Moran, K. P., Earnshaw, K. B., and van de Kamp, D., The Colorado wind profiling network, J. At-mos. Oceanic Technol., 1, 37–49, 1984.
Van Baelen, J. S., First results with the UHF boundary layer Doppler/Interferometric Profiler, Proc. Sixth Workshop on Tech-nical and Scientific Aspects of MST Radar, 17–20 August
1993, Chung-Li, Taiwan, (Copies available from J. H. Allen, SCOSTEP Secretariat, NOAA, 325 Broadway, Boulder, Col-orado 80303), 329-334, 1994.
Vincent, R. A., Dullaway, S., MacKinnon, A., Reid, I. M., and Zink, F., A VHF boundary layer radar: First results, Radio Sci., 33, 845–860, 1998.
Weber, B. L., Wuertz, D. B., Strauch, R. G., Merritt, D. A., Moran, K. P., Law, D. C., van de Kamp, D., Chadwick, R. B., Ackley, M. H., Barth, M. F., Abshire, N. L., Miller, P. A., and Schlatter, T. W., Preliminary evaluation of the first NOAA demonstration network wind profiler, J. Atmos. Oceanic Technol., 7, 909–918, 1990.